
Core Web Vitals as a Ranking Signal
Google’s Core Web Vitals, introduced in 2020, unified guidance for measuring web UX through three core metrics: loading, interactivity, and visual stability. While it might be tempting to treat these as nice-to-have optimizations, the page experience update rolled out to ranking systems between mid-June and the end of August 2021. This means Core Web Vitals now factor into Google Search rankings.
Drastic overnight changes to SERPs are unlikely. Page usability is one ranking factor alongside query intent, content relevance, source quality, context, and user settings. Moreover, few sites are prepared. A Google Core Web Vitals Study from April 2021 found that only four percent of websites examined scored well across all three metrics. That leaves substantial room for early adopters to stand out. Google’s own research also shows that visitors are 24% less likely to abandon pages that meet these thresholds, and user expectations for seamless experiences are only rising.
The Three Core Metrics

Core Web Vitals represents the subset of Web Vitals that matters most. The metrics are not static—they are the best available indicators today and will likely evolve. The current set is:

Each addresses a distinct part of the page experience: how fast content loads, how quickly the page responds to input, and how stable the visual layout remains.
Largest Contentful Paint
LCP measures the time it takes to render the largest element within the visible viewport, reflecting when the main content is ready for the user. Candidate elements include:
<img><image>inside an<svg>(note: the<svg>itself is not currently a candidate)<video>- elements with background images loaded via
url() - block-level elements containing text or inline text descendants.
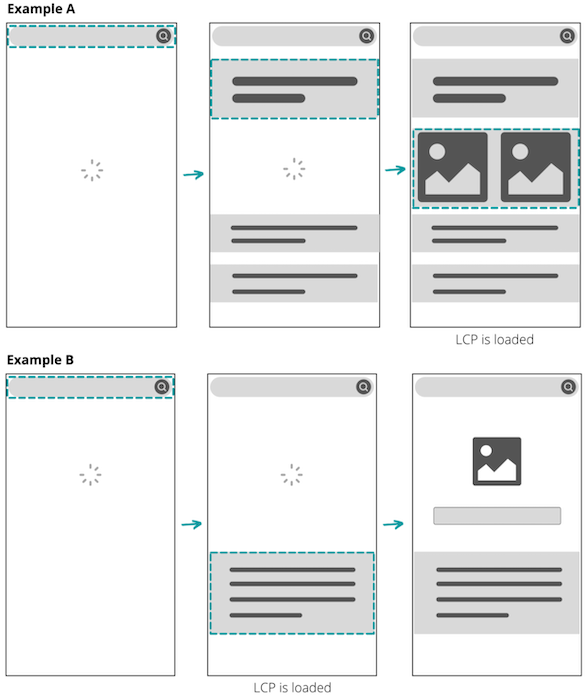
During page load, the LCP candidate can change as larger elements appear. An early text block may register as a good LCP before an image loads late in the process. The recommended threshold is 2.5 seconds or less, derived from research indicating users lose focus after roughly 0.3 to 3 seconds of waiting, combined with data showing top-performing sites consistently hit this mark.
| Good | Poor | |
| LCP | <= 2.5s | > 4s |
| FID | <= 100ms | > 300ms |
| CLS | <= 0.1 | > 0.25 |
First Input Delay
FID measures the delay between a user's first interaction—like clicking a button—and the browser's ability to process that event. During load, the main thread handles parsing and JS execution, so incoming events can queue. FID only tracks this delay in event processing. The time needed to process the event and update the UI is deliberately excluded to prevent developers gaming scores with asynchronous workarounds that wouldn't actually improve user experience.
Even without registered event listeners, the main thread can delay interactions with:
<input>,<textarea>, and checkboxes<select>dropdowns<a>links
A good score is 0.1 second, a limit identified in usability research from 1993—well within the threshold where users perceive a system as reacting instantaneously.
Cumulative Layout Shift
CLS measures visual stability by summing unexpected layout shifts, defined by the Layout Instability API. Adding new DOM elements or resizing existing ones doesn't count—only when existing elements change their start position. The scoring methodology was updated in June 2021 to group shifts so scores don't grow indefinitely on long-lived pages like SPAs.
Not all shifts count as negative. Expected shifts within 500 ms after user interaction are excluded, encouraging developers to reserve space with loading states right after input.
The CLS score calculation uses:
- Impact fraction: the space an unstable element occupies in the viewport (element covering 60% of viewport = 0.6)
- Distance fraction: how far an element moves as a percentage of viewport height (25% movement = 0.25)
- Score: multiplying both — in this example, 0.15
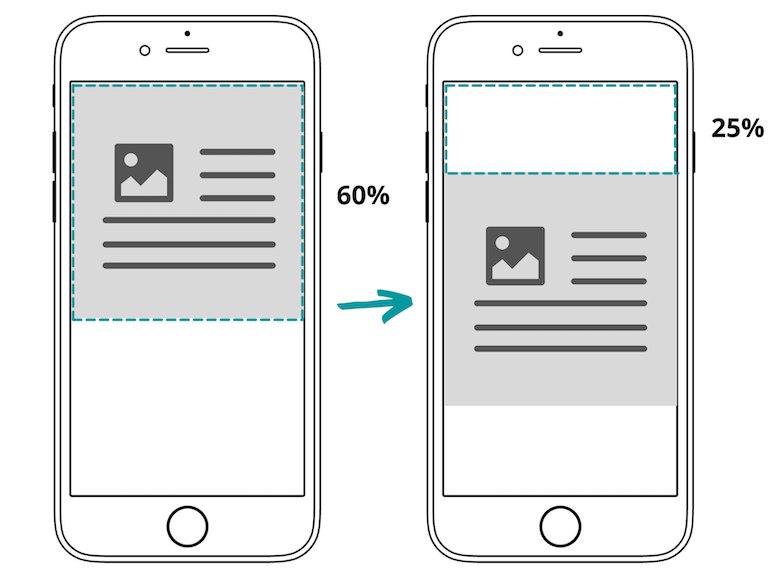
A good CLS is 0.1 or less. Real-world data shows shifts at this level are still noticeable to users but not disruptive, while scores of 0.15 and above are consistently bad.
Measuring Core Web Vitals
Two approaches exist for testing pages: lab measurement and field data. Lab testing simulates conditions in a controlled environment, ideal for pre-release testing. Field data reflects real user experiences. Most tools fall into one of these categories.
Lab-Based Tools
Lab data can't measure FID since real user input isn't available. The standard proxy metric instead is Total Blocking Time.
- Lighthouse: A comprehensive option accessible via Chrome DevTools. It works on public and authenticated pages, provides personalized improvement suggestions, but requires the page to remain visible—preventing parallel analysis of multiple pages. Lighthouse CI enables integration into automated workflows.
- WebPageTest: Handles public pages with detailed waterfall views, letting you dig into resource loading. Test from various locations, browsers, and emulators to identify regional performance issues and CDN needs. A caution: it can produce reports on login pages rather than authenticated content, and it doesn't offer advice for improvements.

Field-Measured Data
Extensions like the Web Vitals browser extension provide views of the current page only. The tool lists each metric and shows how it's calculated in real time—FID stays disabled until an actual interaction occurs, which is the clearest way to understand how these scores are computed. Field tools can also reveal real-user experiences through destination APIs.
Field Data Versus Lab Data
Lab-based testing gives you a controlled, repeatable snapshot of performance, but it can't capture the full range of experiences your users actually have. Real User Monitoring (RUM) fills that gap by collecting performance data from real visitors across different devices, network conditions, and personalized page states. For a quick look at real-world performance without implementing your own tracking, the Chrome User Experience Report (CrUX) aggregates UX metrics from across the public web. Several tools build on this dataset:
- Chrome UX Report Compare Tool (CRUX): Compares pages by device type (desktop, tablet, mobile) and lets you benchmark against competitor sites using the same underlying data.
- PageSpeed Insights: Provides detailed analysis for URLs Google's crawlers know about, along with specific improvement opportunities.
- Search Console: Reports per-page performance with historical data; you'll need to verify site ownership first.
- Web Vitals extension: In addition to lab measurements (labeled "local"), this tool can show field data from CrUX for pages that have it, indicating how your individual experience compares to other users.
CrUX-based tools are a good starting point, but your own RUM data gives you more immediate and granular feedback. Setting it up typically involves two steps: implementing a RUM JavaScript snippet in your source code, and then collecting that data when users interact with or leave the site. The collected data is processed, stored, and viewable through dashboards.
From Insights to Action
Core Web Vitals metrics reveal where the user experience is suffering. Running RUM—even for just a few hours—can surface your worst-performing metrics and pages, pointing you toward the highest-impact areas for investigation. The tooling mentioned above can then suggest specific fixes. A useful side effect is that changes targeting one metric often lift the others as well.
The suggested improvements range from quick wins to major refactoring projects. Start with these four strategies:
- Update third-party libraries. Auditing your dependencies may reveal unused libraries, lighter alternatives, or cases where you only need a portion of a library's features. Tree-shaking can help by loading only the specific code you register. Not every library supports it yet, but adoption is growing. As an example, Shopify's Oberlo team updated dependencies during an internal Hack Days and cut the compressed bundle size by 23% in less than three days of work. This helps FID and LCP.
- Preload critical assets. When the browser discovers key resources late in the loading process, you suffer needless delays. Explicitly fetching those resources early can make a major difference. Shopify observed a 50% (1.2 seconds) improvement in time-to-text-paint by preloading Web Fonts. This helps FID and LCP.
- Review server response time. If your Time to First Byte is slow, consider moving from shared to dedicated hosting, routing users to a nearby CDN, caching static assets, or using service workers to reduce the amount of data requested from the server. This helps FID and LCP.
- Optimize heavy elements. Implement lazy-loading to defer large resources like below-the-fold images until they're needed. Don't lazy-load elements in the initial viewport—your LCP element needs to load as fast as possible. Compress images so there are fewer bytes to download, and provide width and height attributes or aspect-ratio boxes so the browser can reserve the correct space, preventing layout shifts. This helps FID, LCP, and CLS.
Core Web Vitals is Google's framework for addressing the loading, interactivity, and visual stability problems that define much of web UX. The metrics and thresholds will evolve, so staying familiar with the measurement tools and improvement techniques remains the best preparation for whatever comes next.



