
Profiling style recalculation in Edge DevTools
CSS is not always the part of a page that slows it down, and it is rarely the cheapest performance win available. When styling is the suspected bottleneck, though, Edge DevTools offers a way to find the most expensive selectors instead of guessing.
The workflow, as laid out by Patrick Brosset on the Microsoft Edge Blog, looks like this:
- Open DevTools and switch to the Performance tab.
- Enable the "Enable advanced rendering instrumentation" option. This step is easy to miss.
- Record a page load.
- Open the "Bottom-Up" tab in the report and check the size of your recalculated styles.

With that in view, click any Recalculated Style event in the Main waterfall to reveal a "Selector Stats" tab.
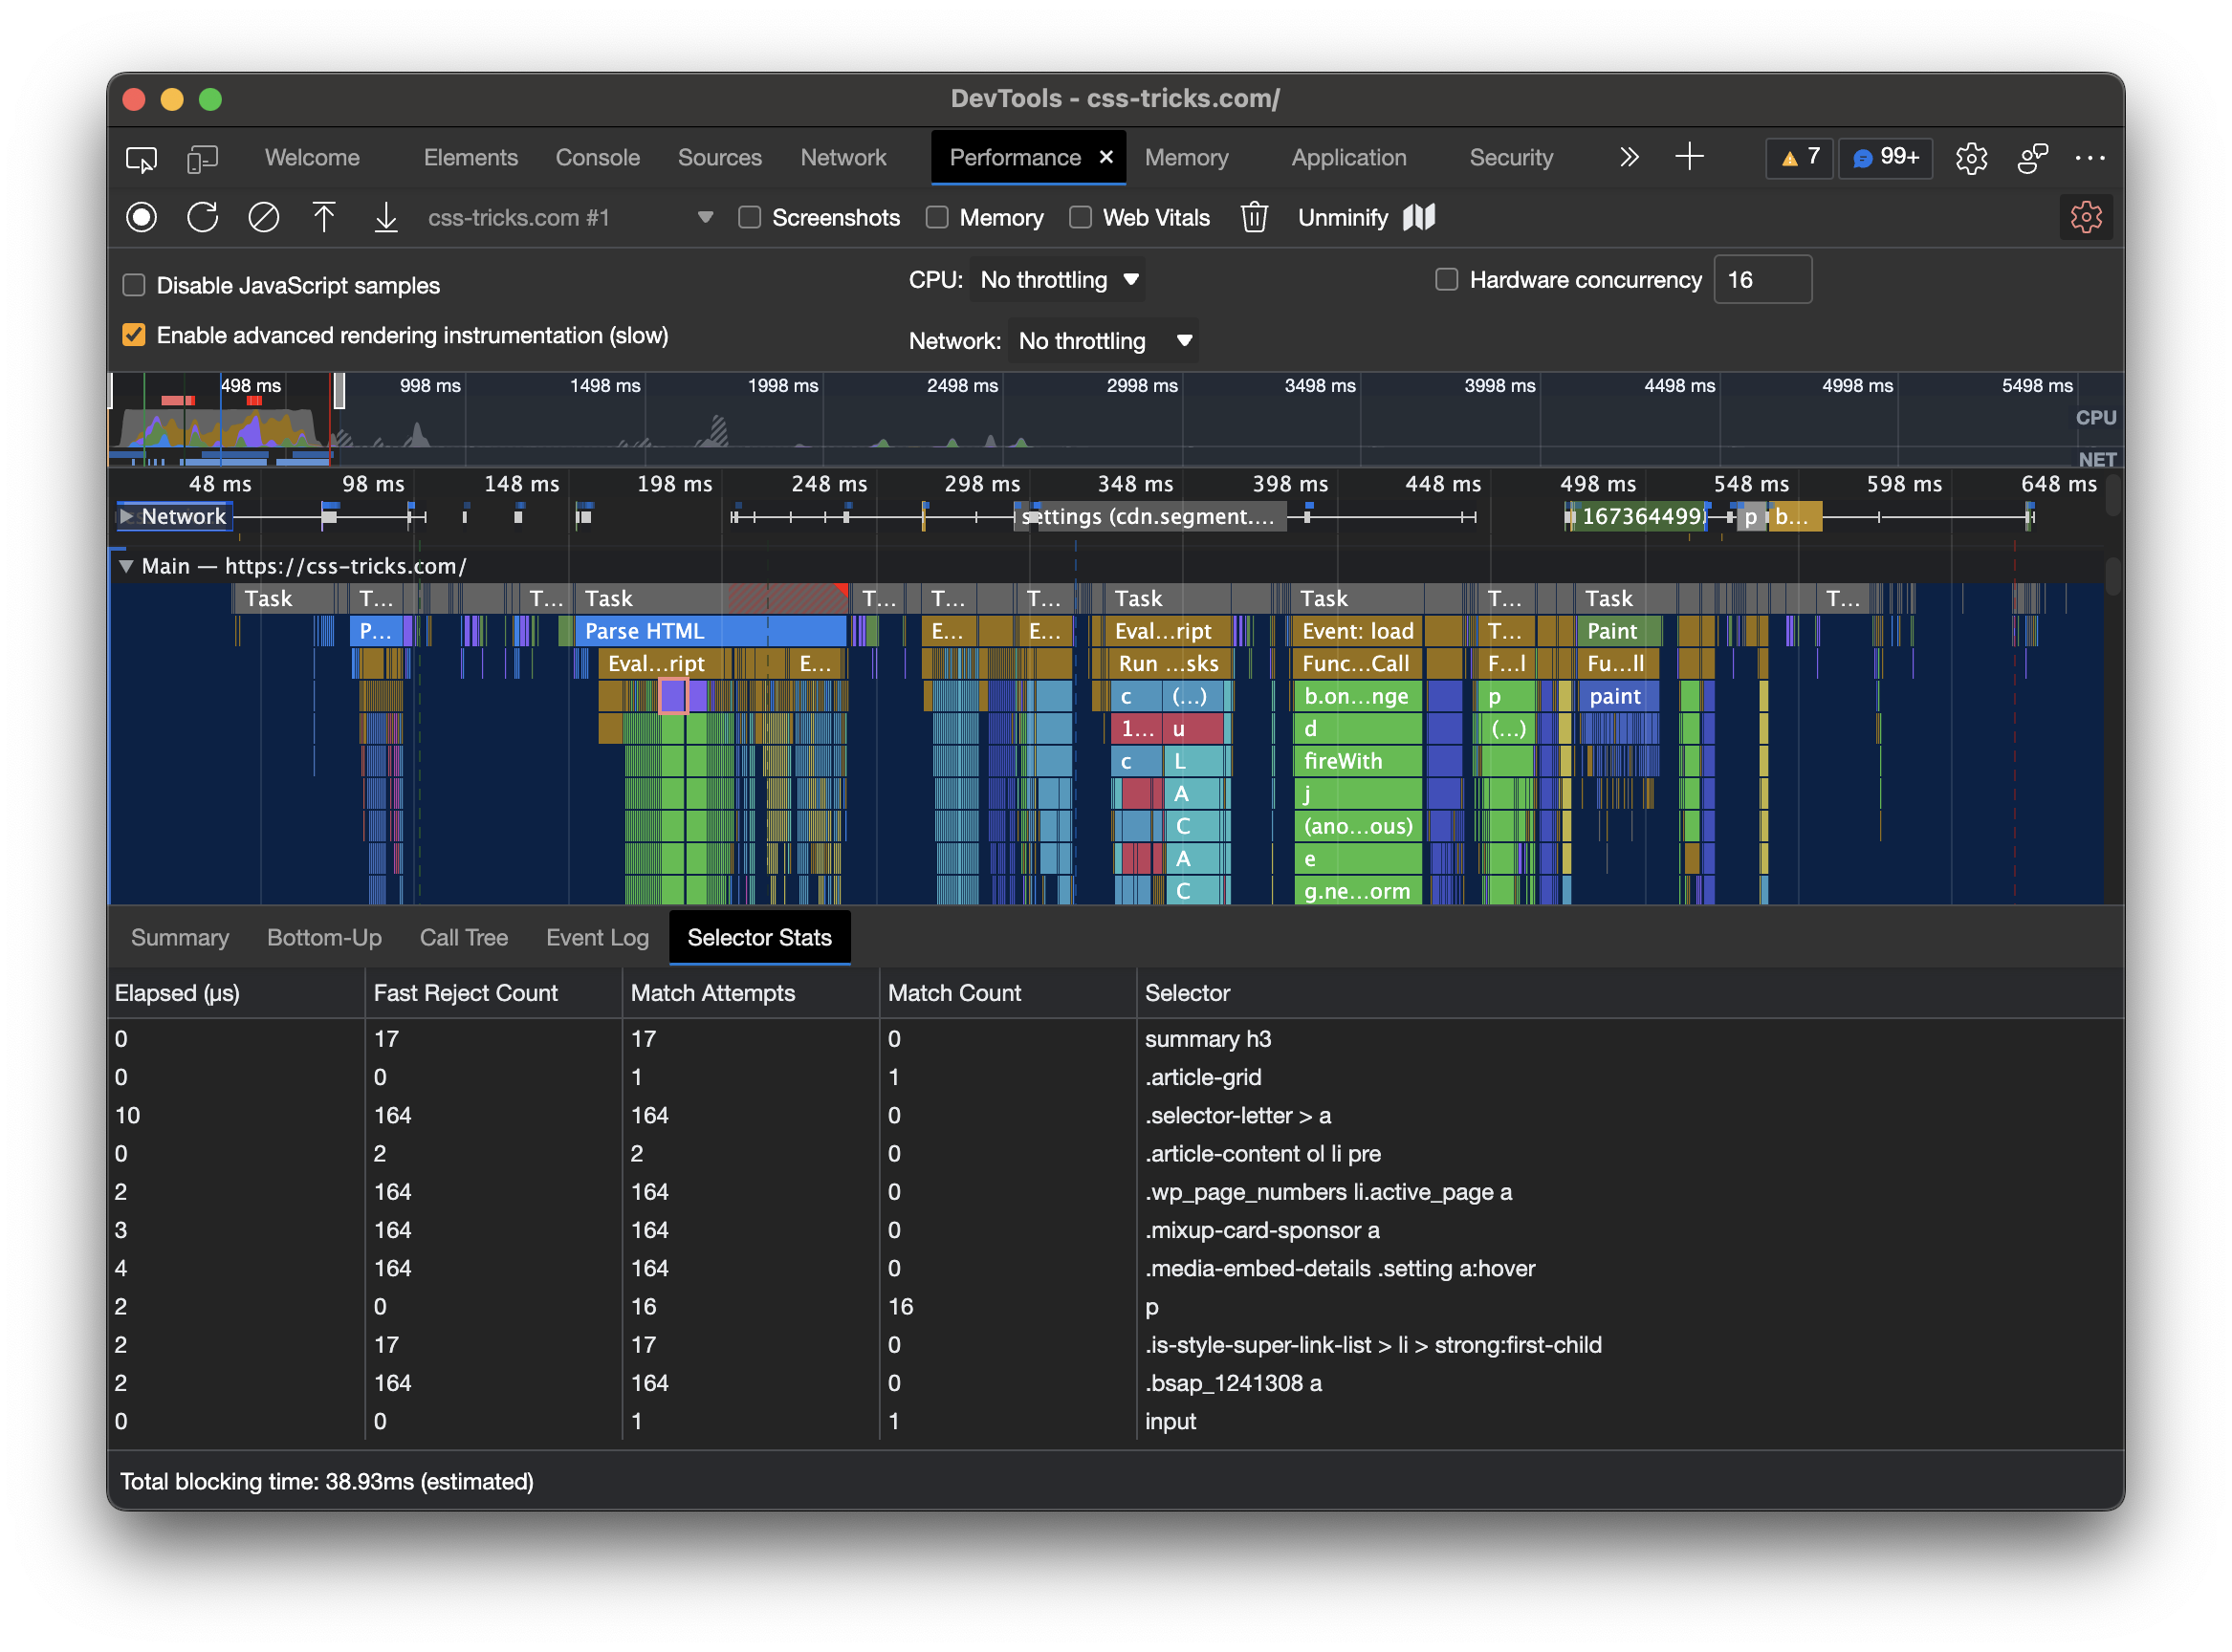
Reading the selector stats
The tab lists every selector that was processed. The list can be sorted by time taken, how many times a selector matched, the number of matching attempts, and the "fast reject count" — the count of elements that were quickly and easily eliminated from matching.
Those columns are the useful part of the investigation when CSS really is the problem: they point at specific selectors worth rewriting. For the deeper reasoning and a full case study, Brosset's original post on the Microsoft Edge Blog is the place to go.