A Cassandra Workload That Was Slower on Ubuntu
During a 2014 migration from CentOS to Ubuntu at Netflix, a Cassandra cluster showed write latency increases of over 30%, with CPU consumption rising by a similar amount. The Cassandra nodes were Xen-based EC2 VMs. The cause? A significant portion of CPU time was spent reading the clock — time itself had become the bottleneck.
Initial Checks and CPU Profiling
Basic tooling ruled out obvious culprits. top(1) showed only Cassandra consuming CPU, and execsnoop(8) found no short-lived processes restarting in a loop. The extra CPU time appeared to live inside Cassandra itself.
CPU flame graphs collected simultaneously from CentOS and Ubuntu instances (to match traffic) initially looked broken — the expected towers of green Java frames were missing. This was a known limitation of Java profiling at the time, which later motivated the -XX:+PreserveFramePointer fix. However, the broken stacks had a useful side effect: they aggregated otherwise fragmented Java call paths.
Even so, a striking difference was visible: the Ubuntu graph showed 32.1% of CPU time inside os::javaTimeMillis(), a libjvm function that fetches the current time. The CentOS instance had no such hotspot. This server spent roughly a third of its cycles checking the clock.
Interesting timing: the flame graph showed os::javaTimeMillis() calling the gettimeofday(2) syscall, which entered kernel functions tracesys() and syscall_trace_enter/exit(). This pointed to two theories:
- Ubuntu had some syscall tracing enabled (auditing, AppArmor).
- Time fetching was slower on Ubuntu due to a library, kernel, or clocksource change.
In the Xen guest, profiling used software cpu-clock interrupts rather than hardware NMIs, so disabled-interrupt kernel paths and hypervisor time were invisible in the graph. The visible frame widths leaned toward theory A, but the true breakdown could differ. Notably, Ubuntu also showed entry into the vDSO, the user-mode accelerator for syscalls like gettimeofday(2) — though Xen's pvclock source didn't support vDSO acceleration at the time.
Colleagues hadn't seen this; internet searches for os::javaTimeMillis, clocksource, tracesys(), Ubuntu, EC2, and Xen returned nothing then.
Microbenchmarking the Clock
To test whether os::javaTimeMillis() was slower on Ubuntu, a simple Java microbenchmark called System.currentTimeMillis() 100 million times in a loop, with a println() to prevent dead-code elimination:
$ cat TimeBench.java
public class TimeBench {
    public static void main(String[] args) {
        for (int i = 0; i < 100 * 1000 * 1000; i++) {
            long t0 = System.currentTimeMillis();
            if (t0 == 87362) {
                System.out.println("Bingo");
            }
        }
    }
}
Measured with the shell time command, the call cost roughly 0.13 microseconds on CentOS versus 0.68 microseconds on Ubuntu — about 5x slower. A C version calling gettimeofday(2) directly (compiled with -O0 to keep the loop intact) produced similar results.
Clocksource Experimentation
The next experiment was switching the kernel clocksource. Checking available options showed the system defaulted to xen:
$ cat /sys/devices/system/clocksource/clocksource0/available_clocksource
xen tsc hpet acpi_pm
$ cat /sys/devices/system/clocksource/clocksource0/current_clocksource
xen
Switching to tsc:
# echo tsc > /sys/devices/system/clocksource/clocksource0/current_clocksource
$ cat /sys/devices/system/clocksource/clocksource0/current_clocksource
tsc
$ time java TimeBench
real    0m3.370s
user    0m3.353s
sys     0m0.026s
This was an immediate and massive win: the Java microbenchmark ran over 20x faster, and nearly 4x faster than on CentOS. At 33 nanoseconds per call, loop overhead was likely inflating the measurement; unrolling the loop would improve accuracy further.
A Practical Workaround
The tsc clocksource reads the CPU's time stamp counter via RDTSC and, with the vDSO, avoids a syscall entirely. Traditionally not the default due to clock drift concerns, tsc had been stable for years, according to a processor engineer encountered at a conference. With Netflix's fault-tolerant architecture, switching to tsc in production was deemed an acceptable experiment.
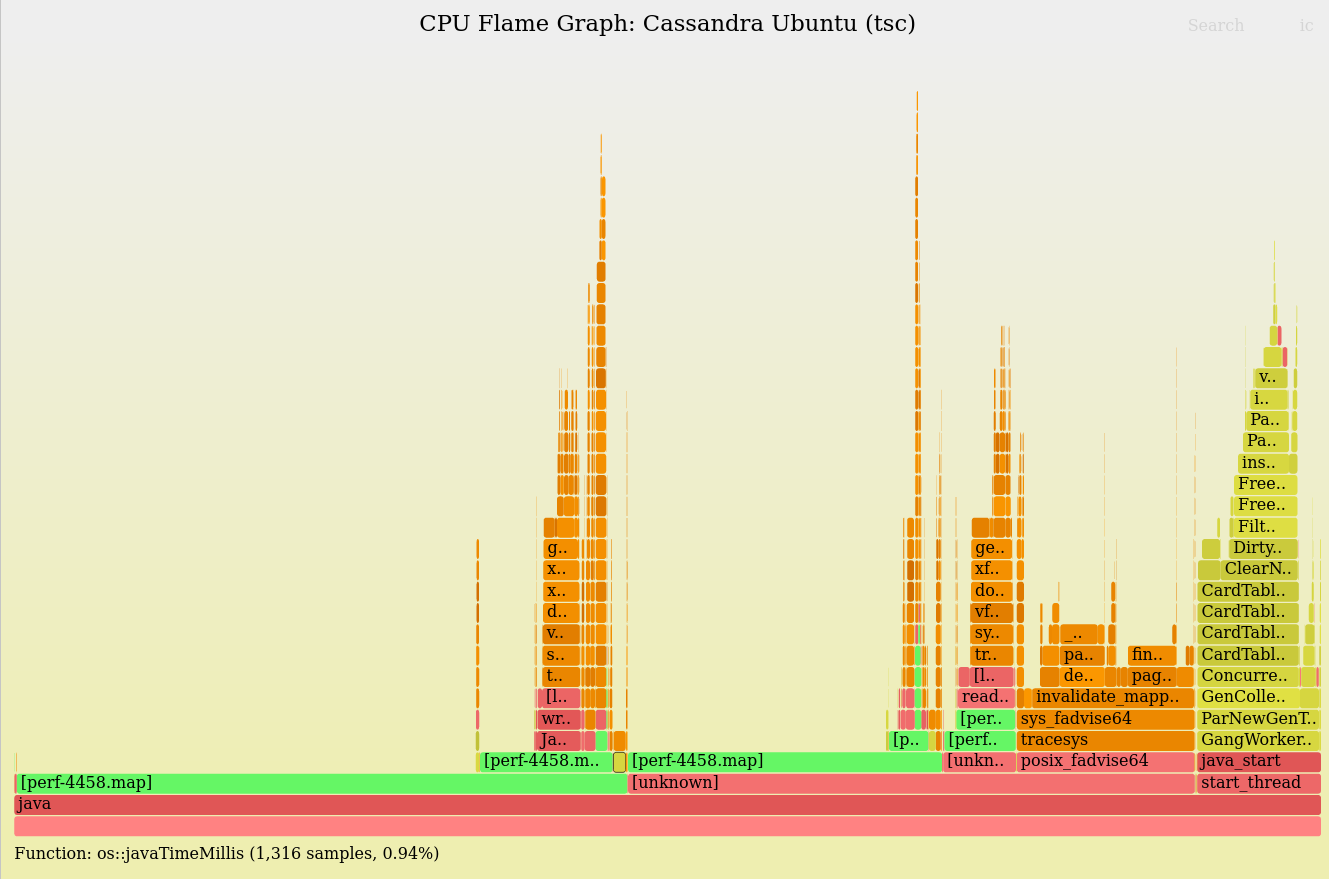
Production graphs confirmed the fix immediately. Write latency dropped by 43%, slightly outperforming the CentOS baseline. The new flame graph showed os::javaTimeMillis() down to 1.6%, now entering the [[vdso]] with no kernel calls above it:
Aftermath and Context
The issue replicated across other Netflix services, and tsc was set in the base AMI for all cloud workloads. Later in 2014, AWS's Anthony Liguori publicly recommended switching to tsc on Xen instances. By 2021, AWS officially recommends tsc for Xen-based EC2 instances and kvm-clock for Nitro-based ones. As of 2019 testing, kvm-clock was only about 20% slower than tsc — acceptable, but not attractive unless drift concerns re-emerge.
The tracesys() overhead seen in the original profiles was never fully root-caused; kernel changes shortly afterward removed it from stacks, and tsc remained the preferred workaround for the 4x performance gain. Java's jmh benchmark suite now includes System.currentTimeMillis(), making custom microbenchmarks unnecessary unless disassembly is required.
Choosing a Clocksource: Lessons and Takeaways
The performance cost of reading the clock can be a real bottleneck depending on the clocksource in use. This was particularly acute years ago on Xen virtual machine guests, where the virtualization overhead made clock reads expensive. On Linux, the tsc clocksource has long been the faster option, and it has been widely recommended for years. While no processor vendor can offer absolute guarantees against tsc clock drift, cloud providers like AWS have now officially endorsed it, which is a strong signal of its reliability in practice.
A key takeaway from this investigation is that not every performance problem requires heavyweight tracing tooling. For a focused question like "how costly is reading this clocksource?", the most effective approach was a pair of small, ad hoc microbenchmarks — each only a few lines of code. When you're examining a discrete, small system component, writing your own quick benchmark is often more direct and insightful than deploying a complex observability stack. Experimentation and observation are complementary; sometimes you need to build a quick test to get a concrete answer.
The results underscore a simple but easily overlooked point: the software layer you choose to read time can become the very thing that slows your system down. Always profile the clocksource itself when time-related code paths appear hot, and don't dismiss the humble microbenchmark as a tool for getting empirical answers quickly.



