
One orchestrator, many profilers
Strobelight is Meta’s profiling orchestrator: a service that combines many profiling technologies—most of them open source—into a single platform running on every production host in the fleet. It collects data on CPU usage, memory allocations, and other performance metrics from running processes, letting engineers identify bottlenecks, optimize code, and improve utilization.
The results can be dramatic. In one case, Strobelight-driven optimizations produced an estimated annual capacity savings equivalent to 15,000 servers. Beyond post-hoc analysis, Strobelight data feeds into pre-production tooling: if an engineer introduces an unintended copy of a large object on a critical path, existing tools can flag the issue and estimate compute cost. Meta’s code review tool can then warn the engineer that they’re about to waste, say, 20,000 servers. Static analysis alone can’t catch these cases—it’s unaware of global compute cost, and many inefficiencies only become costly when a service gradually ramps to millions of requests per minute.
Profilers work by sampling: they collect data every N events (or milliseconds, for time-based profiling) to build a statistical picture of where time is spent. A CPU-cycles profile, for example, shows CPU time attributed to functions and call stacks, giving engineers a high-level view of code execution.
Profiling on demand—or on a schedule
While other Meta daemons collect observability metrics, Strobelight focuses specifically on software profiling, connecting resource usage back to source code. Its profilers are often (but not exclusively) built on eBPF, the Linux kernel technology that allows safe injection of custom code into the kernel. eBPF enables very low-overhead data collection and is fundamental to much of what Strobelight does.
As of this writing, Strobelight includes 42 profilers:
- Memory profilers powered by jemalloc
- Function call count profilers
- Event-based profilers for native and non-native languages (Python, Java, Erlang)
- AI/GPU profilers
- Profilers for off-CPU time and service request latency
Engineers can run any of these on demand via a command line tool or a web UI.
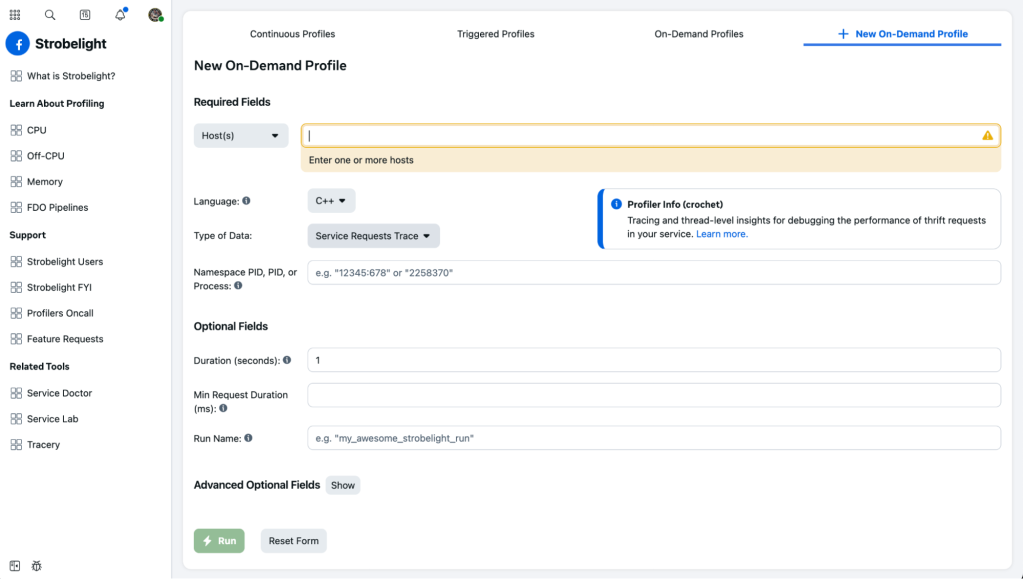
Continuous or triggered profiling is configured through Meta’s Configerator. Users can target their entire service, restrict to hosts in certain regions, and specify run frequency, duration, symbolization strategy, target process, and more. A simple configuration looks like this:
add_continuous_override_for_offcpu_data(
    "my_awesome_team", // the team that owns this service
    Type.SERVICE_ID,
    "my_awesome_service",
    30_000, // desired samples per hour
)
Why so many profilers? Because Meta runs so many different workloads on so many different technologies. Even so, Strobelight can’t cover everything out of the box—which is where ad-hoc profilers come in. Writing a new profiler from scratch takes several code changes and weeks of review and rollout. But an engineer can write a single bpftrace script, commit it, and have Strobelight run it like any other profiler across the fleet within hours. For example, someone tracking latency of a particular C++ function could do so with minimal effort.
This flexibility comes with safeguards. Strobelight prevents conflicts between profilers—for instance, ensuring two profilers don’t try to use the same PMU counter simultaneously (other services also use them). It enforces concurrency rules and queues profilers, though service owners retain the latitude to hammer their machines when they need extensive debugging data.
Continuous default coverage
A core Strobelight principle is automatic, regularly collected profiling data for all Meta services—a flight recorder that’s always there when needed. A handful of curated profilers run on every host by default, but not continuously. They use custom run intervals and sampling rates tailored to the workloads, providing enough data without impacting profiled services or overloading storage systems.
Strobelight applies dynamic sampling to hit target sample counts. Suppose a service named Soft Server runs on 1,000 hosts, and profiler A should gather 40,000 CPU-cycles samples per hour. Strobelight starts with a conservative run probability (a bias-prevention mechanism—profiling the same hosts at noon daily would hide traffic patterns). The next day, it checks the samples collected and adjusts the probability with simple math to try to hit the 40,000 target. This readjustment happens daily for every service at Meta.
When multiple services run on one host (not counting daemons like systemd or Strobelight itself), Strobelight defaults to the configuration that will yield more samples for all of them.
Different hosts can end up with different run probabilities and sampling rates, which raises a question: how is data aggregated or compared across hosts and services? Strobelight records a weight for each sample, reflecting the tuning knobs in effect. This normalization prevents bias in aggregate analysis. It works for comparing across hosts of one service and across different services, serving both service owners and efficiency engineers looking for horizontal wins in shared libraries.
Capacity savings from two key profilers
Last branch record (LBR) profiler
The LBR profiler samples last branch records, a hardware feature that originated on Intel. Its data isn’t visualized; instead, it feeds Meta’s feedback directed optimization (FDO) pipeline. That data produces FDO profiles consumed at compile time (CSSPGO) and post-compile time (BOLT), speeding up binaries using knowledge of actual runtime behavior. Meta’s top 200 services all use FDO profiles derived from LBR data collected fleet-wide. Some see up to 20% reduction in CPU cycles—a 10-20% reduction in servers needed.
Event profiler
Strobelight’s event profiler is its version of the Linux perf tool. It collects user and kernel stack traces from multiple performance events—CPU cycles, L3 cache misses, instructions, and more. Engineers use this data to find hot functions and call paths; it’s also fed into monitoring and testing tools to catch regressions before they reach production.
Making sense of the stacks
Flame graphs are useful, but a service owner looking at call stacks will see many functions from imported libraries and Meta’s software frameworks. What about isolating p99 latency request stacks, or finding unintended string copies?
Stack Schemas
Inspired by Microsoft’s stack tags, Stack Schemas is a small DSL that operates on call stacks to add tag strings to entire stacks or individual frames. These tags are usable in visualization tools. Schemas can also remove unwanted functions via regex matching. Any number of schemas can be applied per-service or per-profile to customize data.
Some engineers build dashboards from this metadata to spot expensive copying, inefficient C++ container usage, smart pointer overuse, and similar issues. Static analysis tools can detect these patterns in principle, but they can’t pinpoint the most painful or computationally expensive instances across a fleet of machines.
Strobemeta
Strobemeta uses thread local storage to attach dynamic metadata at runtime to call stacks collected by the event profiler (and others). This is a major benefit of eBPF-based profilers: complex, customized actions at sample time. Strobemeta data attributes call stacks to specific service endpoints, request latency metrics, or request identifiers, enabling more precise filtering of Strobelight’s high-volume profiling data.
Turning Addresses Into Symbols
Symbolization is the process of mapping a virtual instruction address in a binary back to a human-readable function name, along with the source file, line number, and type information when available. That kind of detail typically requires parsing a binary’s DWARF debug data, which can be tens of megabytes — or even gigabytes — because it carries much more than just names.
Downloading and parsing DWARF at profiling time is far too expensive. Even doing it on the same host after the profile is captured can strain memory and interfere with running workloads. Strobelight separates the problem by pushing symbolization into a dedicated service built on a stack of open source tools: DWARF, ELF, gsym, and blazesym. At the end of a profile, it sends a stack of raw binary addresses to that service, which replies with fully symbolized stacks — complete with file, line, type, and inline details.
That round trip is practical because the service already has done the heavy lifting. It downloads and parses DWARF data for Meta’s production binaries ahead of time, stores what is needed in a database, and then serves multiple symbolization requests from different Strobelight instances across the fleet.
Strobelight also defers all symbolization until after profiling and writes raw data to disk first. That prevents memory thrash on the host and, just as importantly, keeps the consumer from slowing down the producer: if user-space code cannot keep up with the rate that eBPF-generated samples arrive, samples get dropped, not delayed by symbolization work.
None of this would be possible without frame pointers compiled into all of Meta’s user-space binaries. They provide a cheap and reliable way to walk the stack to collect the addresses needed for symbolization in the first place.

Visualizing Profiles
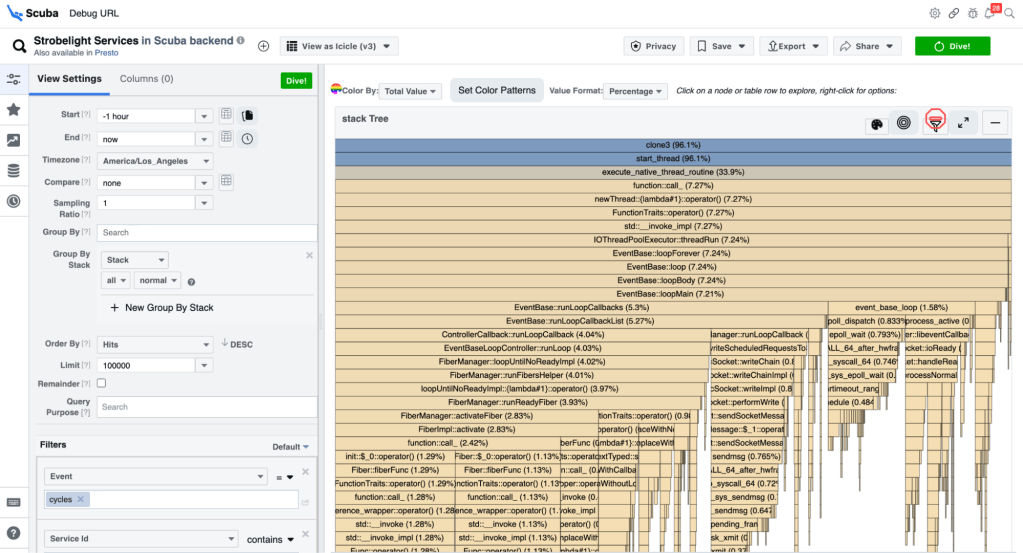
Strobelight’s primary output lands in Scuba, Meta’s query language, database, and UI combination. The Scuba interface offers a broad range of visualizations — flame graphs, pie charts, time series, distributions, and more — which lets users slice into the profiles quickly. An on-demand profile typically appears in the Scuba UI within seconds, ready to explore and share via link. Even dedicated tools like Perfetto support direct queries against the underlying data, since an interface full of dropdowns and buttons can never express every possible query a user might want to write.
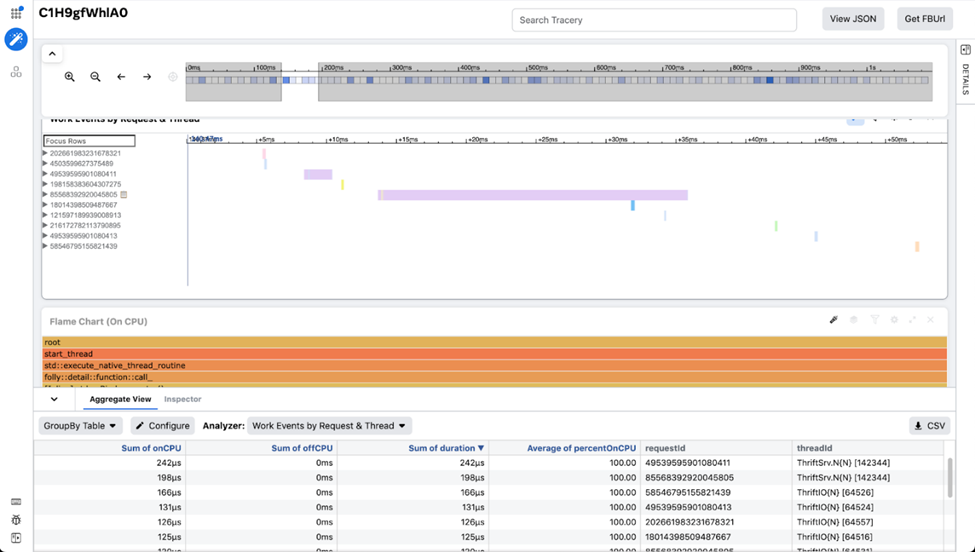
When engineers need to correlate multiple streams of profile data on a single timeline, Strobelight data can be viewed in Meta’s in-house trace visualization tool, Tracery. Engineers build custom visualizations and curated workspaces in Tracery, which lets them focus on the parts of the data that matter most. Tracery gains much of its zoom and filter responsiveness from a client-side columnar database implemented in JavaScript. Strobelight’s Crochet profiler is an example of what this visibility buys: it combines service request spans, CPU-cycle stacks, and off-CPU data to produce a detailed snapshot of a running service.
A One-Character Win
Across Meta, Strobelight has surfaced countless efficiency and latency gains — more requests served, dramatically fewer heap allocations, earlier detection of regressions in pre-production analysis. Yet the standout came to be known as “The Biggest Ampersand.”
While inspecting Strobelight data, a senior performance engineer found a way to catch a common C++ pitfall by filtering on a specific std::vector function call, identified by file and line number. The pattern revealed unintentionally costly array copies caused by the auto keyword. After tweaking a Scuba query, the engineer spotted one of those copied vectors in a hot call path in one of Meta’s largest ads services. An inspection of the source confirmed it: the copy was accidental, the kind of mistake any C++ developer has made.
The fix was a single character. Changing auto to auto& turned the expensive copy into a reference. After that one-character commit reached production, it yielded an estimated 15,000 servers in capacity savings each year.
An Open Road Ahead
Strobelight continues to evolve alongside Meta’s performance engineers, who work with the team to build analysis features aimed at identifying slowness and waste. The profilers and libraries are being prepared for open sourcing, which should make the tooling stronger and more widely useful. Most of the underlying technologies already are public or open source, and Meta encourages developers to use and contribute to them.



