
Speed by Design: Inside Shopify’s Storefront Renderer Optimizations
In an earlier post, we covered the rewrite of our storefront rendering engine and the transition to the new implementation. This follow-up digs into the technical decisions that made the new engine faster: how we query data, what we chose to omit from the stack, and the layered caching that keeps responses quick.
The new engine, a Ruby application backed by a sharded MySQL database and Redis, delivers a response in under ~45ms for 75% of storefront requests, under ~230ms for 90%, and under ~900ms for 99%. On average, storefront responses are nearly 5x faster than with the old implementation. Actual performance depends on the shop’s Liquid theme and the resources needed per request. The Shopify Theme Inspector Chrome extension is a useful tool for identifying bottlenecks in your own themes.
Three strategies stand out in the optimization work: batching database access, implementing a thin data layer, and building multiple tiers of caching.
Cutting Database Round Trips with Multi-Statements
Reducing network round trips to MySQL was a primary objective. The engine uses MySQL’s multi-statement feature to send multiple queries in a single request. This lets us load data from several tables at once — for a product page request, for instance, we fetch the product, variants, images, shop info, and theme data in a single round trip.
The approach is triggered early in the request lifecycle. Once the type of request is identified, one multi-statement query gathers the data needed for that specific page type.
The Case for a Custom Data Layer
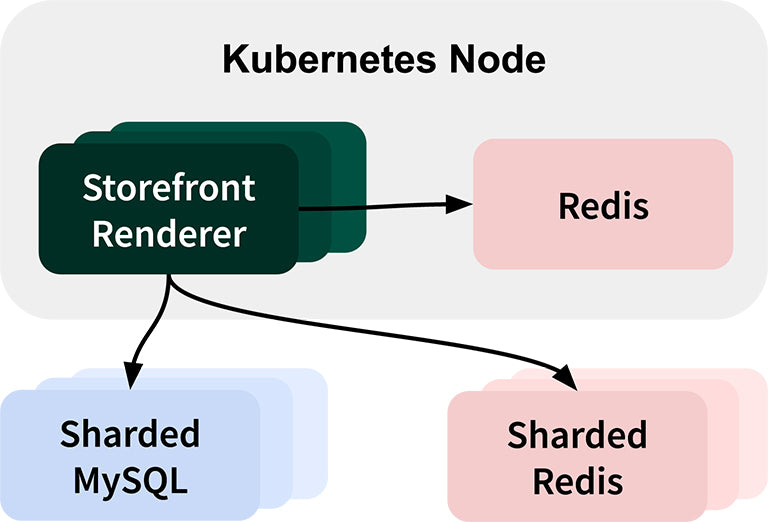
The engine uses handcrafted SQL rather than a full object-relational mapping (ORM) layer. This allows fine-tuned queries that select only necessary columns and leverage JOINs and sub-SELECTs where a typical ORM would struggle. The more significant win, though, is memory: a raw MySQL client has an extremely small footprint compared to an ORM’s overhead.
Without an ORM’s abstraction, data flow is simpler. Raw rows from MySQL become plain old Ruby objects that model the business domain. The risk of skipping an ORM is complexity leaking into application code; the team mitigates that with thin model abstractions that keep resources easy to interact with. This approach isn't common and can worry engineers concerned about schema migrations or compatibility, but when speed is paramount, the trade-off is accepted.
Learning What to Load, and When
An HTTP request for a storefront can require many resources from various data stores — even a simple product page may pull in other products, images, variants, and inventory data beyond what the initial multi-statement query fetched.
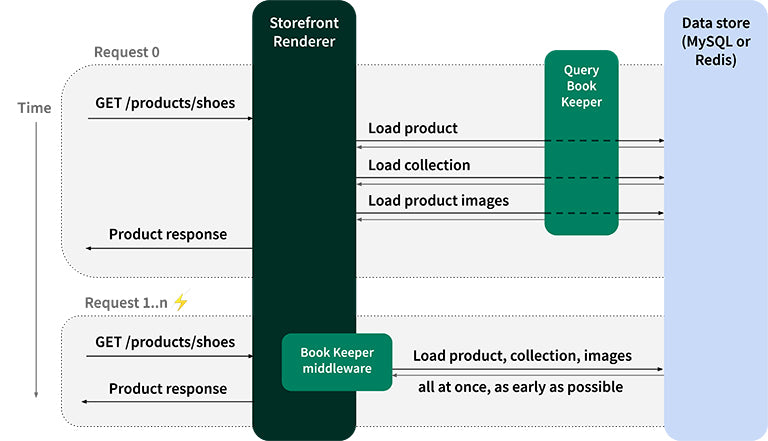
The first time a page is served, the engine tracks every query it performs for that page type and stores that list in a key-value store. When a request for the same page arrives later (identified by matching cache keys), the engine fetches that saved query list and executes all those queries upfront, confident they will be needed again. This is eager-loading driven by real usage patterns.
When a page changes, this mechanism can over-fetch or under-fetch — an expected outcome. The shape of the data stabilizes as more requests come in.
For less frequently accessed Liquid models, eager-loading would just add I/O wait time. Those resources are lazy-loaded by default, fetched only if a particular request actually needs them.
Layered Caches, Modeled Like a CPU
Before getting to the specifics: caching should not be the first tool you reach for. Build a fast solution without it first, then add caching to reduce load and accelerate common paths. Caching can hide subtle bugs.
In-Memory Cache

The first line of defense is an in-memory cache — effectively a global hash shared across requests within each web worker. Using an LRU eviction policy, this layer holds frequently accessed data and shines in high-throughput scenarios like flash sales.
Node-Local Shared Cache
Above the in-memory layer, the engine uses a node-local Redis store shared by all server workers on the same machine. Because this Redis sits on the same node as the rendering process, worker processes share cached data without any network overhead.
Full-Page Caching
When the engine finishes rendering a full storefront response — typically an HTML or JSON string — it stores the final output in the local Redis. Subsequent requests matching the same cache key get the saved response without regenerating it.
Query Result Caching
When all caches miss, the engine queries MySQL and transparently stores the results in Redis, keyed by the query and its parameters. As long as those keys don’t change, repeated queries hit Redis rather than the database.
The Liquid Object Memoizer
Custom Liquid themes frequently reference the same object in many places. A product page template may call {{ product.title }}, {{ product.description }}, and {{ product.featured_media }} across its markup. Without memoization, each reference would trigger a separate fetch.
The memoizer holds each resource in memory once it’s loaded, so any subsequent reference during the same request lifecycle uses that same instance. This is particularly valuable when different Liquid constructs converge on the same resource — think of a collection page that loops over {{ collection.products }} but also references one product via {{ all_products['cowboy-hat'] }}.
Across all Shopify storefronts, the memoizer prevents between 16 and 20 accesses to Redis or MySQL per request by serving from the in-memory cache instead; in extreme cases it prevents up to 4,000 data store calls on a single request.
Memory Allocations Matter
Garbage collection is expensive, so the team writes code that minimizes object churn — altering objects in place rather than generating new ones.
- Use
map!instead ofmapon lists to avoid creating a new Array. - Use string interpolation over concatenation to skip intermediate String objects.
The impact is tangible. Doubling the values of array = (1..1000).to_a with array.map { |i| i * 2 } allocates 8,040 bytes across one object. Doing the same with array.map! { |i| i * 2 } allocates zero objects and zero bytes.
One optimized loop may save only ~8 kilobytes, but at Shopify’s scale, every reduction in allocations means the garbage collector runs less often and for shorter durations. Tracing and profiling tools are used extensively to find the memory hotspots and make targeted fixes.
Regression-Proofing Performance With Memory Benchmarks
Optimization work doesn’t end when the code lands. To keep memory usage in check and prevent accidental regressions, the team built a test helper that benchmarks a method or block and reports the number of memory allocations and total allocated bytes it triggers. A typical usage looks like this:
The benchmark test above will pass when Product.find_by_handle('cowboy-hat') allocates between 48 and 52 objects, totaling between 5100 and 5200 bytes. The acceptable range exists because allocation counts aren’t fully deterministic across test runs; factors like test execution order and cached data can shift the final numbers.
These benchmarks serve as a guardrail during development. In practice, they have caught inefficient third-party gems that would have bloated memory usage, and they’ve made developers more conscious of allocation patterns when adding features.
Three Levers, One Goal
The optimization strategy centered on three complementary approaches:
- Batching: Grouping calls to external data stores reduces roundtrips and amortizes latency.
- Caching: Layered caches tailored to specific data access patterns minimize repeated work.
- Simplifying: Cutting down the amount of work per task — particularly memory allocations — makes each request cheaper to serve.
Applied together, these techniques produced substantial gains. The average response time with the new rendering engine is 5x faster than the previous implementation.
These are only a few of the tactics the Storefront Renderer team continues to apply. The team remains focused on finding new ways to reduce storefront rendering times.



