
A profiler that doesn't get in the way
Python's standard cProfile is a powerful tool, but its overhead makes it impractical for production use. Enabling it slows applications down so much that developers typically resort to profiling in staged environments or simulated workloads, which often don't reflect real traffic patterns. The result is that the code paths that actually matter in production can go unmeasured.
To address this gap, the engineering team at Dropbox built Plop — the Python Low Overhead Profiler — during a Hack Week. It's designed to run safely against live servers and is available on GitHub.
Sampling methodology
Rather than instrumenting every function call, Plop takes a sampling approach similar to Google's gperftools. A timer fires every 10 milliseconds, at which point the running program records its current stack trace. Aggregation happens after a collection window — typically 30 seconds — at which point the accumulated samples are saved for analysis.
Because sampling involves only a snapshot at discrete intervals, the overhead is dramatically lower than full instrumentation. In practice on Dropbox's servers, collection typically creates less than 2% CPU overhead, making it acceptable to run regularly in a live environment.
Reading the call graph
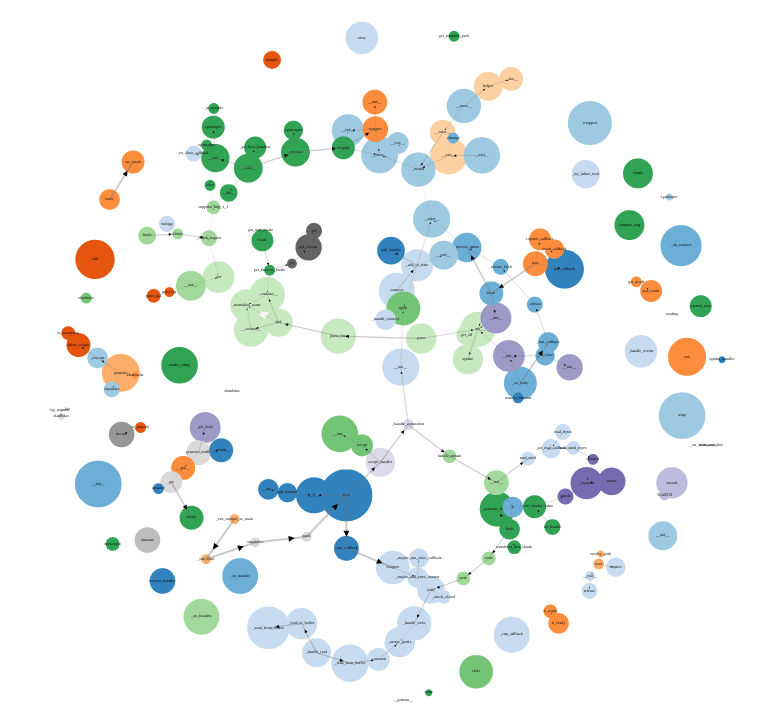
Plop includes a web-based viewer built with d3.js that renders the profile as an interactive call graph. In the visualization, each function is drawn as a bubble:
- Bubble size indicates the amount of time spent in that function.
- Line thickness reflects how frequently a call relationship appears across stack samples.
- Bubble color is tied to the file where the function is defined.
Utility functions that appear across many call paths are intentionally detached from the main graph. Connecting them to every caller would clutter the visualization, so they're shown as unconnected bubbles around the edges.
Real-world usage
Beyond the initial Hack Week prototype, Plop has been integrated into Dropbox's server deployment pipeline. Each time new code is pushed to the site, a script collects a profile of the new build. This routine collection has proven stable enough to run continuously, and it has already surfaced performance regressions that would otherwise have been difficult to catch before user impact.
The project remains a work in progress, particularly the viewer, but the profiling data itself is already useful for tracking performance changes across releases.



