
Hardware Foundations for Proxy Performance
Optimizing a proxy tier that serves tens of gigabits per second while managing tens of thousands of latency-sensitive transactions requires attention at every layer of the stack. The principles below, presented at NginxConf 2017, apply broadly to high-load servers, but should be evaluated individually — measure the effect of each change in your own environment before adopting it.
CPU Selection and Configuration
For asymmetric RSA/EC operations, choose processors with at least AVX2 support (check avx2 in /proc/cpuinfo), and ideally hardware capable of large integer arithmetic via the bmi and adx flags. For symmetric ciphers, AES-NI is essential for AES, while AVX512 accelerates ChaCha+Poly. Intel publishes performance comparisons across hardware generations with OpenSSL 1.0.2 that show the impact of these offloads.
Workload type should shape CPU topology decisions. Latency-sensitive tasks such as routing benefit from fewer NUMA nodes and disabled Hyper-Threading (HT). Throughput-heavy tasks prefer more cores and gain from HT — unless they are cache-bound — and are generally tolerant of NUMA. Intel systems should be at least Haswell/Broadwell, with Skylake preferred; AMD EPYC is a strong alternative.
Network Interface and Memory
The NIC should be at least 10G, ideally 25G. Pushing beyond that over TLS in a single server requires moving TLS framing into the kernel — as implemented on FreeBSD and proposed on Linux — rather than relying on userspace tuning alone. Favor NICs with open source drivers backed by active mailing lists, since driver-related debugging is inevitable at scale.
Memory follows a simple rule: latency-sensitive tasks need faster memory, throughput-sensitive tasks need more memory.
Storage Considerations
For heavy buffering or caching, flash-based storage is the right choice. Some deployments adopt specialized log-structured filesystems, but plain ext4 or xfs frequently performs just as well. Guard against flash wear by enabling TRIM and keeping firmware current.
Kernel and TCP/IP Tuning
Beyond hardware, the Linux kernel and its TCP/IP stack offer knobs applicable to any TCP-heavy server. The details of these optimizations — including specific sysctl settings and queue configurations — are covered in the companion sections on kernel-level tuning for web servers.
Note that this discussion is not a general Linux performance guide. While tools like bcc, eBPF, and perf appear throughout, they serve as means to measure the effects of the tunings described. For deeper profiling methodology, refer to Brendan Gregg's Linux performance resources. Similarly, this is not a TLS best-practices document, nor a browser-performance guide; both topics merit dedicated study.
Operating systems: Low level
Firmware and drivers
Keep firmware current — CPU microcode, motherboard, NICs, and SSDs — but avoid bleeding edge unless the latest release carries critical fixes. Staying one version behind is a reasonable default. Apply the same logic to drivers. Where possible, decouple driver updates from kernel upgrades (for example, with DKMS or pre-compiled drivers per kernel version) so a kernel update leaves one fewer variable when something misbehaves.
CPU configuration
On Ubuntu/Debian, the linux-tools package provides the utilities you need: cpupower, turbostat, and x86_energy_perf_policy. Check the governor and frequency with cpupower:
$ cpupower frequency-info
...
  driver: intel_pstate
  ...
  available cpufreq governors: performance powersave
  ...
  The governor "performance" may decide which speed to use
  ...
  boost state support:
    Supported: yes
    Active: yes
Verify that Turbo Boost is enabled and, on Intel hardware, that you are running with intel_pstate rather than acpi-cpufreq or pcc-cpufreq. If acpi-cpufreq is still in use on an older kernel, force the performance governor; with intel_pstate even powersave generally performs well, though it is worth confirming with your own load tests. For a ground-truth view of the processor, turbostat reads the MSRs directly for power, frequency, and idle-state information:
# turbostat --debug -P
... Avg_MHz Busy% ... CPU%c1 CPU%c3 CPU%c6 ... Pkg%pc2 Pkg%pc3 Pkg%pc6 ...
/proc/cpuinfo will not show the real frequency, so trust turbostat. If the CPU idles more than expected even under intel_pstate, switch the governor to performance and set x86_energy_perf_policy to performance. For very latency-critical workloads only, you can additionally use the /dev/cpu_dma_latency interface, or enable busy-polling for UDP traffic.
CPU affinity
Binding each worker to its own core — the worker_cpu_affinity directive in nginx, for example — eliminates CPU migrations, trims cache misses and page faults, and usually improves instructions per cycle. All of that is measurable with perf stat. The trade-off is that a bound process may wait longer for a free CPU, which you can observe with runqlat on a worker PID:
usecs               : count     distribution
    0 -> 1          : 819      |                                        |
    2 -> 3          : 58888    |******************************          |
    4 -> 7          : 77984    |****************************************|
    8 -> 15         : 10529    |*****                                   |
   16 -> 31         : 4853     |**                                      |
   ...
 4096 -> 8191       : 34       |                                        |
 8192 -> 16383      : 39       |                                        |
16384 -> 32767      : 17       |                                        |
Multi-millisecond tail latencies here mean contention with other processes on the box; in that case affinity will worsen latency, not improve it.
Memory and NUMA
Most mm/ tunables are workload-specific. Two general recommendations hold: set THP to madvise and enable it only where you have proven a benefit — otherwise the potential order-of-magnitude slowdown is not worth a possible 20% latency gain — and set vm.zone_reclaim_mode to 0 unless you deliberately confine yourself to one NUMA node.
NUMA exists because modern CPUs are really several dies sharing L3, memory controllers, and PCIe over a fast interconnect. The practical options are:
- Disable or ignore it, via BIOS or
numactl --interleave=all, for mediocre but predictable performance. - Deny it, with single-node servers.
- Embrace it, by optimizing memory and CPU placement from user space up through the kernel.
The third path is the interesting one. Inspect the topology first:
$ numactl --hardware
available: 4 nodes (0-3)
node 0 cpus: 0 1 2 3 16 17 18 19
node 0 size: 32149 MB
node 1 cpus: 4 5 6 7 20 21 22 23
node 1 size: 32213 MB
node 2 cpus: 8 9 10 11 24 25 26 27
node 2 size: 0 MB
node 3 cpus: 12 13 14 15 28 29 30 31
node 3 size: 0 MB
node distances:
node   0   1   2   3
  0:  10  16  16  16
  1:  16  10  16  16
  2:  16  16  10  16
  3:  16  16  16  10
Look at node count, per-node memory and CPU counts, and inter-node distances. A topology like the example — four nodes with some nodes lacking memory — is hard to partition cleanly, because treating each node as an independent server would mean discarding half the cores. Verify actual usage with numastat:
$ numastat -n -c
                  Node 0   Node 1 Node 2 Node 3    Total
                -------- -------- ------ ------ --------
Numa_Hit        26833500 11885723      0      0 38719223
Numa_Miss          18672  8561876      0      0  8580548
Numa_Foreign     8561876    18672      0      0  8580548
Interleave_Hit    392066   553771      0      0   945836
Local_Node       8222745 11507968      0      0 19730712
Other_Node      18629427  8939632      0      0 27569060
You can also request per-node usage in /proc/meminfo format:
$ numastat -m -c
                 Node 0 Node 1 Node 2 Node 3 Total
                 ------ ------ ------ ------ -----
MemTotal          32150  32214      0      0 64363
MemFree             462   5793      0      0  6255
MemUsed           31688  26421      0      0 58109
Active            16021   8588      0      0 24608
Inactive          13436  16121      0      0 29557
Active(anon)       1193    970      0      0  2163
Inactive(anon)      121    108      0      0   229
Active(file)      14828   7618      0      0 22446
Inactive(file)    13315  16013      0      0 29327
...
FilePages         28498  23957      0      0 52454
Mapped              131    130      0      0   261
AnonPages           962    757      0      0  1718
Shmem               355    323      0      0   678
KernelStack          10      5      0      0    16
Consider a cleaner topology:
$ numactl --hardware
available: 2 nodes (0-1)
node 0 cpus: 0 1 2 3 4 5 6 7 16 17 18 19 20 21 22 23
node 0 size: 46967 MB
node 1 cpus: 8 9 10 11 12 13 14 15 24 25 26 27 28 29 30 31
node 1 size: 48355 MB
With roughly symmetrical nodes, bind one application instance per node with numactl --cpunodebind=X --membind=X and expose each on its own port. That improves throughput by engaging both nodes and improves latency via memory locality. You can verify effectiveness through memory-operation latency, for example memmove measured with bcc’s funclatency, or through the memory and scheduler events in perf stat:
# perf stat -e sched:sched_stick_numa,sched:sched_move_numa,sched:sched_swap_numa,migrate:mm_migrate_pages,minor-faults -p PID
...
                 1      sched:sched_stick_numa
                 3      sched:sched_move_numa
                41      sched:sched_swap_numa
             5,239      migrate:mm_migrate_pages
            50,161      minor-faults
Network-heavy workloads add one more NUMA consideration: a NIC is a PCIe device bound to a particular node, so some CPUs will always have cheaper access to incoming traffic. We will return to NIC-to-CPU affinity below.
PCIe
Unless there is a hardware fault, deep PCIe debugging is rarely worth the effort. Set up alerts on link width, link speed, RxErr, and BadTLP for your devices, which you can query with lspci:
# lspci -s 0a:00.0 -vvv
...
LnkCap: Port #0, Speed 8GT/s, Width x8, ASPM L1, Exit Latency L0s <2us, L1 <16us
LnkSta: Speed 8GT/s, Width x8, TrErr- Train- SlotClk+ DLActive- BWMgmt- ABWMgmt-
...
Capabilities: [100 v2] Advanced Error Reporting
UESta:  DLP- SDES- TLP- FCP- CmpltTO- CmpltAbrt- ...
UEMsk:  DLP- SDES- TLP- FCP- CmpltTO- CmpltAbrt- ...
UESvrt: DLP+ SDES+ TLP- FCP+ CmpltTO- CmpltAbrt- ...
CESta:  RxErr- BadTLP- BadDLLP- Rollover- Timeout- NonFatalErr-
CEMsk:  RxErr- BadTLP- BadDLLP- Rollover- Timeout- NonFatalErr+
PCIe bandwidth only becomes a constraint when multiple fast peripherals — high-speed NICs plus NVMe storage, say — share a path. In that case you may need to physically spread devices across CPUs:
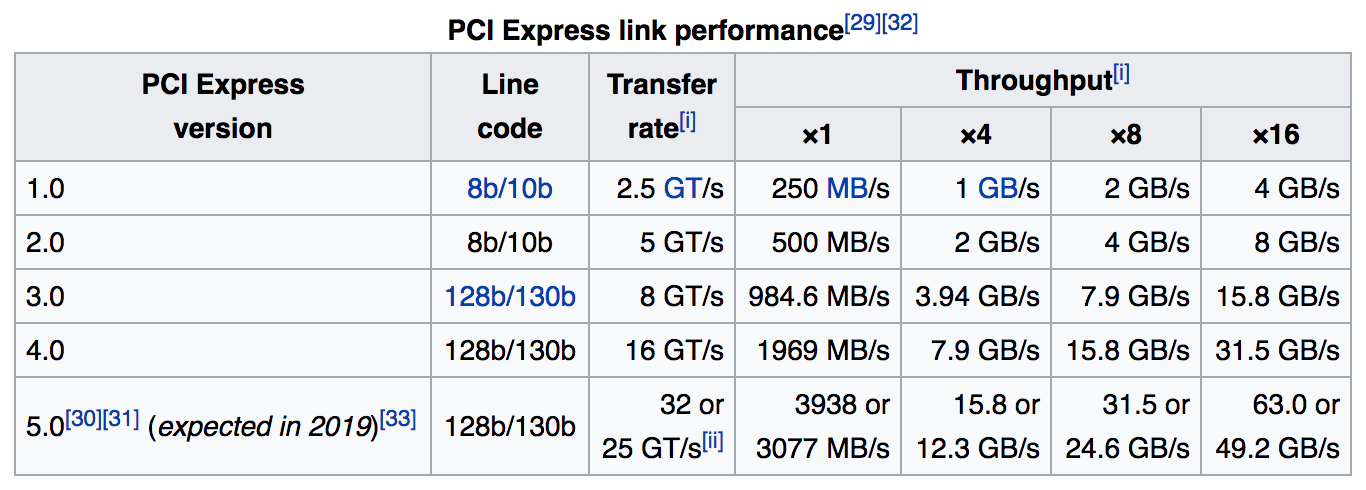
At very high speeds, watch for packet loss between card and OS; the Mellanox PCIe configuration notes cover this territory. If PCIe power management (ASPM) contributes to latency, disable it with pcie_aspm=off on the kernel command line.
NIC
Both Intel and Mellanox publish their own tuning guides, and it pays to read both regardless of your vendor. The Red Hat network performance tuning guide is another useful reference. When tuning, ethtool is the essential tool, and on a modern kernel you will want a matching modern userland — newer ethtool, iproute2, and iptables/nftables packages.
Get a first look at what the card is doing with ethtool -S:
$ ethtool -S eth0 | egrep 'miss|over|drop|lost|fifo'
     rx_dropped: 0
     tx_dropped: 0
     port.rx_dropped: 0
     port.tx_dropped_link_down: 0
     port.rx_oversize: 0
     port.arq_overflows: 0
Vendor documentation explains the detailed counters. On the kernel side, watch /proc/interrupts, /proc/softirqs, and /proc/net/softnet_stat, or use the hardirqs and softirqs bcc tools. The tuning goal is minimal CPU usage with zero packet loss.
Interrupt affinity
Start by spreading interrupts: across all NUMA nodes for maximum throughput, or confined to a single node for minimum latency. The single-node strategy may mean cutting queues in half with ethtool -L so they fit on one node. Vendors often ship scripts like Intel’s set_irq_affinity.
Ring buffers
NICs exchange data with the kernel through ring buffers, whose current and maximum sizes you see with ethtool -g:
$ ethtool -g eth0
Ring parameters for eth0:
Pre-set maximums:
RX:                4096
TX:                4096
Current hardware settings:
RX:                4096
TX:                4096
Raise the values inside their pre-set maximums with -G. Bigger rings absorb bursts and kernel hiccups, cutting drops from missed interrupts or full buffers, which matters especially when interrupt coalescing is on. Two caveats: on older kernels or drivers without BQL support, large TX rings can worsen bufferbloat, and larger buffers increase cache pressure. If you see cache-related issues, try smaller values.
Coalescing
Interrupt coalescing groups many events into one interrupt, trading latency for fewer interrupts. View the current settings with ethtool -c:
$ ethtool -c eth0
Coalesce parameters for eth0:
...
rx-usecs: 50
tx-usecs: 50
You can set static limits on interrupts per second or let hardware adapt dynamically to throughput. Coalescing adds latency and can introduce packet loss, which argues against it on latency-sensitive paths. Disabling it entirely, though, risks interrupt throttling and a performance ceiling.
Offloads
Modern NICs offload significant work to hardware or emulate it in the driver. List the options with ethtool -k:
$ ethtool -k eth0
Features for eth0:
...
tcp-segmentation-offload: on
generic-segmentation-offload: on
generic-receive-offload: on
large-receive-offload: off [fixed]
Fixed offloads are marked [fixed] in the output. A few rules of thumb: prefer GRO over LRO; treat TSO cautiously — it depends on driver and firmware quality; and avoid TSO/GSO entirely on old kernels, where it tends to inflate buffers.
Packet steering
Multi-core NICs split traffic into per-CPU virtual queues in hardware (RSS). When the OS balances packets across CPUs it is RPS, with XPS on the TX side; if the OS goes further and routes flows to the CPUs owning the relevant socket, that is RFS, and its hardware-assisted form is aRFS.
Production experience suggests:
- On modern 25G+ hardware, RSS across all cores is usually sufficient, since queues and the indirection table are large enough. Some older NICs only address the first 16 CPUs.
- RPS is worth trying when you have more CPUs than hardware queues and can trade latency for throughput, or when the NIC cannot RSS internal tunnels such as GRE or IP-in-IP.
- Avoid RPS on CPUs lacking x2APIC.
- Binding each CPU to its own TX queue through XPS is generally sound.
- RFS effectiveness depends heavily on the workload and on whether you apply CPU affinity.
Flow Director and ATR
Intel’s Flow Director defaults to Application Targeting Routing mode, which implements aRFS by sampling packets and steering flows toward the core handling them. The relevant counters appear in ethtool -S:
$ ethtool -S eth0 | egrep 'fdir'
port.fdir_flush_cnt: 0
...
Intel documents performance gains from Flow Director, but external work has found it can reorder up to 1% of packets, which is costly for TCP. Test it against your own workload and watch TCPOFOQueue while you do.
Network Stack Tuning: What Actually Matters
Most Linux networking advice floating around is cargo-cult configuration copied from kernel 2.6.18 era setups. Modern kernels have largely automated the tuning process, with most TCP/IP features enabled and well-configured by default. Before diving into any tuning, verify the impact of changes by monitoring TCP metrics from /proc/net/snmp and /proc/net/netstat, per-connection stats from ss -n --extended --info or getsockopt(TCP_INFO) calls within the web server, sampled traffic analysis via tcptrace, and real-user monitoring data.
The single most impactful "tuning" step remains upgrading the kernel. Beyond well-known improvements like initial window increases, newer kernels deliver TSO autosizing, FQ, pacing, TLP, and RACK. They also bring structural improvements: the routing cache has been removed, listen sockets can be lockless, and SO_REUSEPORT enables more efficient multi-process socket handling.
Fair Queueing, Pacing, and Buffer Limits
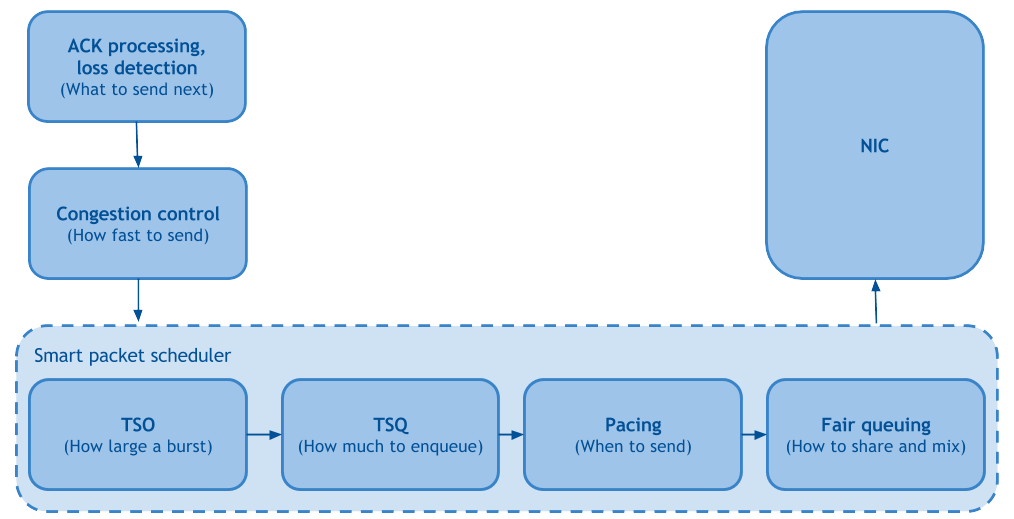
Fair Queueing (fq qdisc) improves fairness and reduces head-of-line blocking between TCP flows, lowering packet drop rates. Pacing then schedules packet transmission evenly over time based on the congestion control rate, further cutting loss and boosting throughput. Both can be used with CUBIC as well as BBR—reducing packet loss by 15-20% with loss-based congestion controls. Avoid these on kernels older than 3.19, however, since pacing pure ACKs in those versions cripples uploads and RPC performance.
TSO autosizing and TSQ handle a different buffering problem: limiting how much data the kernel queues inside the TCP stack. This reduces latency without sacrificing throughput, addressing a common source of bufferbloat at the socket level.
Modern Congestion Control
Recent congestion control algorithms—tcp_cdg, tcp_nv (Facebook), and tcp_bbr (Google)—all use delay increases rather than packet drops as primary congestion signals. BBR stands out for being well-documented and practical, building an explicit model of the network path from packet delivery rate and round-trip time observations, then running control loops to maximize utilization without inducing queueing delay.
Preliminary data from BBR experiments at CDN edge points show file download speed improves across all percentiles:
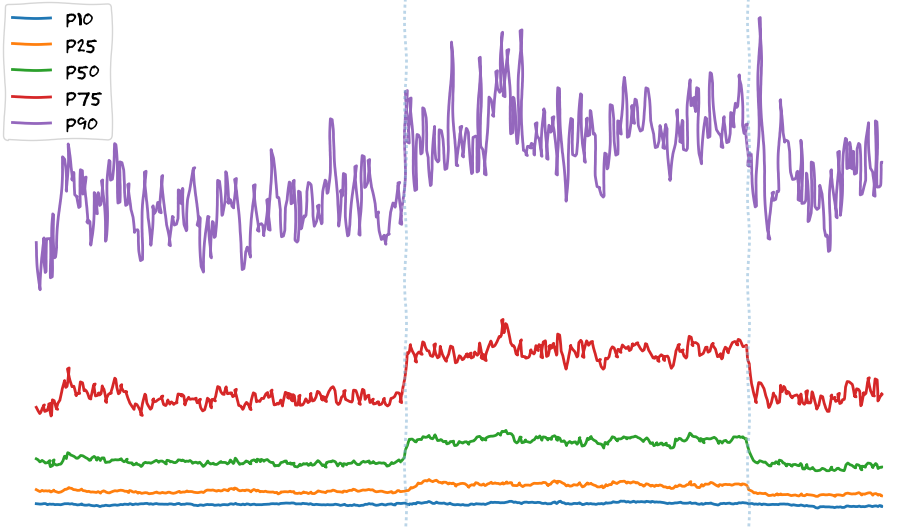
This uniform improvement is notable because backend optimizations typically only help users at the p90+ range—those with the fastest connections not already bandwidth-limited. Network-level changes like BBR or FQ reveal that most users are TCP-limited rather than bandwidth-limited.
Loss Detection and Userspace Considerations
Loss detection heuristics continue to evolve: TLP (Tail Loss Probe) and RACK (Recent ACK) are constantly being added to TCP stacks, while older mechanisms like FACK are retired. These ship enabled by default, so upgrading the kernel is sufficient—no additional configuration needed.
Userspace applications face head-of-line blocking risks in HTTP/2 scenarios because the socket API provides implicit buffering and no reordering once data is sent. The TCP_NOTSENT_LOWAT socket option and its corresponding net.ipv4.tcp_notsent_lowat sysctl address this by setting a threshold below which the socket considers itself writable—essentially making epoll report readiness early to enable prioritization. This solves HTTP/2 priority inversion but may affect throughput, so benchmarking is required per workload.
Sysctls: The Short List
Some sysctls deserve permanent avoidance. net.ipv4.tcp_tw_recycle=1 is broken for NAT users and, on recent kernels, broken for everyone—the kernel removed it entirely. Similarly, disabling net.ipv4.tcp_timestamps has non-obvious consequences: syncookies lose window scaling and SACK options, which hurts performance far more than the timestamp overhead saves.
For sysctls that do matter:
net.ipv4.tcp_slow_start_after_idle=0— the default "idle" period for resetting slow start is one RTO, which is too short.net.ipv4.tcp_mtu_probing=1— helps when ICMP blackholes interfere with path MTU discovery.net.ipv4.tcp_rmemandnet.ipv4.tcp_wmem— tune these to match the bandwidth-delay product, remembering that bigger buffers aren't always better.echo 2 > /sys/module/tcp_cubic/parameters/hystart_detect— when using fq with CUBIC, this avoids premature slow-start exit.
The curl author, Daniel Stenberg, maintains a draft RFC aggregating useful TCP tuning for HTTP workloads—a practical reference point for those looking to consolidate their configuration.
Application-Level Tuning: Tooling and Libraries
Profiling Tools and Compilers
Just as with the kernel, up-to-date userspace tools are essential for effective tuning. Start by packaging newer versions of perf, bcc, and related utilities.
With current tooling, you can profile on-CPU activity using perf top, generate on-CPU flamegraphs, and build ad hoc histograms with bcc’s funclatency. These are the primary observation methods for tuning the application layer.
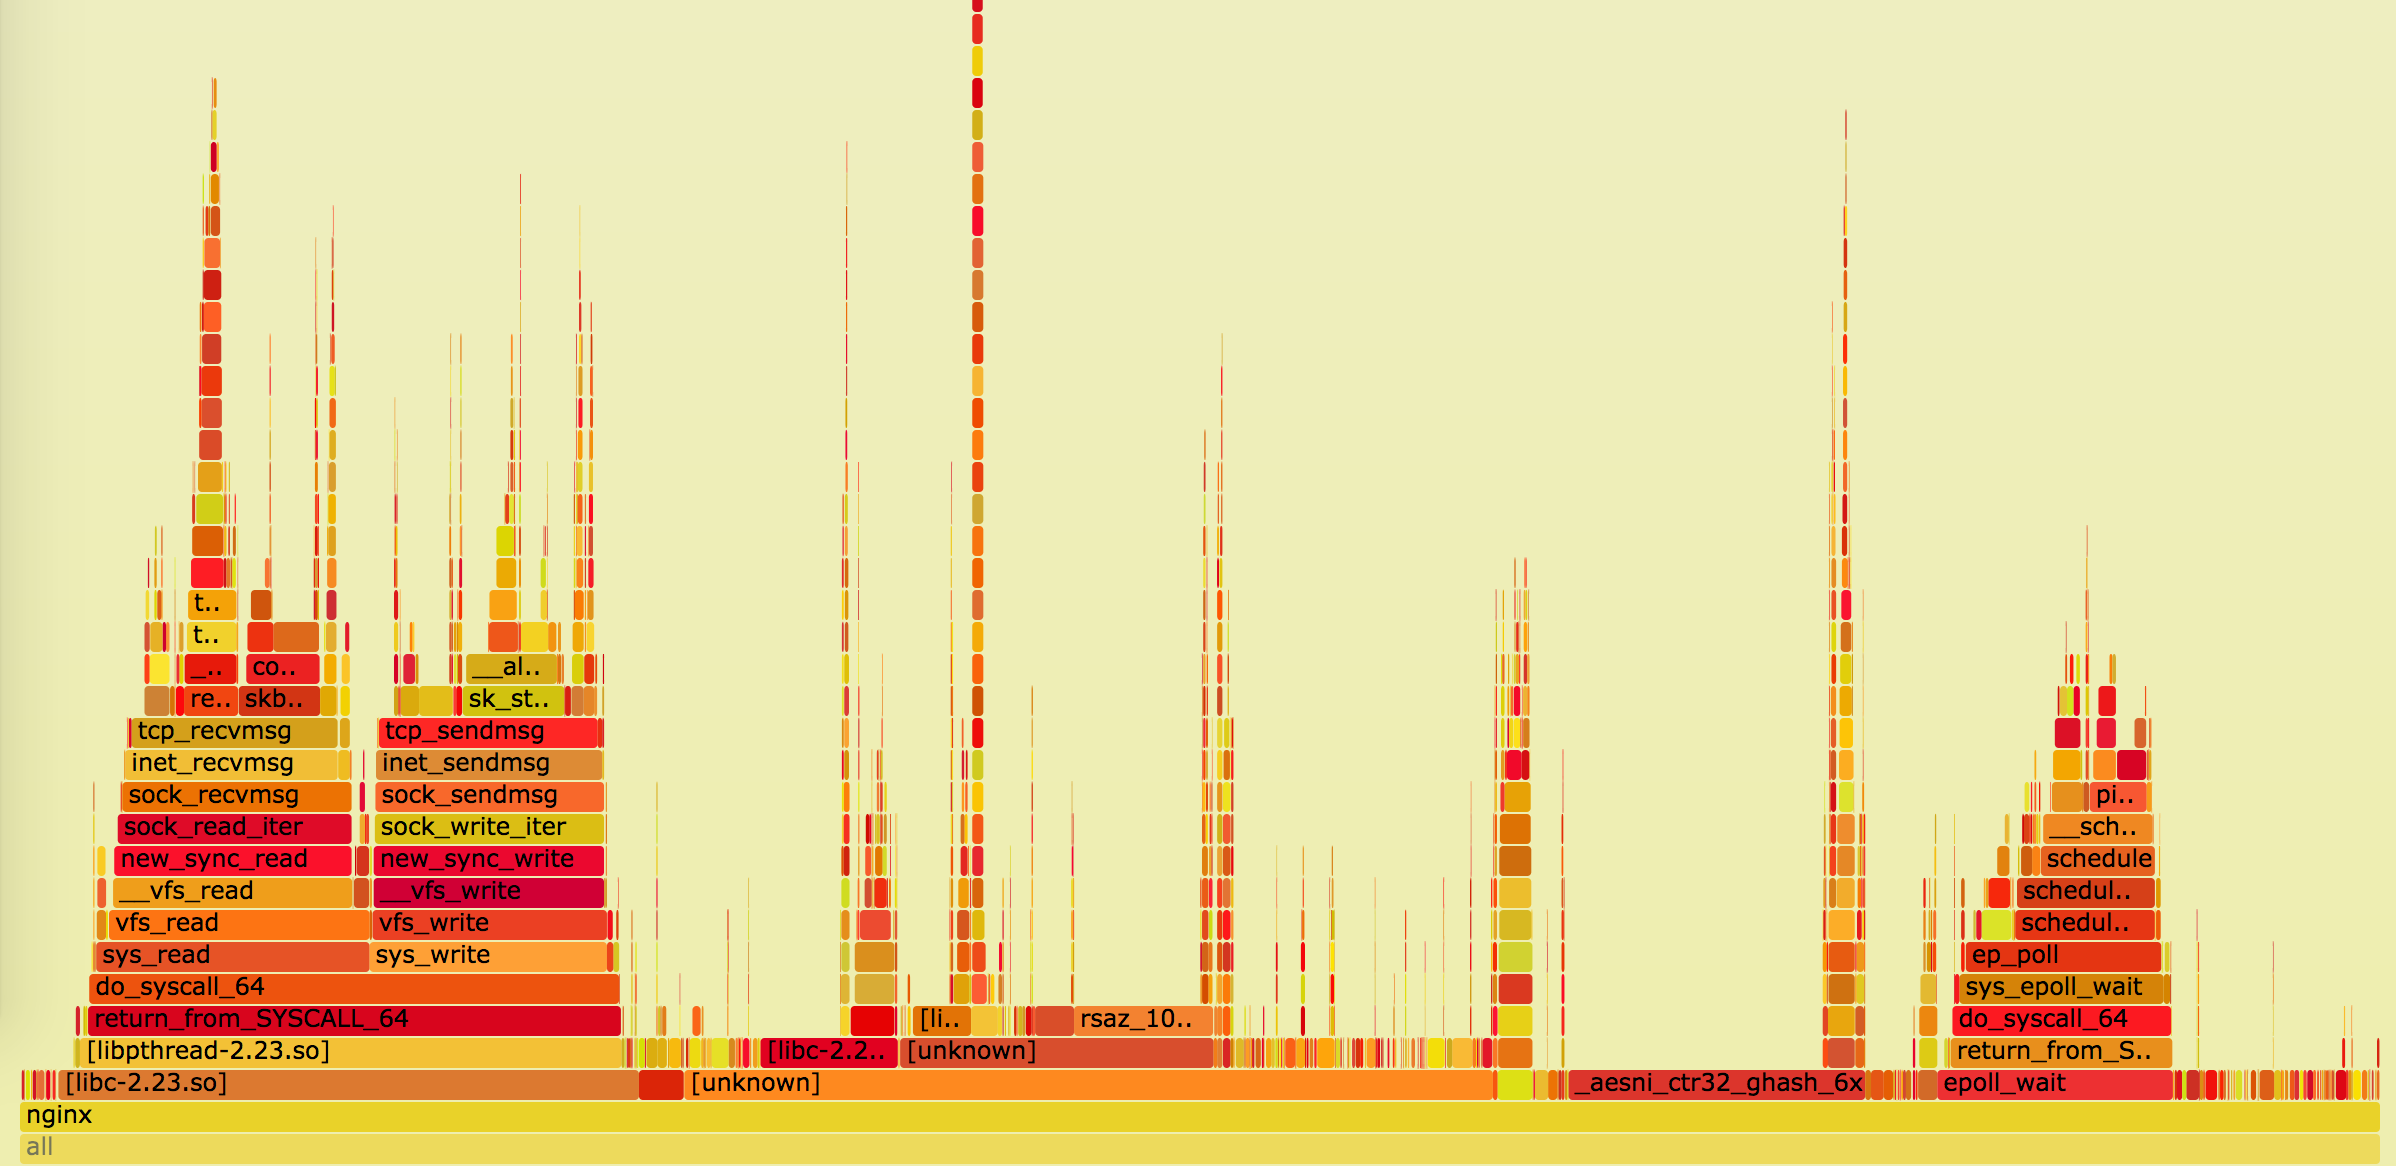
A modern compiler toolchain matters because many libraries used by web servers ship hardware-optimized assembly that only newer compilers can build correctly. Newer compilers also offer improved security features such as -fstack-protector-strong and SafeStack, which are important for edge services. They also enable running test harnesses against binaries instrumented with sanitizers like AddressSanitizer.
System Libraries and Compression
Upgrading system libraries like glibc is worthwhile to pick up recent optimizations in low-level functions from -lc, -lm, and -lrt. However, always test after upgrading, as occasional regressions do creep in.
If your web server handles compression, zlib functions may appear in perf top when traffic is heavy:
# perf top
...
   8.88%  nginx        [.] longest_match
   8.29%  nginx        [.] deflate_slow
   1.90%  nginx        [.] compress_block
Several projects offer optimized zlib forks that exploit newer instruction sets: Intel’s zlib, Cloudflare’s fork, and the standalone zlib-ng all provide better compression throughput.
Memory Allocators and Regular Expressions
CPU tuning has its limits—memory behavior also matters. If you rely heavily on Lua with FFI or third-party modules with their own memory management, fragmentation can inflate memory usage. Switching to jemalloc or tcmalloc helps for two reasons:
- It decouples the nginx binary from the system glibc, making it less vulnerable to glibc version upgrades and OS migrations.
- It provides better introspection, heap profiling, and allocator statistics.
Complex regular expressions in nginx configs or Lua code can leave pcre symbols visible in profiler output. Compiling PCRE with JIT and enabling it in nginx via pcre_jit on; addresses this. Verify the improvement with flame graphs or funclatency:
# funclatency /srv/nginx-bazel/sbin/nginx:ngx_http_regex_exec -u
...
     usecs               : count     distribution
         0 -> 1          : 1159     |**********                              |
         2 -> 3          : 4468     |****************************************|
         4 -> 7          : 622      |*****                                   |
         8 -> 15         : 610      |*****                                   |
        16 -> 31         : 209      |*                                       |
        32 -> 63         : 91       |                                        |
TLS: Choosing and Building a Library
For edge servers terminating TLS without a CDN in front, cryptographic performance is critical. The first decision is which TLS library to standardize on: OpenSSL, LibreSSL, or BoringSSL. Build configuration matters: OpenSSL applies built-time heuristics based on the build environment, whereas BoringSSL has deterministic builds but defaults to more conservative settings—disabling some optimizations by default. Modern CPUs with AES-NI, SSE, ADX, or AVX512 instructions are only fully leveraged if the library is built to use them. Use the library’s built-in benchmarks, such as bssl speed for BoringSSL, to evaluate performance.
Beyond library choice, cipher suite configuration dominates TLS performance. The fastest suites may compromise security, so use a trustworthy reference like the Mozilla SSL Configuration Generator when unsure.
Asymmetric Encryption
Edge services with many TLS handshakes consume significant CPU on asymmetric cryptography. ECDSA certificates are generally 10x faster than RSA and are smaller, which reduces handshake overhead under packet loss. ECDSA, however, depends on the quality of the system RNG; with OpenSSL, ensure sufficient entropy, though BoringSSL removes that concern.
Key size has a large impact: 4096-bit RSA certs degrade performance by roughly 10x compared to smaller keys:
$ bssl speed
Did 1517 RSA 2048 signing ... (1507.3 ops/sec)
Did 160 RSA 4096 signing ...  (153.4 ops/sec)
But smaller isn’t always better—using a non-standard p-224 curve for ECDSA performs about 60% worse than the common p-256:
$ bssl speed
Did 7056 ECDSA P-224 signing ...  (6831.1 ops/sec)
Did 17000 ECDSA P-256 signing ... (16885.3 ops/sec)
As a rule, the most widely used encryption parameters receive the most optimization effort. On a properly tuned OpenSSL-based system with RSA certs, perf top should show the AVX2 codepath (for Haswell-class CPUs without ADX):
  6.42%  nginx                [.] rsaz_1024_sqr_avx2
  1.61%  nginx                [.] rsaz_1024_mul_avx2
Newer hardware should show the generic Montgomery multiplication with ADX codepath:
  7.08%  nginx                [.] sqrx8x_internal
  2.30%  nginx                [.] mulx4x_internal
Symmetric Encryption
Bulk transfers—video, photos, files—push symmetric encryption symbols into profiler output. Ensure your CPU supports AES-NI and configure server-side preferences for AES-GCM ciphers. A well-tuned system shows the AES-NI codepath in perf top:
8.47% nginx [.] aesni_ctr32_ghash_6xClients, however, often lack hardware AES acceleration. For mobile traffic, ChaCha20-Poly1305 performs well on software-only CPUs and reduces time-to-last-byte for those users. BoringSSL includes ChaCha20-Poly1305 natively; for OpenSSL 1.0.2, Cloudflare’s patches add it. BoringSSL additionally supports “equal preference cipher groups,” letting clients choose based on their hardware. The following configuration, adapted from cloudflare/sslconfig, does exactly that:
ssl_ciphers '[ECDHE-ECDSA-AES128-GCM-SHA256|ECDHE-ECDSA-CHACHA20-POLY1305|ECDHE-RSA-AES128-GCM-SHA256|ECDHE-RSA-CHACHA20-POLY1305]:ECDHE+AES128:RSA+AES128:ECDHE+AES256:RSA+AES256:ECDHE+3DES:RSA+3DES';
ssl_prefer_server_ciphers on;
High-Level Application Tuning
For higher-level optimization work, real-user monitoring (RUM) data is essential. Browser-side Navigation Timing and Resource Timing APIs let you track time-to-first-byte (TTFB) and time-to-visible/interactive (TTV/TTI). Keeping this data queryable and graphable will speed up iteration considerably.
Compression
Compression in nginx starts with the mime.types file, which maps file extensions to response MIME types. From there, the gzip_types directive determines what actually gets compressed. If a full list is needed, mime-db can autogenerate mime.types, and entries with .compressible == true can be added to gzip_types.
Enabling gzip introduces two main trade-offs:
- Increased memory usage, addressable by limiting
gzip_buffers. - Increased TTFB due to output buffering. A gzip_no_buffer option exists to mitigate this.
gzip is not the only option. The third-party ngx_brotli module can deliver compression ratios up to 30% better than gzip.
Compression levels should be chosen by content type:
- Static assets can be pre-compressed at build time for maximum ratio, as covered in Dropbox's brotli static content post.
- Dynamic responses need a balance between compression time plus transfer time plus client decompression time. The absolute highest compression level can hurt TTFB and CPU utilization rather than help.
Proxy Buffering
Buffering knobs in the nginx proxy module are per-location and have a strong effect on latency. Inbound and outbound buffering are controlled independently by proxy_request_buffering and proxy_buffering. When enabled, memory consumption is capped by client_body_buffer_size (requests) and proxy_buffers (responses); beyond those limits data goes to disk. Setting proxy_max_temp_file_size to 0 disables response disk buffering.
Typical approaches:
- Buffer then forward. Requests reach the backend only once fully received; responses release a backend thread as soon as they're complete. This boosts throughput and shields backends from slow clients, but adds latency and memory/IO pressure (less of a concern on SSD).
- No buffering. For latency-sensitive or streaming routes, buffering is undesirable. The trade-off is that backends must then handle slow clients directly, including slow-POST and slow-read attacks.
- Application-controlled via the
X-Accel-Bufferingresponse header.
Whichever strategy is chosen, measure effects on both TTFB and time-to-last-byte (TTLB). Buffering also changes IO usage and backend utilization, so monitor those as well.
TLS Configuration
High-level TLS tuning can cut latency significantly. For details, the Optimizing for TLS section of High Performance Browser Networking and the Making HTTPS Fast(er) talk at nginx.conf 2014 are solid references. Security-sensitive changes should be checked against Mozilla's Server Side TLS Guide or an internal security team. Performance impact can be tested with WebPageTest, while Qualys SSL Server Test or Mozilla TLS Observatory cover security.
Session resumption. Caching handshake results saves one full RTT on repeat connections. There are two mechanisms:
- Session tickets (
ssl_session_tickets): the client stores encrypted session parameters, much like a cookie, so no server-side memory is consumed. But this requires infrastructure for generating, rotating and distributing ticket keys (not via source control or derived from predictable material like dates). PFS is then per-ticket-key rather than per-session, which widens the decryption blast radius if a key leaks. Encryption strength is capped by ticket key size. Older clients may not support tickets. - Server-side session cache (
ssl_session_cache): the client gets only a session ID. PFS is preserved and the attack surface is smaller. The cost is roughly 256 bytes per session server-side, so storage is limited per time window. Sessions are also hard to share across servers; this requires sticky load balancing or a distributed session store built on the lua module.
If using tickets, three keys are recommended: one current encryption key plus one previous and one next key for accepting in-flight sessions.
ssl_session_tickets on;
ssl_session_timeout 1h;
ssl_session_ticket_key /run/nginx-ephemeral/nginx_session_ticket_curr;
ssl_session_ticket_key /run/nginx-ephemeral/nginx_session_ticket_prev;
ssl_session_ticket_key /run/nginx-ephemeral/nginx_session_ticket_next;
OCSP stapling avoids three problems caused by letting the client fetch certificate-status: slower handshakes, a dependency on the certificate authority's availability, and privacy leakage via third-party OCSP lookups. Stapling can be done by periodically fetching a signed OCSP response from the CA and serving it with ssl_stapling_file:
ssl_stapling_file /var/cache/nginx/ocsp/www.der;Record sizes. A TLS record cannot be decrypted until fully received. Since nginx defaults to 16k records, which don't fit in a typical IW10 congestion window, an extra roundtrip can creep in before the record arrives. Use ssl_buffer_size to tune:
- Low latency favors a small size such as 4k. Going smaller costs CPU.
- High throughput favors leaving it at 16k.
Static tuning needs manual adjustment, and since ssl_buffer_size is set per config or server block, workloads mixing latency- and throughput-sensitive routes force a compromise. A Cloudflare patch adds dynamic record sizes, which auto-adapt but require some initial configuration effort.
TLS 1.3. Despite promising features, TLS 1.3 is probably not worth enabling for production unless a team can dedicate time to troubleshooting. The specification is still a draft, its 0-RTT handshake has security implications and application code must be ready for it, and some middleboxes still block unknown TLS versions.
Eventloop Stalls
nginx is fundamentally an eventloop: all requests share time in one process by switching rapidly between events, typically a few microseconds each. A single event that blocks on slow disk IO can stall the entire eventloop, pushing latency up sharply. Profiling showing excessive time in ngx_process_events_and_timers with a bimodal distribution is a strong signal of eventloop stalls.
# funclatency '/srv/nginx-bazel/sbin/nginx:ngx_process_events_and_timers' -m
     msecs               : count     distribution
         0 -> 1          : 3799     |****************************************|
         2 -> 3          : 0        |                                        |
         4 -> 7          : 0        |                                        |
         8 -> 15         : 0        |                                        |
        16 -> 31         : 409      |****                                    |
        32 -> 63         : 313      |***                                     |
        64 -> 127        : 128      |*                                       |
Threadpools and file IO. The primary stall source, especially on spinning disks, is IO. Use fileslower to measure impact:
# fileslower 10
Tracing sync read/writes slower than 10 ms
TIME(s)  COMM           TID    D BYTES   LAT(ms) FILENAME
2.642    nginx          69097  R 5242880   12.18 0002121812
4.760    nginx          69754  W 8192      42.08 0002121598
4.760    nginx          69435  W 2852      42.39 0002121845
4.760    nginx          69088  W 2852      41.83 0002121854
nginx's threadpool mechanism offloads IO, although native Unix AIO has enough quirks that threadpools are usually preferable. A basic configuration looks like:
aio threads;
aio_write on;
Complex setups can use a custom thread_pool per disk so a slow drive doesn't hurt other requests. Threadpools can cut the count of nginx processes stuck in D state dramatically, improving latency and throughput, but they will not remove every stall since not all IO operations are offloaded.
Log writes can also bog down a disk. If ext4slower shows access or error log references:
# ext4slower 10
TIME     COMM           PID    T BYTES   OFF_KB   LAT(ms) FILENAME
06:26:03 nginx          69094  W 163070  634126     18.78 access.log
06:26:08 nginx          69094  W 151     126029     37.35 error.log
06:26:13 nginx          69082  W 153168  638728    159.96 access.log
Mitigate by enabling buffer on the access_log directive to spool writes in memory, optionally adding gzip to compress before writing. Writing logs via syslog fully eliminates log-related disk stalls by keeping writes inside nginx's eventloop.
The open file cache addresses blocking open(2) calls on frequently accessed files. Measure the effect via ngx_open_cached_file:
# funclatency /srv/nginx-bazel/sbin/nginx:ngx_open_cached_file -u
     usecs               : count     distribution
         0 -> 1          : 10219    |****************************************|
         2 -> 3          : 21       |                                        |
         4 -> 7          : 3        |                                        |
         8 -> 15         : 1        |                                        |
If too many opens are happening or individual calls are slow, enabling cache is indicated:
open_file_cache max=10000;
open_file_cache_min_uses 2;
open_file_cache_errors on;
With open_file_cache on, check misses via opensnoop to decide on tuning the cache limits:
# opensnoop -n nginx
PID    COMM               FD ERR PATH
69435  nginx             311   0 /srv/site/assets/serviceworker.js
69086  nginx             158   0 /srv/site/error/404.html
...
Beyond One Box
Everything covered here is local to a single web server. Optimizations like these improve per-host scalability, and the latency and throughput orientation depends on the knobs chosen. But the larger share of the user-visible performance in a system like Dropbox's edge network comes from higher-level choices: traffic engineering around ingress/egress and smarter internal load balancing. These are open problems — the industry has only recently started seriously approaching them.



