
Why performance is a business conversation
Website user experience has a direct impact on business outcomes. Faster loading and more responsive sites tend to drive higher engagement and conversions. Core Web Vitals is an initiative that quantifies user experience so sites can identify where improvements are needed.
Most Core Web Vitals documentation targets developers with deep technical knowledge and full control over their codebase. But many websites are built by non-developers using site-builder platforms like WordPress, Shopify, or Wix, often without any dedicated web development team. Even when a development team exists, business decision makers heavily influence performance through choices about content, design, and advertising strategies that drive traffic. These decisions frequently have a significant performance impact.
This guide provides relevant information for site owners and builders to understand and improve user experience without deep web development expertise. Many performance issues do ultimately require technical fixes, and developer-focused guides cover those efforts. This is an introduction to Core Web Vitals for business decision makers, covering common non-development root causes of poor performance. Beyond these, engaging a web developer will likely be necessary for further progress.
Core Web Vitals basics
Core Web Vitals are three metrics designed to measure how fast a page feels to users. Each has a three-letter abbreviation:
- Largest Contentful Paint (LCP) measures loading performance: the time in seconds for the page's most prominent content to appear after loading starts.
- Cumulative Layout Shift (CLS) measures visual stability: how much content moves around while the page loads.
- Interaction to Next Paint (INP) measures how quickly the page responds to clicks, taps, and keyboard interactions.
Google provides recommended thresholds for each metric. Experiences below the lower threshold are good; experiences above the upper threshold are poor. Between these sits the needs improvement range. Lower numbers are always better.
How Core Web Vitals are measured
Core Web Vitals reflect the experiences of real users visiting your website, not what Google or googlebot thinks. Different users will see different results. Some are on faster devices and networks; others on slower ones. Some visit simpler, faster pages on your site; others visit more complex, slower ones. All these experiences are aggregated into an overall measure for your website.
Google makes data from opted-in Chrome users available in the Chrome User Experience Report (CrUX), which feeds into tools like PageSpeed Insights and Google Search Console. CrUX covers millions of popular websites, but not all sites are included. Other Real User Monitoring (RUM) tools can also collect these metrics for your site.
Finding your site's Core Web Vitals
Several Google and third-party tools display Core Web Vitals metrics. Two tools let you quickly view your site's performance. For a deeper workflow using Google tools, see the Core Web Vitals workflows with Google tools post. If your platform offers an integrated RUM solution, it can provide more detailed page-level information or let you segment users to identify issues.
PageSpeed Insights
For a quick view with no setup, use PageSpeed Insights (PSI). Enter a URL and click analyze. If your site is in CrUX, you'll see a "Discover what your real users are experiencing" section:
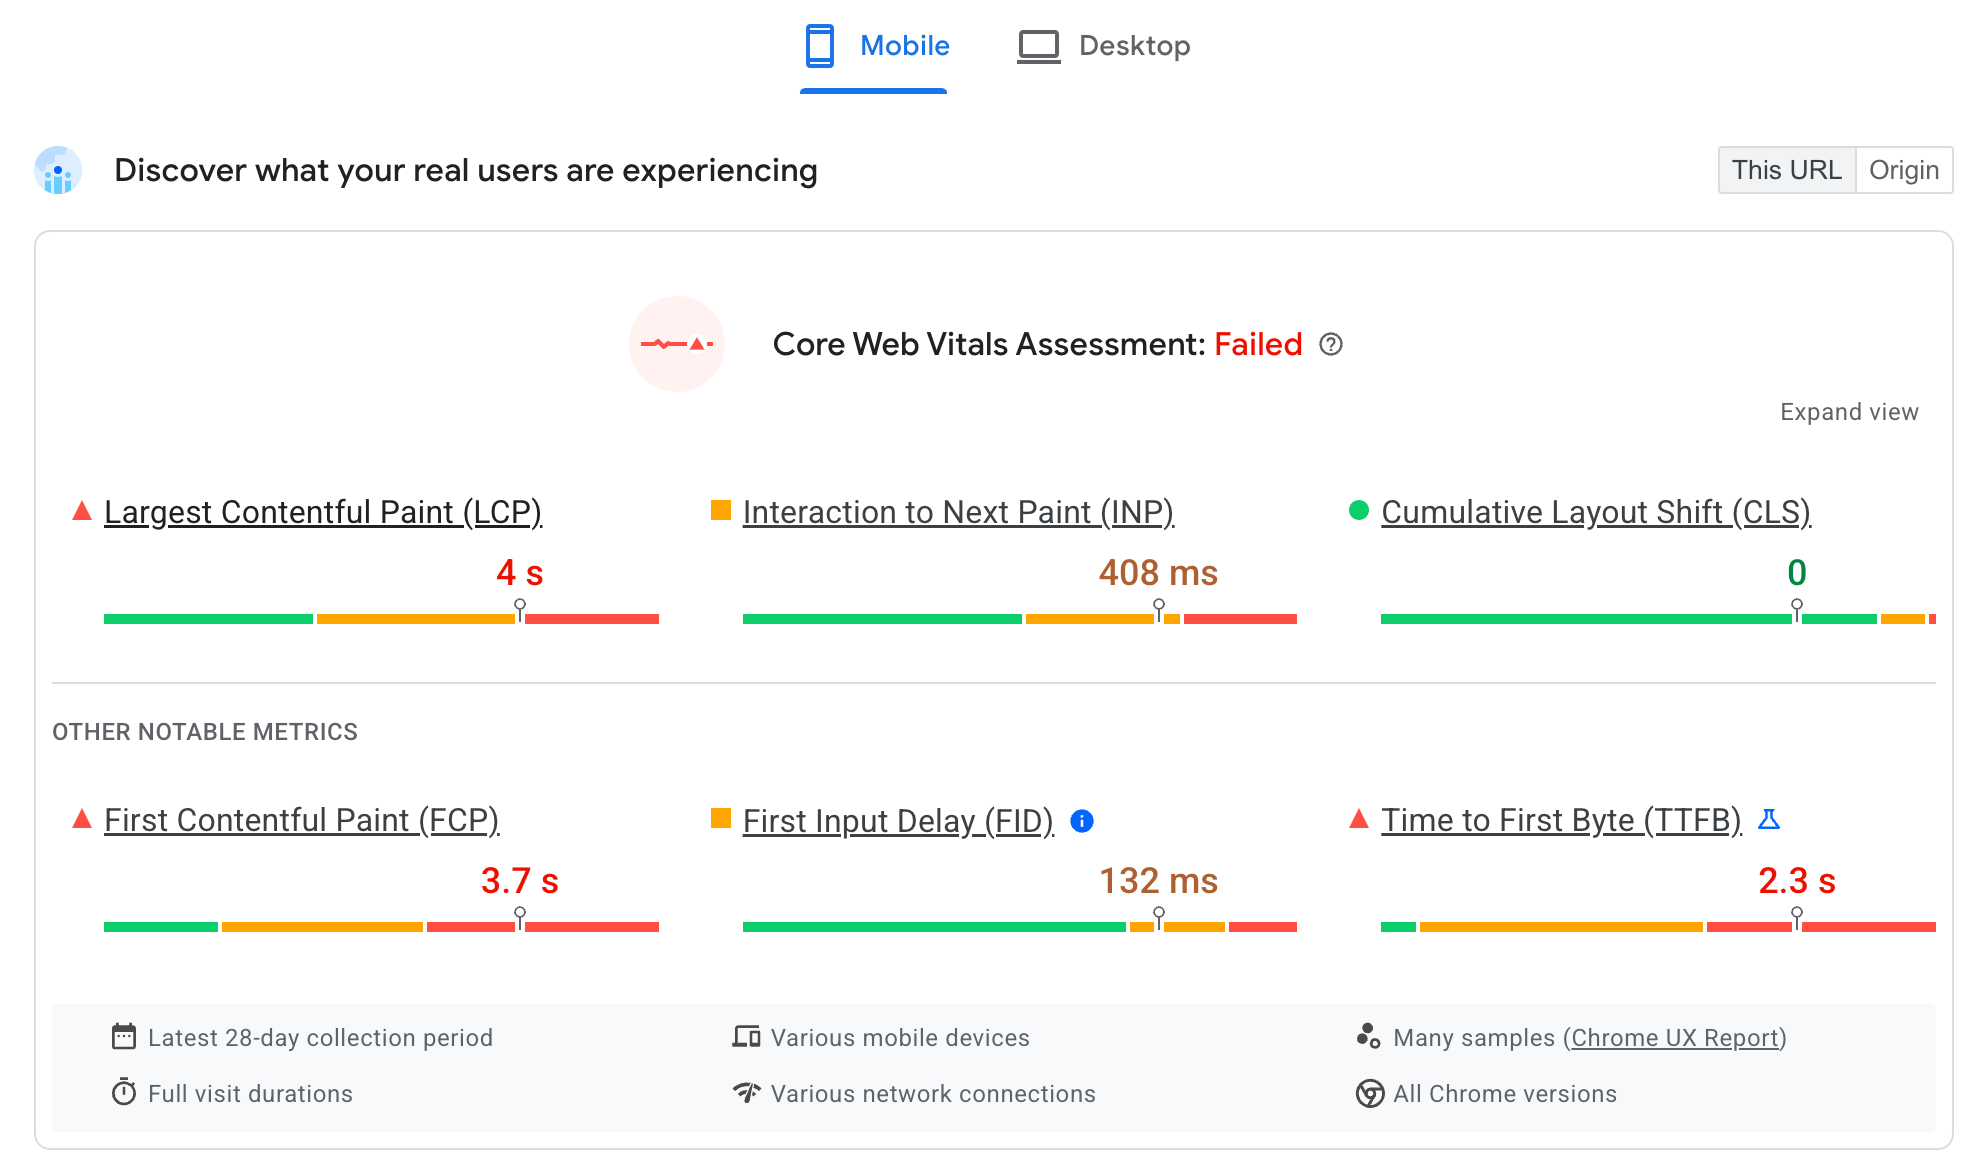
This shows how real Chrome users experienced your site over the last 28 days. The three Core Web Vitals appear at the top, with supporting metrics below. Only Core Web Vitals count toward the overall pass/fail assessment, but other metrics help troubleshoot issues. Toggle between Mobile and Desktop views, and switch between This URL and Origin data where both exist. These figures give a broad indicator of performance and which metrics need attention on which device types.
Google Search Console
Google Search Console (GSC) is for site owners and requires registration and ownership verification. Unlike PSI, GSC lists all pages Google Search knows about on your site and provides Core Web Vitals details for each:
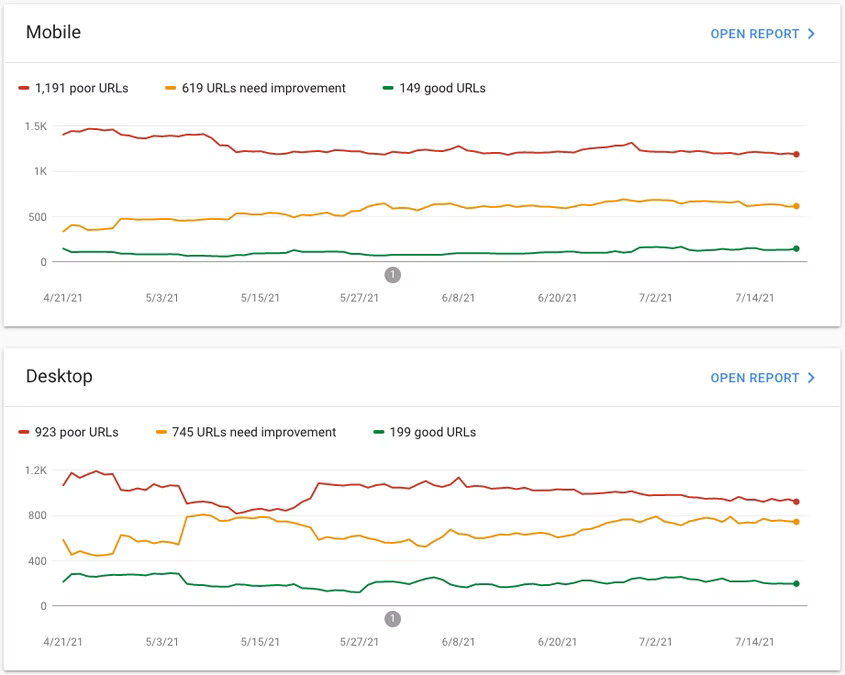
Pages are grouped into URL Groups, such as Product Detail Pages or Blog pages, so you can see if particular categories have Core Web Vitals issues. Since pages in a group are usually built on similar technologies or templates, there may be a common cause behind any issues.
Core Web Vitals issues that non-developers can fix
Many performance problems need developer interventions, but some of the most common Core Web Vitals issues stem from decisions that business stakeholders and site-builder users make. The following sections highlight those issues and actionable fixes that don't require coding expertise.
Largest Contentful Paint (LCP): speed to first paint
LCP tracks loading speed by timing how long it takes for the largest visible element—commonly a hero image or headline—to appear after a user clicks a link.
A good LCP is under 2.5 seconds. Anything above 4 seconds is classified as poor. Several non-technical factors can push LCP into that poor range.
Reduce delays before page load begins
Time to First Byte (TTFB) measures the delay before the first part of the page downloads. If PageSpeed Insights shows a red or amber TTFB, addressing it will directly improve LCP.
Know your audience's location. Geographic distance between users and your hosting server increases TTFB. A Content Delivery Network (CDN) caches copies of your site closer to users worldwide. Many hosting providers include CDNs or offer tiered plans with more CDN locations—global businesses should consider those higher tiers.
Reduce redirects in campaigns. URLs that chain redirects—for example, from example.com/blog to www.example.com/blog and then to https://www.example.com/blog—add latency before the page even starts loading. Use as few redirects as possible in marketing links.
Target ads correctly. Attracting traffic from users in regions you can't serve wastes ad spend and slows measured performance since those users are geographically distant from your servers.
Mind URL parameters. UTM parameters can make each URL appear unique to caching infrastructure, even when serving the same page. Work with your CDN or infrastructure teams to configure caching that ignores these parameters.
Optimize media assets
Media accounts for the LCP element on roughly 80% of web pages, and large downloads delay the rest of the page load. You can keep a rich visual experience without the performance penalty:
- Avoid carousels. Multiple images download concurrently if not implemented optimally, and carousels often provide a poor user experience anyway.
- Request web-optimized images. Design agencies often deliver print-quality files. Request optimized versions or use services like TinyJPG to strip unnecessary data before uploading. Even platforms that auto-optimize on upload benefit from smaller source files.
- Be conservative with video. Videos are the heaviest content type. Avoid placing them at the top of pages—reserve that area for lightweight content and let video appear further down.
Manage A/B testing carefully
Many A/B testing tools delay first paint until experiment changes are applied, which directly hurts LCP. Server-side testing avoids this delay. Regardless of the approach, follow these best practices:
- Load testing tools only on pages actively running tests.
- Limit tests to a subset of users.
- Run experiments for the minimum time needed to get conclusive results.
- Remove experiments once complete—this is the most important step.
Cumulative Layout Shift (CLS): visual stability
CLS measures how much page content shifts as it loads. Excessive shifting causes users to lose their place or click unintended elements. A score of 0.1 or less is good; 0.25 or higher is poor.
The score derives from a formula that accounts for how much content moves and the distance it travels.
Reserve space for lazy-loaded images
Templates often defer offscreen images until scrolling—a technique called lazy loading. Ensure your template reserves layout space for those images; otherwise, fast scrolling can trigger shifts before images finish loading.
Position ads carefully
Ads placed inline with content push text down as they load. Side placements reduce this risk. The options depend on your platform and templates.
Overlay banners instead of inserting them
Cookie notices and promotional banners added after page load at the top of the page will shift content. Overlaying them on top of existing content prevents layout movement.
Interaction to Next Paint (INP): responsiveness
INP gauges how quickly pages respond to clicks, taps, and keyboard input. A good threshold is 200 milliseconds; anything above 500 milliseconds is poor. INP reports the worst qualifying interaction across the page's lifetime.
Poor INP typically stems from pages doing too much work, delaying interaction handling. Several business-level decisions contribute to this.
Audit plugins and tags
Remove plugins and widgets no longer in use. Similarly, clean up old tag manager campaigns—expired tags still download and compile on every page, slowing responses even when they don't fire.
Limit heavy widgets to relevant pages
Expensive components like embedded maps or complex widgets degrade responsiveness everywhere they load. Load them only on pages where they serve a purpose, not sitewide.
Watch ad density on mobile
Ads are resource-intensive, and mobile devices have less processing power than desktops. The balance between monetization and performance matters—if users abandon pages due to sluggishness, extra ads can cost more revenue than they generate.
Control page size
Large pages take longer to process. A gallery listing 1,000 products will slow browser rendering. Paginate lengthy content to keep pages responsive.
Beyond self-serve fixes: getting expert help
The steps outlined earlier give business owners a solid starting point for improving site performance. However, you may need to dig deeper into your specific setup. In many cases, that means turning to experts who can analyze your site’s architecture and code in more detail.
Platform-specific guidance
Many content management systems and hosting platforms publish their own performance documentation. Since most major platforms are actively working on Core Web Vitals, their official guidance is often the most direct route to fixes. If you're on a hosted solution, the provider typically handles updates and you benefit automatically. For self-hosted setups—like a WordPress install on your own server—you'`ll need to apply updates yourself. Prioritize this maintenance or choose a service that handles it for you.
Lighthouse can also surface platform-specific advice through its Stack Pack functionality, which directs users of supported platforms to the most relevant recommendations.
Bringing in a web developer
A developer with web performance expertise can address issues that are out of reach for most business owners. Whether you have an existing development team, a contractor you've used before, or need to find someone new, it's worth engaging them when your own efforts fall short. The goal is to balance business priorities with technical constraints—developers should help you find the right trade-offs, not just apply fixes in isolation.
Keep in mind that performance work is rarely done after one round of fixes. Regular monitoring is essential to catch regressions after new features are added or site content changes.
Final considerations
Your website is often the first interaction a customer has with your business, and first impressions matter. The same applies to returning visitors—repeat customers deserve a frictionless experience just as much as new prospects. Core Web Vitals offer a standardized way to measure this experience, and users are quick to move on when a site feels slow or unresponsive.
That said, Core Web Vitals are only one lens through which to view your site’s health. Each business needs to weigh the investment in performance improvement against expected returns, and decide what level of optimization makes sense for its specific goals and resources.



