

Replication lag and where to observe it
Replication serves two purposes at once: scaling a database to ever larger workloads, and making the infrastructure redundant and resilient. Both come with a trade-off — the possibility of replication lag, which has to be watched. The central source of insight on the sending side is the pg_stat_replication system view, which holds the information needed to identify and diagnose replication problems.
That view describes WAL senders. Whenever two PostgreSQL servers talk to each other, the sending machine runs a WAL sender process and the receiving machine runs a WAL receiver. One WAL sender exists per destination, and pg_stat_replication reports on exactly those processes. On a primary it is populated as expected; under cascading replication it also returns rows when the server queried is a replica forwarding data to other replicas.
An example setup for these checks is a PostgreSQL 16 database server with a single replica.
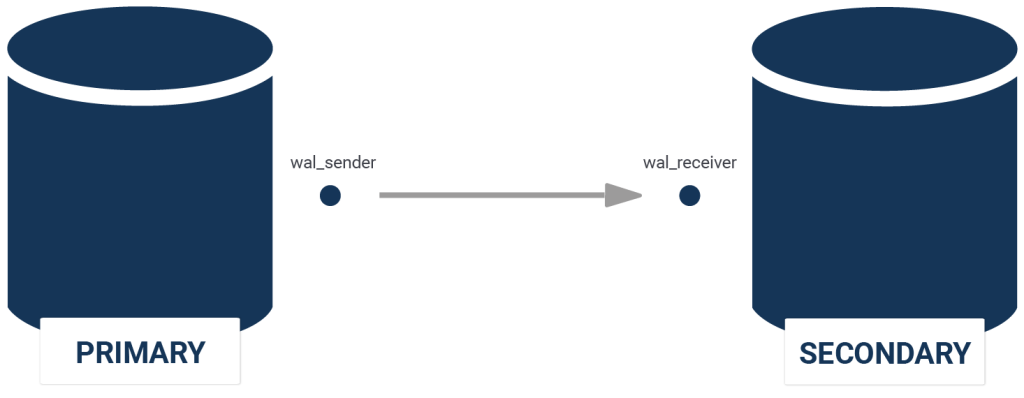
Here is what the view looks like:
|
1 2 3 4 5 6 7 8 9 10 11 12 13 14 15 16 17 18 19 20 21 22 23 24 |
postgres=# d pg_stat_replication View 'pg_catalog.pg_stat_replication' Column | Type | Collation | Nullable | Default ------------------+--------------------------+-----------+----------+--------- pid | integer | | | usesysid | oid | | | usename | name | | | application_name | text | | | client_addr | inet | | | client_hostname | text | | | client_port | integer | | | backend_start | timestamp with time zone | | | backend_xmin | xid | | | state | text | | | sent_lsn | pg_lsn | | | write_lsn | pg_lsn | | | flush_lsn | pg_lsn | | | replay_lsn | pg_lsn | | | write_lag | interval | | | flush_lag | interval | | | replay_lag | interval | | | sync_priority | integer | | | sync_state | text | | | reply_time | timestamp with time zone | | | |
Reading the state of each stream
In a cascading configuration, a server in the middle carries both a WAL receiver and one or more WAL senders.
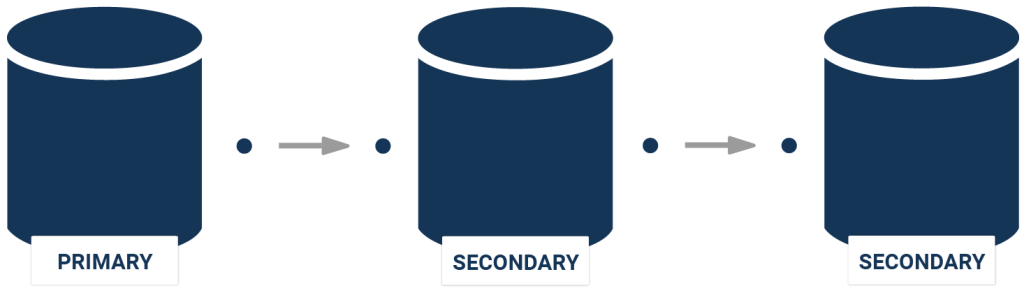
In this particular setup one server streams to a secondary on the same machine, and querying the view returns a single row:
|
1 2 3 4 5 6 7 8 9 10 11 12 13 14 15 16 17 18 19 20 21 22 23 24 |
postgres=# x Expanded display is on. postgres=# SELECT * FROM pg_stat_replication; -[ RECORD 1 ]----+------------------------------ pid | 48929 usesysid | 10 usename | hs application_name | walreceiver client_addr | ::1 client_hostname | client_port | 61445 backend_start | 2023-08-01 10:53:48.068431+02 backend_xmin | state | streaming sent_lsn | 0/303C750 write_lsn | 0/303C750 flush_lsn | 0/303C750 replay_lsn | 0/303C750 write_lag | flush_lag | replay_lag | sync_priority | 0 sync_state | async reply_time | 2023-08-01 10:55:00.783736+02 |
That single entry means there is one active stream. The important consequence is that inactive streams produce no row at all: if a stream is supposed to exist and there is no entry for it, streaming is not active. Verifying that the expected row exists is therefore the primary check.
The state of the stream matters just as much. A healthy stream can be identified as streaming; states such as catchup appear while the server is still syncing. The basic rule is to confirm that the right processes are correctly aimed at the right replication target.
- A missing row means a missing stream, not an idle one.
- A state other than
streamingwarrants a closer look.
The four *_lsn columns
After the existence and state of the streams, the deeper investigation concerns the *_lsn columns. Four of them describe the path data takes from one server to the next:
sent_lsnwrite_lsnflush_lsnreplay_lsn
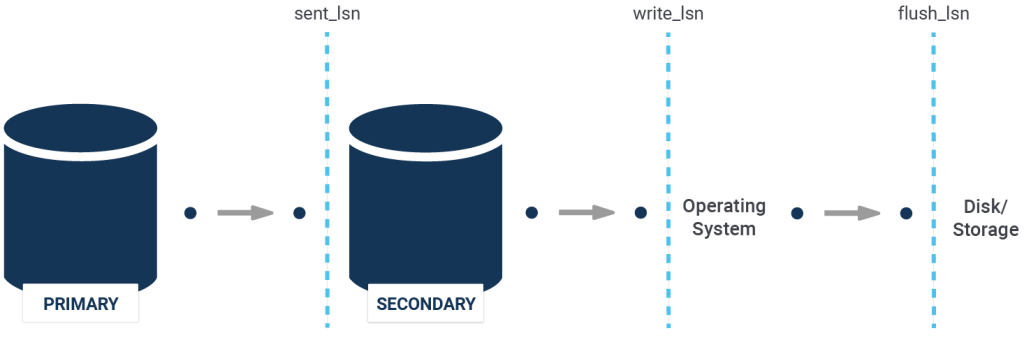
Data arrives at the second server through the WAL receiver; that position is sent_lsn, known as sent_location in older PostgreSQL versions.
Once received, the data is processed and handed to the operating system: PostgreSQL asks the kernel to write it. This does not prove the data reached the disk — it only means it was passed to the file system, which may cache it. write_lsn is the position in the transaction log stream that has made it that far.
flush_lsn is the next relevant value, and the distinction from write_lsn is that writing to a file is not the same as persisting it. write_lsn measures how much data has been sent to the kernel, while flush_lsn measures how much has actually been flushed, meaning the data will survive a power outage.
replay_lsn is the value that generates the most confusion. A transaction can already be on disk on the replica without being visible to end users, and this holds true even under synchronous replication — synchronous replication generally does not guarantee that data committed on the primary is visible on the replica. Replication conflicts explain how: the replica may write and flush a transaction yet not apply the change until the conflict is resolved. In short, replay_lsn reports how much data is already visible.
The receiver side and replication slots
The WAL receiver has its own view, pg_stat_wal_receiver, covering the receiving end of the connection. It is considerably harder to read, so pg_stat_replication remains the more convenient basis for monitoring.
|
1 2 3 4 5 6 7 8 9 10 11 12 13 14 15 16 17 18 19 |
postgres=# d pg_stat_wal_receiver View 'pg_catalog.pg_stat_wal_receiver' Column | Type | Collation | Nullable | Default -----------------------+--------------------------+-----------+----------+--------- pid | integer | | | status | text | | | receive_start_lsn | pg_lsn | | | receive_start_tli | integer | | | written_lsn | pg_lsn | | | flushed_lsn | pg_lsn | | | received_tli | integer | | | last_msg_send_time | timestamp with time zone | | | last_msg_receipt_time | timestamp with time zone | | | latest_end_lsn | pg_lsn | | | latest_end_time | timestamp with time zone | | | slot_name | text | | | sender_host | text | | | sender_port | integer | | | conninfo | text | | | |
Replication slots are a separate concern with their own failure mode. A slot keeps WAL from being removed while a replica is behind it; without a slot, the primary recycles WAL as soon as it no longer needs it itself. The check is to look for stale slots that are pending and no longer needed, and to drop them.
The view for that inspection:
|
1 2 3 4 5 6 7 8 9 10 11 12 13 14 15 16 17 18 19 20 |
postgres=# d pg_replication_slots View 'pg_catalog.pg_replication_slots' Column | Type | Collation | Nullable | Default ---------------------+---------+-----------+----------+--------- slot_name | name | | | plugin | name | | | slot_type | text | | | datoid | oid | | | database | name | | | temporary | boolean | | | active | boolean | | | active_pid | integer | | | xmin | xid | | | catalog_xmin | xid | | | restart_lsn | pg_lsn | | | confirmed_flush_lsn | pg_lsn | | | wal_status | text | | | safe_wal_size | bigint | | | two_phase | boolean | | | conflicting | boolean | | | |



