

Why Git performance telemetry matters
When Microsoft migrated the Windows and Office codebases to Git in 2017, the repositories contained 3.5M files and full clones exceeded 300GB. Working in such gigantic repositories was painful, and improving Git’s performance at that scale required hard data. That’s why the Trace2 feature was added to core Git in 2019—to let anyone collect detailed performance data from real Git commands.
Enterprises today are building ever-larger monorepos, and users expect Git to stay interactive and responsive regardless of repository size. But profiling Git on test data or simulated loads isn’t enough. Meaningful results only come from observing Git on real monorepos under daily use, and making sense of that data requires proper visualization tools. Trace2 writes extremely detailed performance data, but it’s not easy to consume on its own.
Introducing trace2receiver
The emerging standard for analyzing software performance at scale is OpenTelemetry. The centerpiece of OpenTelemetry is a collector service daemon that you customize with receiver, pipeline, and exporter components. The collector can listen for telemetry from different sources, normalize or filter it, and forward it to various data sinks for analysis.
To bring Trace2 data into the OpenTelemetry ecosystem, we created trace2receiver, an open source receiver component for custom collectors. Point the receiver at Trace2 data from Git commands, and it translates the event stream into OTLP—a common OpenTelemetry format—and relays it to a local or cloud-based visualization tool.
For a very quick start, a sample collector that uses the trace2receiver component is also available, with ready-to-go configuration and platform installers. Just plug in your preferred data sink or cloud provider, build it, run an installer, and start collecting data.
Two ways to study Git with OpenTelemetry
Once the telemetry pipeline is running, there are two complementary ways to look at Git performance. The first is distributed tracing: following an individual command from start to finish to see where time is spent, including across the nested series of helper commands that Git often spawns (such as git push, which can trigger six or seven subcommands). The second is aggregating data over time and across users and machines to compute summary metrics like average command times, giving a high-level view of performance and where improvements are needed.
Tracing a git fetch
The trace2receiver maps the Trace2 event stream into OpenTelemetry spans with proper parent-child relationships, then forwards them to a visualization backend. The example below shows a git fetch command on the torvalds/linux.git repository, displayed in SigNoz. The same custom collector also sent data to Application Insights, made simple by OpenTelemetry’s open standards.
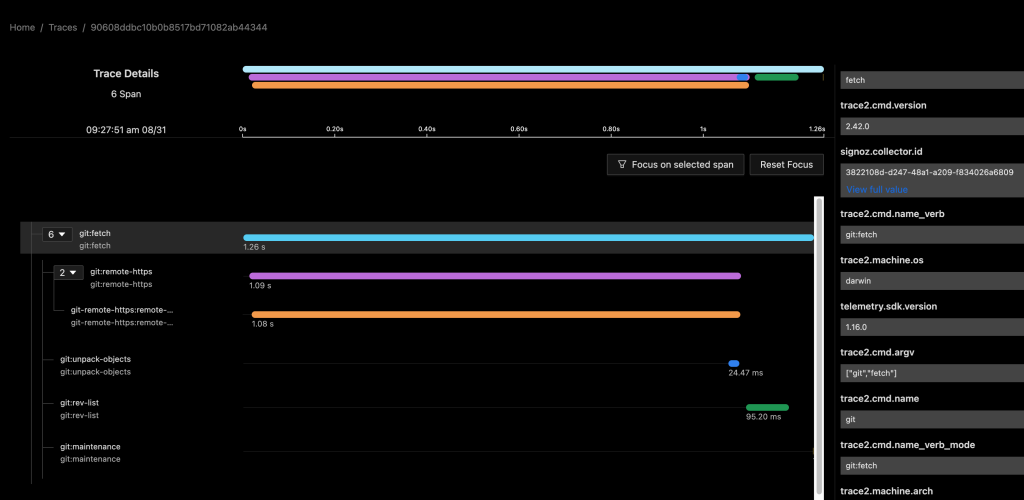
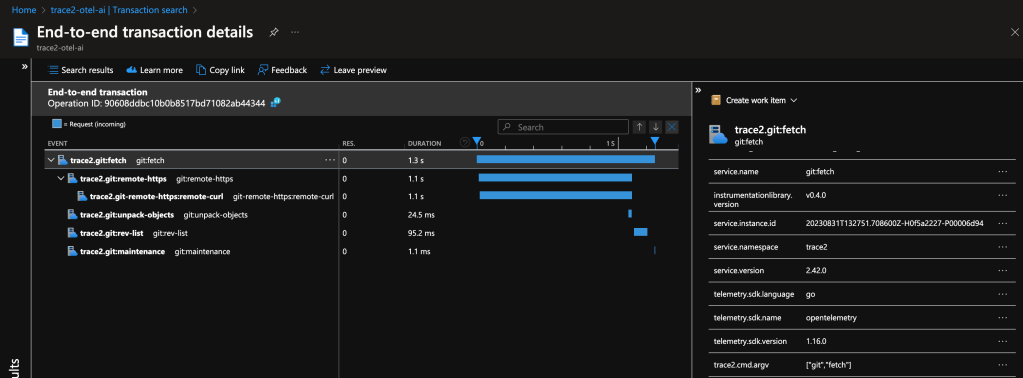
The distributed trace shows the duration of the top-level command and each helper command. In this case, most of the time was spent waiting on git-remote-https to receive new objects. It also shows that git maintenance runs quickly, indicating a well-structured repository. A Git expert could further infer that the received packfile was small, since Git unpacked it and wrote loose objects rather than writing and indexing a new packfile. Even without domain expertise on your team, collected data like this can help support engineers or outside Git experts interpret an environment.
In this example, the collector reported summary-level telemetry (dl:summary), showing only elapsed process times. Crank up the detail level for deeper insight.
Comparing FSMonitor and Untracked Cache with git status
The next examples show git status at verbose detail (dl:verbose), which adds region-level spans. The git:status span shows total command time, while region(...) spans break down the major computation phases.
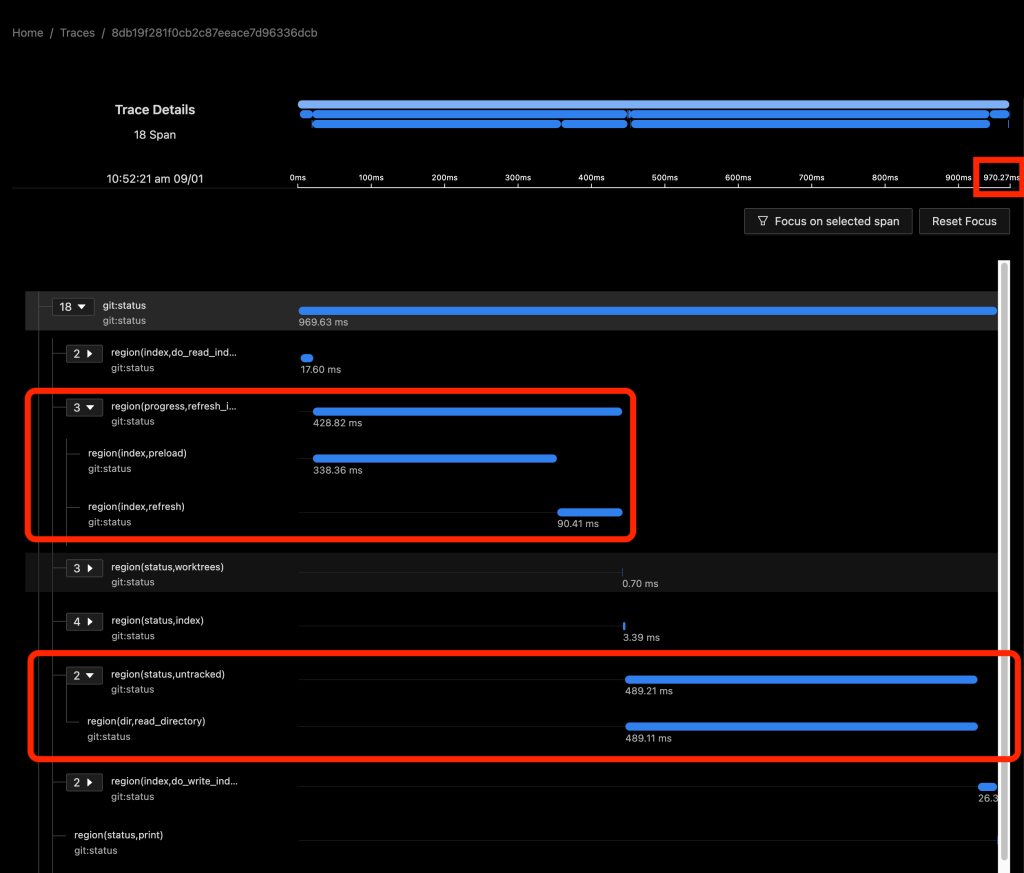
With FSMonitor and Untracked Cache turned off, the total command time in this repository was 970 ms. Roughly half—429 ms—went to region(progress,refresh_index), scanning the worktree for recently modified files. The other 489 ms went to region(status,untracked), where Git scans for untracked files. On large repositories, these scans are very expensive.
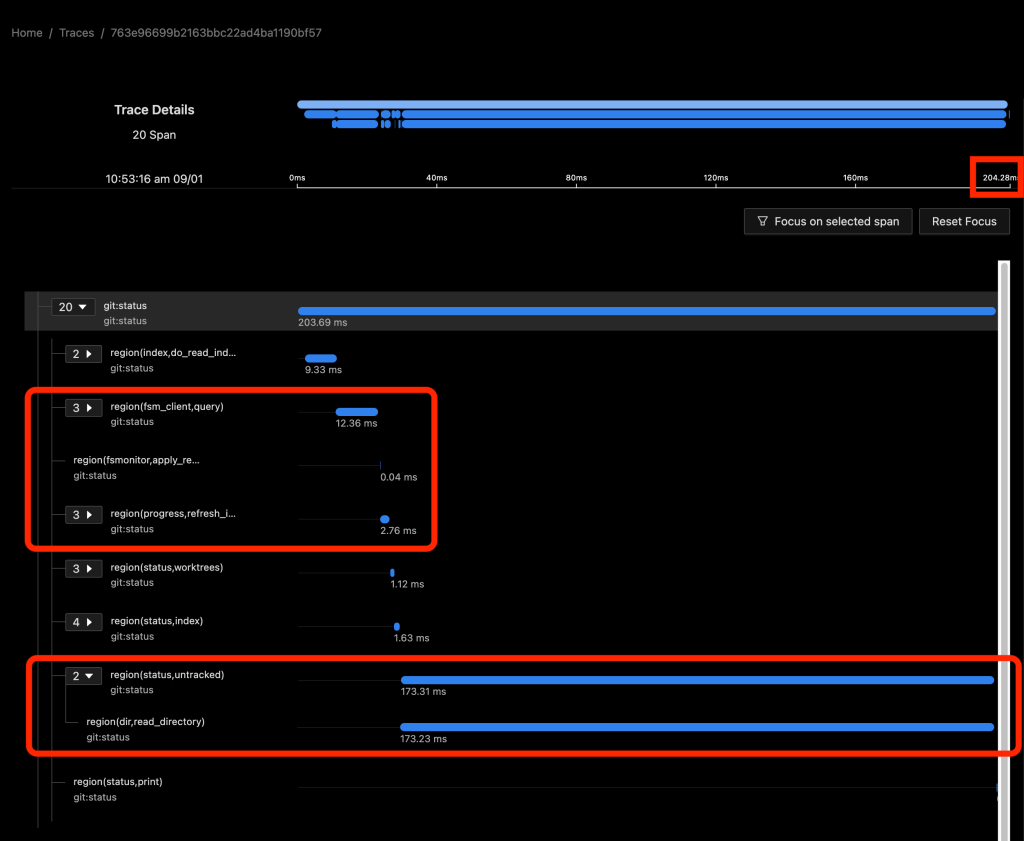
With FSMonitor enabled, total time dropped to 204 ms. Git no longer needs to scan the disk for modified files; it simply asks the FSMonitor daemon. A new region(fsm_client,query) appears, along with region(fsmonitor,apply_results) where Git updates its in-memory state. The time in region(progress,refresh_index) fell from 429 ms to 15 ms, and region(status,untracked) dropped from 489 ms to 173 ms—still costly, but far better.

With both FSMonitor and Untracked Cache enabled, total time was just 40 ms. The untracked scan dropped to 12 ms. For a frequently run command like git status, this is a massive cumulative savings on large repositories.
For a deeper explanation of these major regions and how FSMonitor and the Untracked Cache work, see the earlier FSMonitor article.
Making sense of aggregated telemetry
Individual command traces are useful, but the real value of telemetry comes from aggregation. By collecting data across many users, machines, operating systems, and repositories, we can answer questions like: which commands are used most frequently, where performance is trending, and whether a slow command is a one-off fluke or a systemic issue. That analysis can guide where to invest engineering effort — whether it's worth optimizing a command used once a year versus shaving milliseconds off one used millions of times daily.
Slowness is subjective, so we need measurable data to compare what users experience against their peers' experiences. With enough context, we can determine whether a delay was caused by a network problem, a fetch from a distant data center, or is simply expected on a particular class of hardware. Aggregating data over time gives us the confidence to make those distinctions.
Reading the raw records
When telemetry arrives at a data sink, the schema varies by backend. In our setup, the custom collector sends data to both Azure and SigNoz, but the underlying concepts translate across sinks. Looking at the Azure Application Insights database via Azure Data Explorer, we can inspect the stored records.
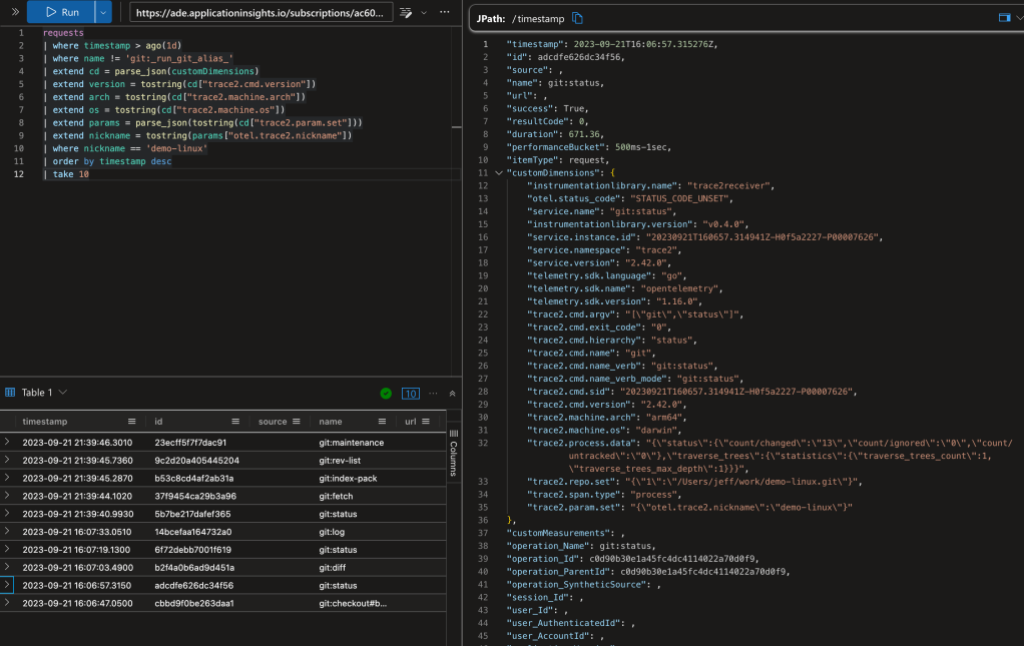
The query above shows the 10 most recent commands on a repository nicknamed "demo-linux." The expanded record displays a git status command that took 671 ms. In the top-level fields, the normalized command name is git:status and the duration is in milliseconds. The customDimensions fields hold additional context: the original command line, the machine architecture (arm64) and operating system (macOS), the Git version (2.42.0), and the number of changed files found (13).
Some OpenTelemetry data is mapped to top-level AppIns fields, while the rest lives in the customDimensions JSON object. Different record types may also land in separate database tables depending on the sink. The exact layout depends on your storage, but the query techniques are generalizable.
Querying frequency and latency
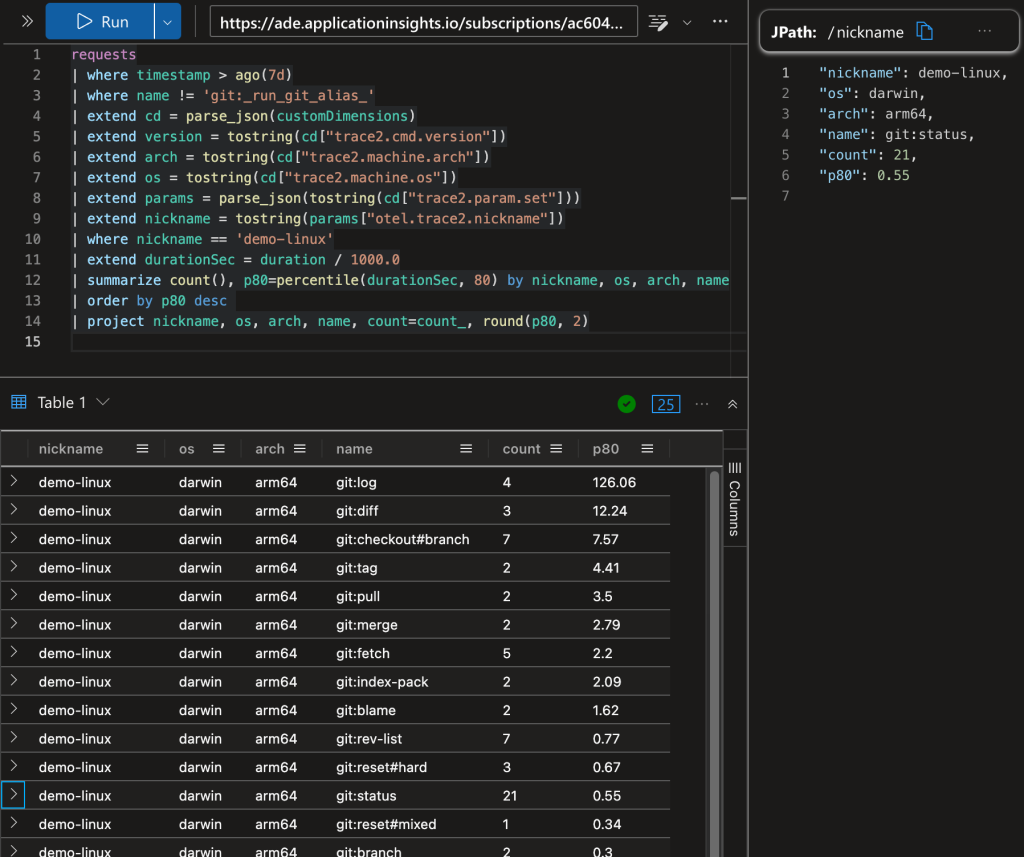
This query groups command counts and P80 durations by repository, operating system, and processor. For example, it shows 21 instances of git status on "demo-linux" with 80% finishing in under 0.55 seconds.

Comparing the same command across repositories can reveal important differences. Here, git status on a clone of chromium/chromium.git is shown alongside the Linux repository. The Chromium working directory is substantially larger, so direct performance comparisons between the two aren't meaningful. That motivates partitioning your data rather than relying on composite metrics.
Partitioning strategies
A single aggregate P80 for a command across all repositories has limited value when repository size varies so much. Partitioning the telemetry stream by relevant dimensions gives you more actionable insight.
Repository nicknames
One approach is to tag each command with a repository nickname. The setup involves three steps:
- Configure the collector to recognize
otel.trace2.nicknameas the Git config key in itsfilter.ymlfile. - Set
trace2.configParamsglobally to send all Git config values with theotel.trace2.*prefix. - Set
otel.trace2.nicknamelocally in each working directory to distinguish repositories.
Telemetry then arrives with trace2.param.set["otel.trace2.nickname"] in the metadata, and queries can be partitioned by that value.
Other configuration values
You're not limited to a custom prefix. Existing Git config values work too. For instance, setting trace2.configParams to 'otel.trace2.*,core.fsmonitor,core.untrackedcache' sends the repo nickname alongside whether the FSMonitor and untracked cache features are enabled.
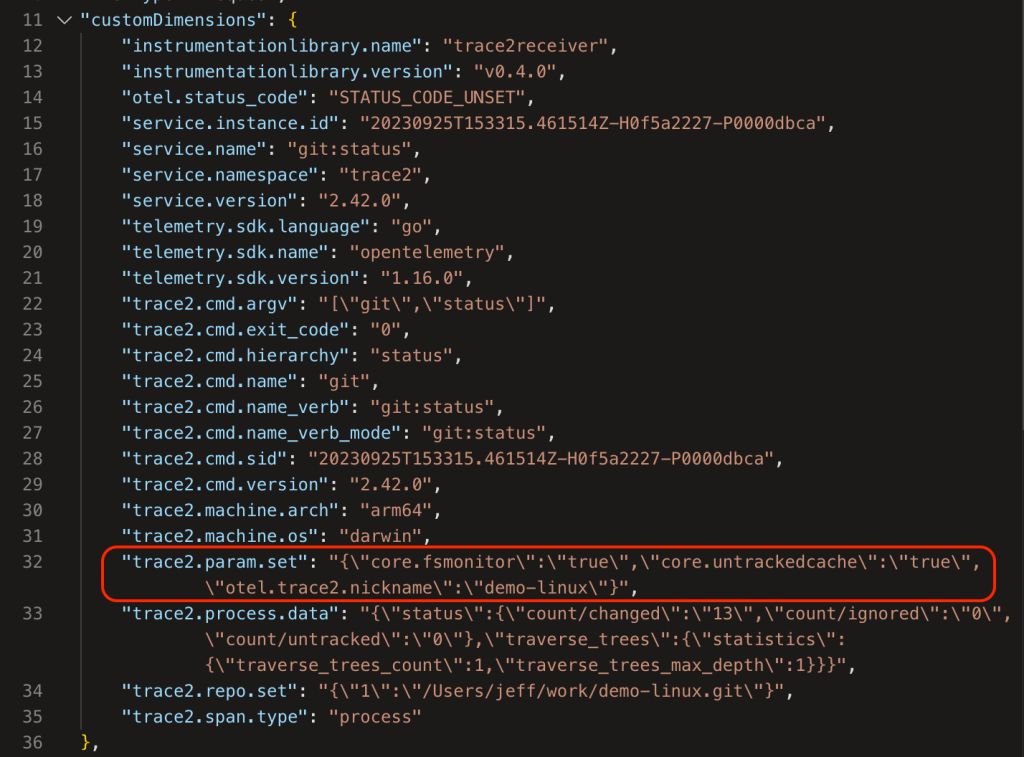
This mechanism can also carry global settings for cohort definitions in A/B testing or to distinguish laptops from build servers by machine type. These are just a few ways to enrich the data stream for better partitioning.
Caveats when analyzing data
Several factors can skew your view of Git performance. Being aware of them prevents drawing the wrong conclusions.
Sleeping laptops
Laptops can go into sleep or hibernation mid-command. Git includes wall-clock time in its event data, so a command that started before a Friday-night sleep and finished Monday morning will show an arbitrarily large delay. An unexpectedly long runtime that spans a weekend is likely a machine sleep artifact, not a performance regression.
Hooks are invisible
Git hooks — typically shell scripts that run pre- or post-command — don't emit Trace2 telemetry. Their execution time is attributed to the parent Git process span because Git blocks while the hook runs. If a hook invokes helper Git commands, those appear as children of the outer Git command rather than of the hook script, since the hook process itself isn't represented.
Interactive waits
Some commands wait on user interaction, which can produce misleadingly long durations:
git commitblocks until the editor is closed.git fetchorgit pushmay require a terminal password or interactive credential helper.git logorgit blamemay spawn a pager and block on I/O until it exits.
These commands can look like they took hours simply because they were waiting for human input.
Exposing child processes
To gain visibility into hidden processes — hooks, editors, or other interactive components — you can enable the dl:process or dl:verbose detail levels. The trace2receiver creates child(...) spans from Trace2 child_start and child_exit event pairs, capturing how long Git waited on each child. For helper Git commands, a separate process span appears (slightly shorter due to startup overhead). For shell scripts, the child span may be the only evidence an external process was involved.
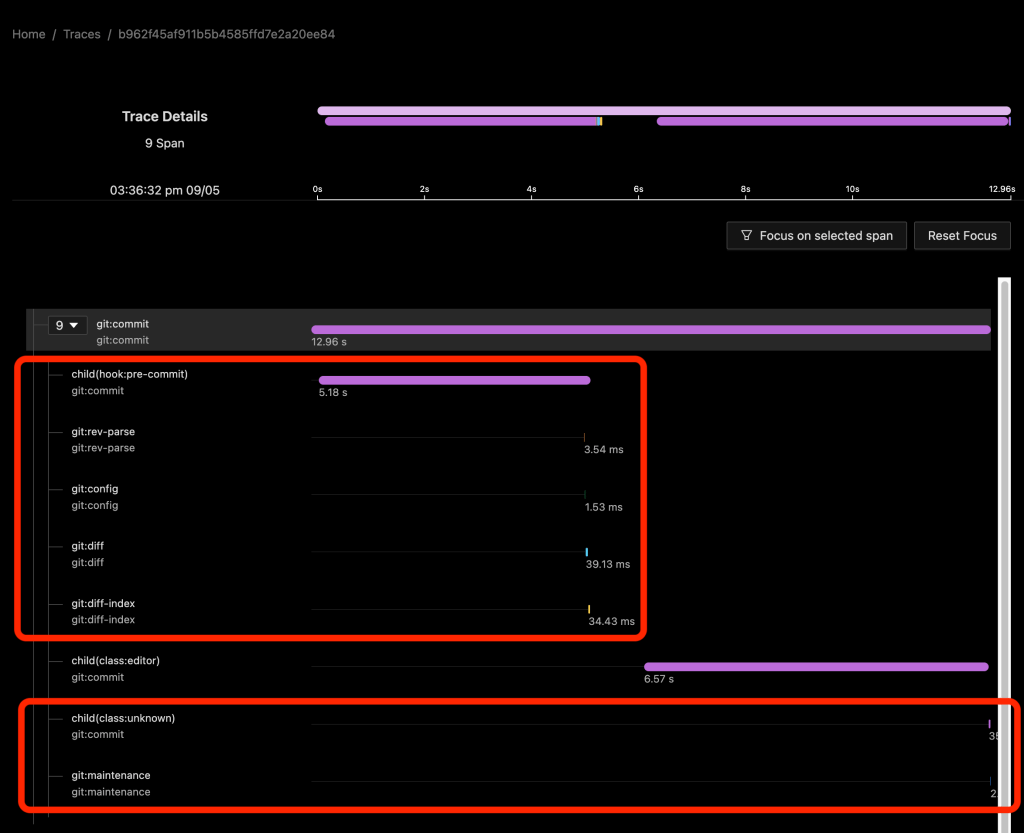
In the example above, a git commit on a repository with a pre-commit hook shows the hook ran for about five seconds and invoked four helper commands. The editor span shows it took nearly seven seconds to open and close. Note that enabling these detail levels also produces some less meaningful child spans — here, a child(class:unknown) refers to the git maintenance process immediately below it.
Turning telemetry into action
With trace data flowing, the next step is putting it to work. Dashboards are the obvious starting point for spotting trends and regressions over time. Beyond that, several Git features are designed to address the kinds of performance bottlenecks telemetry tends to surface: Scalar, Sparse Checkout, Sparse Index, Partial Clone, FSMonitor, and the Commit Graph. A Git Bundle Server on your network can also cut down clone and fetch latency.
Repository hygiene matters too. Running git maintenance keeps objects and refs tidy, and parallel checkout can dramatically speed up large working-directory population on multi-core machines.
It's also worth studying how other organizations have tackled similar problems. Canva, Dropbox, and Tower have all published detailed accounts of their Git performance work at scale.
- Canva's half-a-million-file repository report
- Dropbox's targeted monorepo fix
- Tower's general Git performance guide
Bottom line
Git performance is inherently tied to your repository's data shape, so there is no universal setting that fits everyone. The trace2receiver component and a custom OpenTelemetry collector give you the means to collect performance data for your own repositories, analyze it, and identify the specific bottlenecks your organization faces. That evidence should drive your decisions, whether the answer is upstreaming a new feature into Git, deploying a local network cache, or enabling existing performance features more aggressively.
The trace2receiver component is open source under the MIT License, and contributions are welcome via the contribution guide. Two caveats to keep in mind: the current release does not detect system suspend/resume events to annotate the data stream, and "unknown" child processes in the Trace2 data simply reflect call-sites in Git that haven't yet been updated to pass classification information down—think "unclassified" rather than something anomalous.



