
Why field data matters
Core Web Vitals are valued because they capture what users actually experience: how long content takes to appear, how long until a page can be interacted with, and whether layout shifts disrupt what someone is doing. Google's tooling for these metrics is built around synthetic lab data from Lighthouse, where environment, device, and network speed are under your direct control.
Sentry's approach instead aggregates field data — what real users encounter, including variable network speed, browser, device, and region. That distinction matters because lab conditions only describe part of the picture.
From transactions to metrics
Sentry breaks transactions down into the key metrics so you can see how customers run into performance problems. For example, it might surface that 42% of the time a transaction has an input delay greater than 301ms, and show how that correlates with other issues.
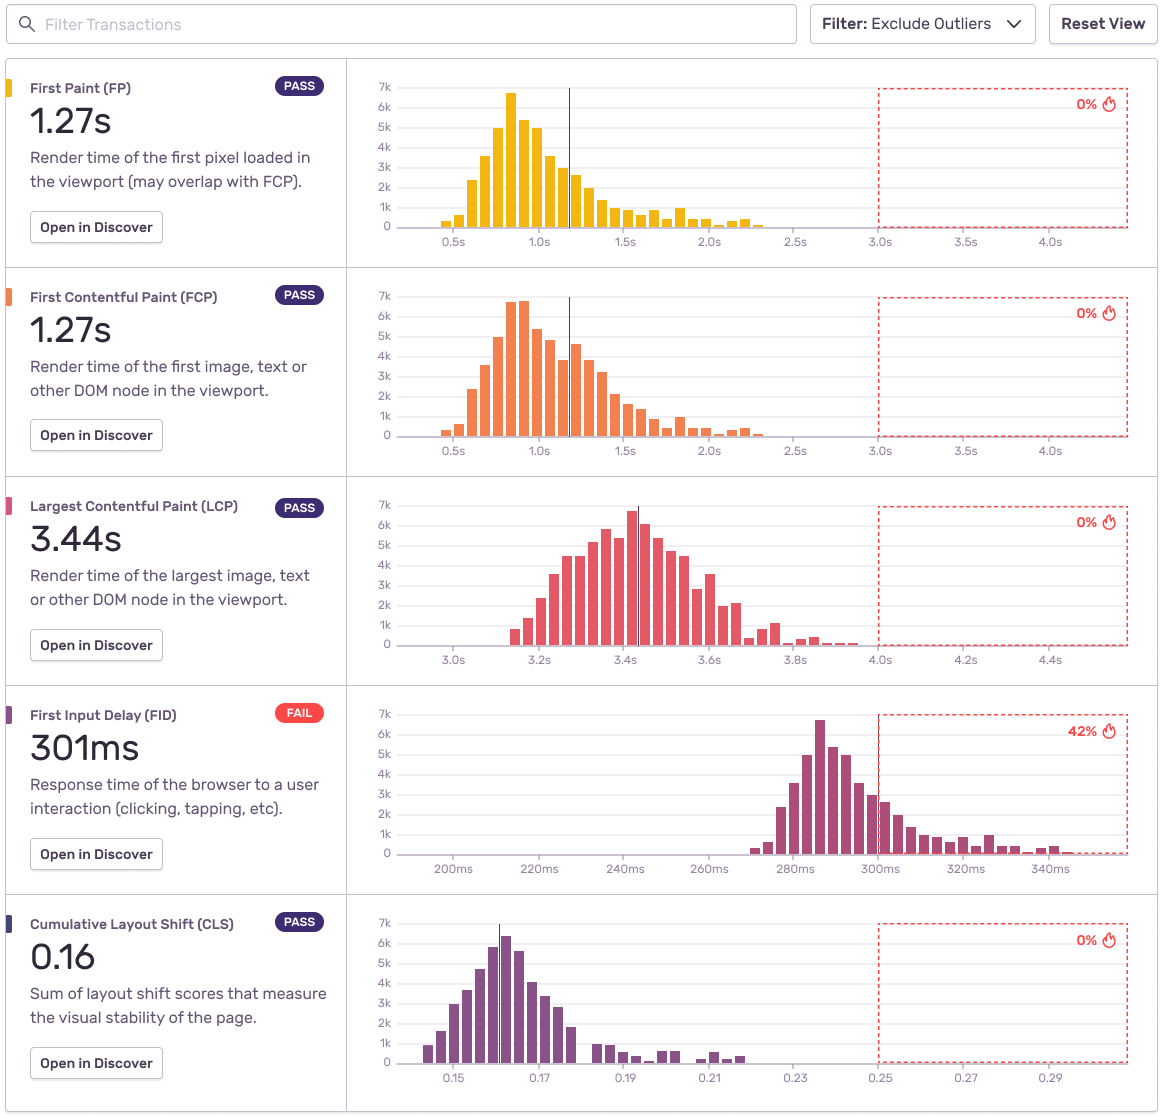
The value of pairing Web Vitals with field data is that a fast app on great wifi is only half the story. A visual built on actual user data shows which specific actions are slowing things down, which both supports the decision to dig into the codebase and helps prioritize the fixes — something rarely discussed in performance work.
Context changes what a number means
Identifying the most important performance problem in an app right now is harder than it appears. A five-second First Paint may be acceptable on a settings page, while three seconds on a checkout page is intolerable for both the business and its customers. The same metric result carries different weight depending on context, and some metrics matter more than others in a given situation.
This is also where Lighthouse falls short: its scores are useful, but they are not an accurate measure of how users actually use your app based on your own data.
Tracking regressions over time
Once Sentry is set up, the Performance section shows which transactions are improving over time and which have regressed. Sentry engineer Tony Xiao used this to investigate a front-end problem, starting from the Most Regressed Transactions report to find the specific transaction behind a negative result and identify the issue.
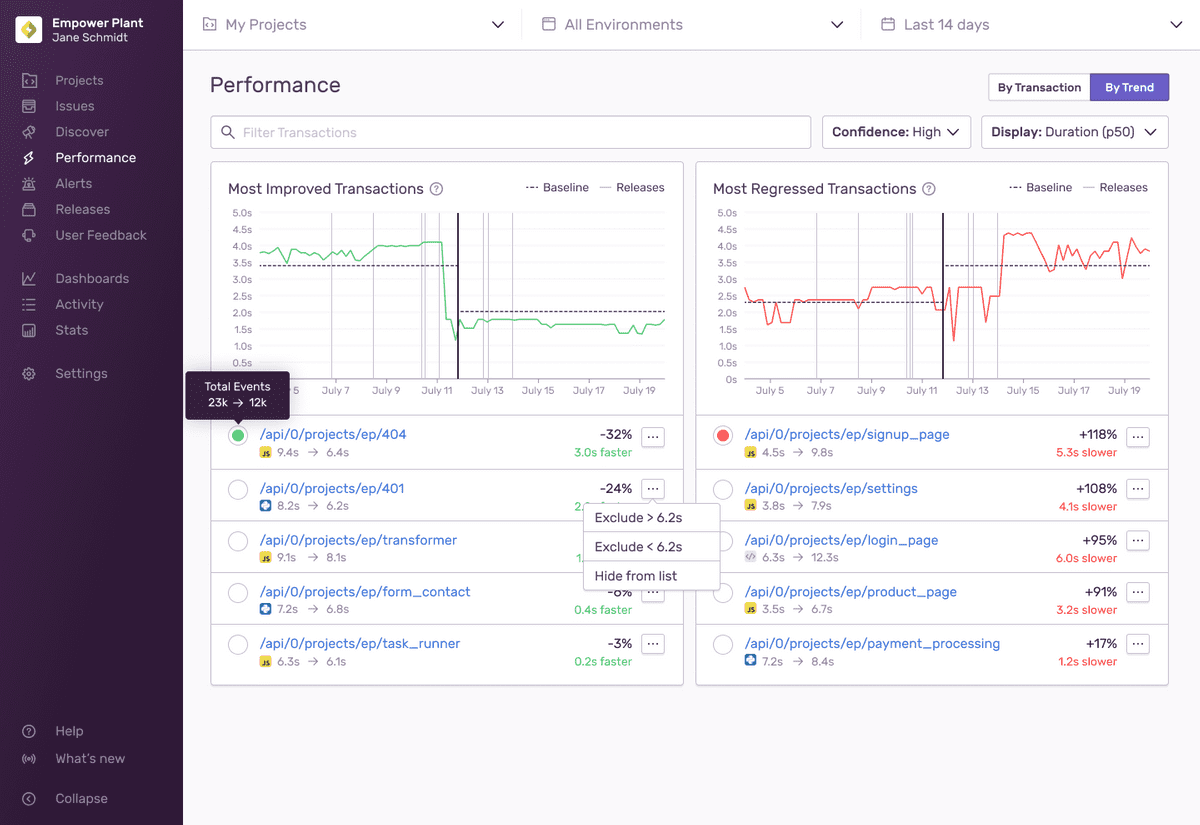
To a fault, code is loyal to its author. It's why communicating with your code is critical. And it's why trends in performance monitoring is so valuable: it not only helps you understand the ups and downs, but it can help point you in the right direction.
Viewing how users experience an app in real time, then visualizing how metrics change over time, is the practical payoff: it turns performance from an abstract exercise into something you can act on and prioritize.