RAIL: A User-Centered Framework for Web Performance
RAIL is a performance model that frames web performance in terms of user experience. Instead of focusing on raw technical metrics, RAIL breaks down user interactions—like tapping, scrolling, and loading—into four categories: Response, Animation, Idle, and Load. Each context carries distinct user expectations, which are grounded in UX research on human perception of delays.
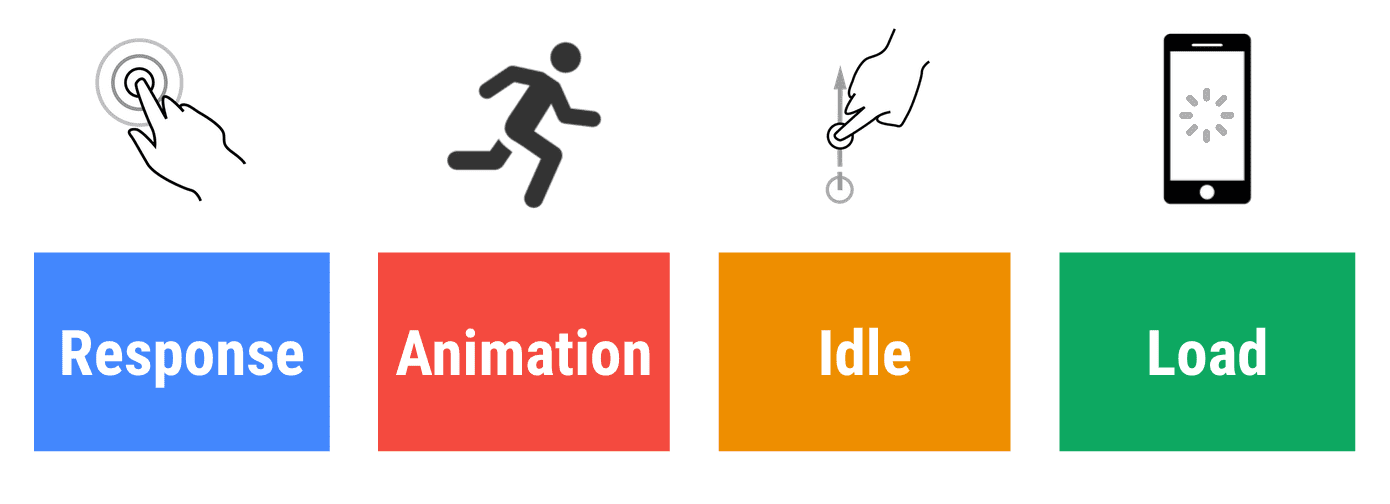
The model centers on the user, with performance criteria derived directly from how users perceive speed. The central principle is that optimization efforts should always start by asking what users are experiencing, rather than what the browser is doing.
| 0 to 16 ms | Users are exceptionally good at tracking motion, and they dislike it when animations aren't smooth. They perceive animations as smooth so long as 60 new frames are rendered every second. That's 16 ms per frame, including the time it takes for the browser to paint the new frame to the screen, leaving an app about 10 ms to produce a frame. |
| 0 to 100 ms | Respond to user actions within this time window and users feel like the result is immediate. Any longer, and the connection between action and reaction is broken. |
| 100 to 1000 ms | Within this window, things feel part of a natural and continuous progression of tasks. For most users on the web, loading pages or changing views represents a task. |
| 1000 ms or more | Beyond 1000 milliseconds (1 second), users lose focus on the task they are performing. |
| 10000 ms or more | Beyond 10000 milliseconds (10 seconds), users are frustrated and are likely to abandon tasks. They may or may not come back later. |
Response: Handling Input Events
Goal: Users should feel that their input triggers an immediate response. To achieve this, complete any visual transition initiated by user input within 100 ms. This applies to most inputs, including button clicks, form control toggles, and the start of animations, but excludes touch drags and scrolls.
Guidelines:
- Process input events within 50 ms to leave room for visible response within the 100 ms goal.
- It is not always optimal to handle input immediately. The 100 ms window can be used for non-urgent tasks, but avoid blocking the user. Offload such work to background execution when possible.
- For any action requiring more than 50 ms to complete, always provide user feedback.
The 50 ms vs. 100 ms Distinction
The guideline targets 50 ms even though the goal is 100 ms because idle-phase work often consumes part of that budget. If the main thread is busy with an idle task when input arrives, the event may be queued for up to 50 ms. Accounting for that, only the remaining 50 ms is available for actual event handling.

Animation: Frame Production Targets
Goal: Aim for each animation frame to render within 10 ms or less. While the theoretical limit per frame is 16 ms (1000 ms divided by 60 fps), browsers require roughly 6 ms for rendering, leaving 10 ms for your code. Prioritize visual smoothness—users are sensitive to frame rate variations.
Guidelines:
- In animation-heavy contexts, scrutinize every operation. Where possible, skip work entirely; otherwise, perform the absolute minimum required.
- Use the 100 ms response window to precompute expensive operations, maximizing the chance of maintaining 60 frames per second.
- Visual animations include entrances, exits, tweens, and loading indicators.
- Scrolling, including fling gestures where the user releases after starting a scroll, is treated as animation.
- Dragging interactions like panning a map or pinch-zoom also fall under this category.
Idle: Using Downtime Effectively
Goal: Maximize idle time to give the page the best possible chance of responding to user input within 50 ms.
Guidelines:
- Defer non-critical work to idle periods. For initial page loads, request the minimum data, then use
requestIdleCallbackto load the remainder. - Execute idle work in chunks of 50 ms or less, so longer tasks don't prevent timely input responses.
- User interactions must take priority over idle work. If a user interacts with the page, the idle task should pause immediately.
Load: Achieving Fast Initial Experience
Research from publisher data indicates that faster-loading sites tend to have longer sessions, fewer bounces, and better ad visibility. Load speed should be the focus of performance goals that align with user patience and device capabilities.
Goals:
- Aim for first load interactivity within 5 seconds when using mid-range mobile devices over slow 3G connections.
- For subsequent loads, target a page load under 2 seconds.
- Optimization should be relative to the actual devices and network conditions of your users.
Guidelines:
- Test your site with the hardware and connectivity typical for your audience. The Chrome User Experience Report can supply connection distribution data; when that isn't available, assume a Moto G4-class device on slow 3G (400 ms RTT, 400 kbps) as a baseline, as available in WebPageTest.
- Your users' hardware may report a faster connection (e.g., 4G) than the effective connection speed—due to packet loss and network fluctuation—so treat connection labels cautiously.
- To accelerate render, eliminate render-blocking resources. Lazy-loading images, code-splitting JavaScript bundles, and other performance optimizations can make the page feel complete faster without loading every asset upfront.
Measuring RAIL in practice
RAIL gives you a framework for thinking about performance, but to actually make improvements you need tools that expose the right metrics. The choice depends on whether you want to trace low-level activity during development or audit a page against concrete performance budgets.
Chrome DevTools profiling and throttling
The Performance panel in Chrome DevTools is the primary tool for recording and analyzing everything that happens while a page loads or runs. Several of its features map directly to RAIL categories:
CPU and network throttling let you simulate less-powerful devices and slower connections without leaving the browser.
Main thread activity can be viewed as a flame chart of every event that occurred during recording, or sorted in a table to find which activities took the most time.
FPS analysis verifies whether animations are truly producing frames at a smooth rate.
The Performance Monitor provides real-time metrics for CPU usage, JS heap size, DOM nodes, and layouts per second.
Network requests during the recording are visualized in a dedicated section.
Screenshots capture the visual state of the page at intervals, so you can play back exactly how the page looked while loading or during an animation.
The Interactions view identifies what happened on the page after a user interaction.
Scroll performance issues can be found in real-time by highlighting parts of the page whenever a potentially problematic event listener fires.
Paint events can be shown live to detect costly paint operations that hurt animation performance.
Lighthouse audits
Lighthouse is available from Chrome DevTools, PageSpeed Insights, a Chrome Extension, a Node.js module, and within WebPageTest. It simulates a mid-range device on a slow 3G connection, runs a series of audits, and produces a report with suggestions. For RAIL purposes, several existing audits are grouped by the stages they address:
Response
Max Potential First Input Delay estimates how long the app will take to respond to user input based on main thread idle time.
An audit for passive event listeners warns when missing
passivelisteners may hurt scrolling performance.Total Blocking Time measures the total duration a page is blocked from responding to user input such as clicks, taps, or key presses.
Time To Interactive indicates when users can consistently interact with all page elements.
Load
A check for service worker registration flags pages where a service worker is not controlling the page and its
start_url, since a worker can cache common resources and reduce network fetching.A check for mobile load speed flags pages that are not fast enough on mobile networks.
Audits for render-blocking resources, offscreen images, image sizing, critical request chains, HTTP/2 usage, image encoding, text compression, and network payload size identify specific load-time inefficiencies.
An audit for excessive DOM size points out when you are shipping more DOM nodes than needed for rendering the page, reducing unnecessary network bytes.
WebPageTest
WebPageTest differs from the other options by running real browsers against a page. A report at webpagetest.org/easy uses a real Moto G4 device on a slow 3G connection to collect timing metrics from an actual load. The tool can also be configured to include a Lighthouse audit in the same run.
RAIL works as a lens for examining a website's user experience as a series of distinct interactions. Keeping the user's perception in mind when setting performance goals focuses effort where it matters: respond to input within 100 ms, produce frames within 10 ms during animation or scrolling, maximize main thread idle time, and achieve interactive load within 5000 ms.



