
Why animation feels slow (and what to do about it)
HTML5 gives web developers powerful tools for building visually rich applications, and animation is one of the most effective ways to improve the user experience. But smoothness is not simply a matter of pushing frame rates higher. Perceived quality depends on consistency: 30 frames per second with no drops often feels better than a nominal 60 fps that stutters. The techniques below help you keep animation steady and avoid the jaggedness that users notice immediately.
The high-level approach
Don't let performance concerns discourage you from building ambitious, visual apps. Build first, and return to these techniques when you observe real slowdowns. That said, some upfront habits—like preferring CSS transitions over manual style manipulation—will save you from costly refactors later.
Offload work to the GPU
Hardware acceleration is the biggest single win for render performance. The browser hands off well-defined tasks from the main CPU to the graphics processing unit, which often yields large gains and reduces power consumption on mobile devices. The GPU can accelerate these parts of your document:
- General layout compositing
- CSS3 transitions
- CSS3 3D transforms
- Canvas drawing
- WebGL 3D drawing
The first three apply to nearly every app; the last two are more specialized. Acceleration works by splitting the document into layers that stay invariant during the animation. The GPU composites those layers, applying effects on the fly. If done well, an animated element never forces the page to relayout.
The key is making it easy for the rendering engine to recognize when it can use GPU acceleration. Animating left and top via JavaScript does not signal intent to the browser. A CSS3 transition does: the browser owns the animation and can apply optimizations, including GPU compositing, without input from your code.
To debug acceleration in Chrome, use these flags:
--show-composited-layer-bordersdisplays a red border around elements manipulated at the GPU level, confirming your changes stay within the composited layer.--show-paint-rectsoutlines all areas that are repainted, letting you watch the browser optimize its paint regions.
WebKit-based browsers (Safari, iOS) expose similar runtime diagnostics.
Prefer CSS transitions
Transitions are not only simpler to write, they are a performance feature. Because the browser controls the animation timeline, it can improve fidelity and, in many cases, enable hardware acceleration. WebKit browsers already accelerate CSS transforms on desktop and mobile; support in other engines is expanding.
To script around transitions, listen for the transition end event. At the moment that means subscribing to all vendor-prefixed variants: webkitTransitionEnd, transitionend, and oTransitionEnd. Several libraries, including scripty2, YUI Transition, and jQuery Animate Enhanced, use transitions when available and fall back to older DOM-style animation otherwise.
Animate transforms, not layout properties
Moving an element by updating left and top forces layout on every frame. CSS 2D transforms give you the same visual result with translate(), which the browser can offload to the GPU. Combined with a transition, you get hardware-accelerated motion with little effort.
For more complex cases, a resilient pattern is to feature-detect: use CSS transforms and transitions when supported, and fall back to a JavaScript animation library otherwise. jQuery Transform and similar polyfills can make this an automatic process.
Let the browser drive your animation loop
window.requestAnimationFrame is a native API for animation that works with DOM/CSS changes, <canvas>, and WebGL. The browser schedules all active animations into a single reflow and repaint cycle, which improves fidelity and helps JS-based animations stay synchronized with CSS transitions or SVG SMIL animations. Importantly, if the tab is not visible, the browser pauses the loop, cutting CPU, GPU, and memory use and preserving battery life.
If you are still driving animation with setTimeout, switching to requestAnimationFrame is a low-effort, high-impact change for both performance and power consumption.
Reading the Profiler Output
When an app feels sluggish, profiling is the way to find out where time actually goes. Optimizations frequently complicate code, so they should only be applied where they will pay off. Profilers exist to point you at those high-yield spots rather than guessing.
JavaScript Function Timings
JavaScript profilers measure how long each function takes to execute, from entry to exit. They report two metrics for a function:
- Gross time: the total execution time, including calls made from within the function.
- Net time: gross time minus the time spent in called functions.
Because some functions run more often than others, profilers typically aggregate all invocations and show totals, averages, and min/max times.
One point to keep in mind: JavaScript profilers measure DOM work indirectly. Even if your code executes almost no pure JavaScript, a function that interacts with the DOM in a wasteful way will still show up prominently in the profile.
For example, this code spends almost no time doing actual JavaScript, yet drawArray will dominate your profile because of its inefficient DOM access:
function drawArray(array) {
  for(var i = 0; i < array.length; i++) {
    document.getElementById('test').innerHTML += array[i]; // No good :(
  }
}
Profiling Anonymous Functions
Anonymous functions are hard to track in profilers because they have no name to display. You can fix this in two ways:
Instead of this anonymous function assigned to a callback:
$('.stuff').each(function() { ... });
You can name the function expression:
$('.stuff').each(function workOnStuff() { ... });
A less widely known feature: JavaScript allows you to name function expressions, which makes them show up cleanly in profiler output. One caveat — the name is placed into the current lexical scope and could clash with existing symbols.
Profiling Long Functions
If you suspect a bottleneck hides inside a single long function, you have two options:
- The clean way: refactor so you don't have long functions at all.
- The quick way: wrap suspicious sections in named, self-invoking functions. With care, this doesn't change behavior and exposes each section as a separate profiler entry:
function myLongFunction() {
  ...
  (function doAPartOfTheWork() {
    ...
  })();
  ...
}
Just remember to remove those temporary wrappers after profiling — or use them as a starting point for a proper refactor.
DOM-Level Profiling with the Timeline
The Chrome Web Inspector's Timeline view records low-level browser actions while your code executes. The goal is to reduce the number of actions the browser must perform. Since the Timeline generates a lot of detail, isolate a minimal test case and run it on its own.
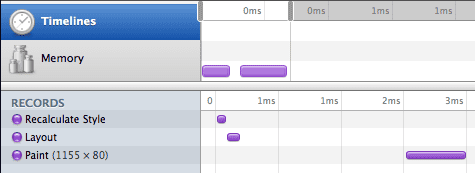
The left pane lists the operations in the order they ran; the right side shows the time each operation took.
See the Timeline documentation for more detail. An alternative tool for Internet Explorer is DynaTrace Ajax Edition.
Practical Profiling Strategies
Isolate the Target
When profiling, focus on the narrow slice of functionality you suspect is slow. Run the profiler, exercise only the relevant code path, then stop. This keeps unrelated activity out of your readings. Two common cases:
- Startup: enable the profiler, reload the app, wait for initialization, stop.
- A button click and its animation: start profiling, click, wait for the animation to finish, stop.
This is more awkward in GUI code than in a CPU-bound benchmark — moving the mouse over other controls can fire unrelated handlers and muddy the data.
Programmatic Control
There is a JavaScript API for turning the profiler on and off from within the page, which gives you precise boundaries:
console.profile() starts the session, and console.profileEnd() stops it.
Checking Repeatability
Profiling results are only meaningful if you can reproduce them. Function-level timing is not an exact science. You are measuring a shared computer, and many things can interfere within a single run:
- An unrelated timer in your own app firing mid-measurement.
- The garbage collector going to work.
- Another browser tab consuming the same rendering thread.
- Other programs competing for CPU time.
- Sudden changes in the gravitational field of the earth.
Running the same code several times in one profiling session smooths out these external spikes and makes real hotspots stand out more clearly.
The Improvement Loop
Once a slow section is identified, try to improve its execution behavior. After changing the code, profile again. If you don't see a measurable improvement, roll the change back — do not leave it in place just because it doesn't visibly break anything. Measure, improve, measure.
Optimization Strategies
Cache what you read from the DOM
JavaScript engines have gotten dramatically faster over the years, but DOM access has not kept pace — and for practical reasons never will. Layout and drawing operations simply take time. The most reliable way to speed up client-side code is therefore to reduce how often you touch the DOM in the first place.
If you retrieve a node or a node list and expect to need it again later (even just in the next loop iteration), cache it. As long as you are not adding or removing nodes in that area of the tree, the reference stays valid.
Before:
function getElements() {
  return $('.my-class');
}
After:
var cachedElements;
function getElements() {
  if (cachedElements) {
    return cachedElements;
  }
  cachedElements = $('.my-class');
  return cachedElements;
}
The same logic applies to attribute values. If your code is the only thing that modifies a particular style property, keep the last computed value in a variable instead of re-reading it on each frame:
var ele = $('#element');
var left = parseInt(ele.css('left'), 10);
setInterval(function() {
  left += 5;
  ele.css('left', left + 'px');
}, 1000 / 30);
Separate calculation from DOM manipulation
Loops are natural hot spots. Wherever possible, decouple the number crunching from the DOM updates — finish the computation first, then apply all of the results in a single pass.
Before:
document.getElementById('target').innerHTML = '';
for(var i = 0; i < array.length; i++) {
  var val = doSomething(array[i]);
  document.getElementById('target').innerHTML += val;
}
After:
var stringBuilder = [];
for(var i = 0; i < array.length; i++) {
  var val = doSomething(array[i]);
  stringBuilder.push(val);
}
document.getElementById('target').innerHTML = stringBuilder.join('');
Reading a DOM value is particularly expensive when the browser has to recalculate it because you recently changed something related. Avoid interleaving reads and writes. Structure your code in two clear phases: first read all DOM values your code needs, then perform all of the modifications. The pattern below forces the browser to do extra work:
- Read values
- Modify the DOM
- Read more values
- Modify again
Before:
function paintSlow() {
  var left1 = $('#thing1').css('left');
  $('#otherThing1').css('left', left);
  var left2 = $('#thing2').css('left');
  $('#otherThing2').css('left', left);
}
After:
function paintFast() {
  var left1 = $('#thing1').css('left');
  var left2 = $('#thing2').css('left');
  $('#otherThing1').css('left', left);
  $('#otherThing2').css('left', left);
}
The two render timings below illustrate the difference. The slow version forces the browser to recalculate styles and perform layout twice for the same end result; the reordered version does the same work with a single pass.
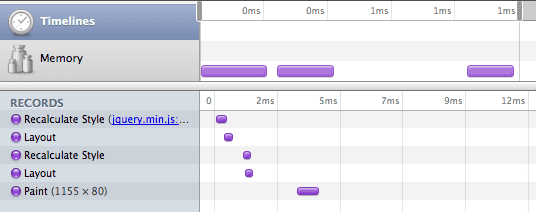
This advice applies within any single JavaScript execution context — an event handler, an interval callback, or an Ajax response handler. Reordering DOM access patterns yields dramatic improvements in real-world code.
The event loop and repaints
Browsers run JavaScript on an event loop. By default the browser idles until an event arrives — a user interaction, a timer, an Ajax callback — and then runs the corresponding handler. Once the script finishes, the browser repaints the screen. Long-running scripts can therefore delay painting noticeably.
Two practical consequences:
- If your animation logic takes longer than roughly 1/30 of a second to execute, you will miss the frame budget. Handling user events at the same time requires even faster execution.
- Delaying work with
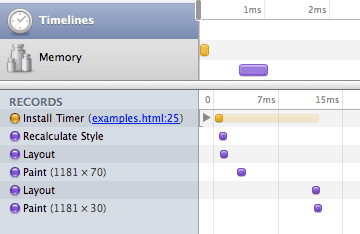
setTimeout(function() { ... }, 0)splits execution into two separate cycles. The browser may repaint between them, which doubles total paint time if the two callbacks both modify the page.
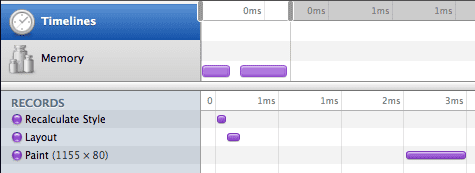
Regular version:
function paintFast() {
  var height1 = $('#thing1').css('height');
  var height2 = $('#thing2').css('height');
  $('#otherThing1').css('height', '20px');
  $('#otherThing2').css('height', '20px');
}
Adding a minimal delay:
function paintALittleLater() {
  var height1 = $('#thing1').css('height');
  var height2 = $('#thing2').css('height');
  $('#otherThing1').css('height', '20px');
  setTimeout(function() {
    $('#otherThing2').css('height', '20px');
  }, 10)
}
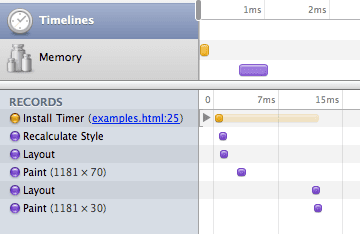
The second trace shows two paints even though the two DOM changes are separated by only a hundredth of a second.
Lazy initialization
Different user actions have different tolerance for delay. A mouseover handler must do almost no work — the user is still moving the mouse. A button click, on the other hand, can reasonably take a moment. Initialize components only when they are actually used, and defer expensive startup until the relevant interaction occurs.
Before:
js
var things = $('.ele > .other * div.className');
$('#button').click(function() { things.show() });
After:
js
$('#button').click(function() { $('.ele > .other * div.className').show() });
Event delegation
Attaching individual event handlers across a page is slow, and replacing elements dynamically forces you to reattach handlers. Event delegation sidesteps both problems: attach one handler to a parent node and inspect the event target to decide whether the event is of interest.
In jQuery this is straightforward:
$('#parentNode').delegate('.button', 'click', function() { ... });
Delegation is not always the faster choice. Initialization is constant-time, but the target check runs on every event invocation. For high-frequency events like mouseover or mousemove, per-event overhead can outweigh the savings.
Common Performance Problems
$(document).ready blocks startup
A good rule of thumb: do nothing heavy during $(document).ready. Serve the document in its final form instead. Register event listeners — preferably with id selectors or delegation — but defer even that for expensive events until they are actually needed. If you must fetch data or run initialization logic on load, show a placeholder animation (embedded as a data URI if it is an animated GIF) so the user sees immediate feedback.
Flash movies slow down the whole page
Embedding Flash always slows rendering somewhat, since the browser and the plugin have to negotiate the final window layout. If you cannot remove Flash, set its wmode parameter to "window" (the default). This disables compositing HTML and Flash elements — nothing can sit atop the movie and transparency is unavailable — but rendering performance improves dramatically. YouTube is a good example of carefully avoiding layers above the player.
localStorage writes stutter
Writing to localStorage is synchronous and can involve the disk. Do not perform such writes during animations or other timing-sensitive work. Defer them to a moment when the user is idle.
Slow jQuery selectors
First, verify whether your selector can be handled by document.querySelectorAll. A quick test in the console will tell you: if an exception is thrown, rewrite the selector to drop framework-specific extensions. Native parsing in modern browsers is typically an order of magnitude faster.
If the selector still underperforms:
- Make the rightmost part of the selector as specific as possible.
- Opt for a tag name that is rare in the document.
- Consider restructuring so an id-based lookup becomes possible.
Many small DOM manipulations
A series of individual inserts, removes and updates is slow. One common fix is to generate a single HTML string and assign it via domNode.innerHTML. Keep in mind that this can hurt maintainability and may create memory leaks in old versions of Internet Explorer.
A second option is to avoid generating markup with JavaScript altogether. If a widget (for example, a styled replacement for a select box) would require substantial client-side HTML construction, consider delivering the finished markup from the server. That approach carries its own tradeoffs, so weigh the speed gain carefully against the added complexity.
Profiling Tools
- JSPerf — benchmark small JavaScript snippets
- Firebug — profiling in Firefox
- Chrome Developer Tools (the WebInspector is also in Safari)
- DOM Monster — DOM performance analysis
- DynaTrace Ajax Edition — profiling plus paint optimization for Internet Explorer



