
Field Data Over Lab Data
Instant Domain Search has spent its entire existence optimizing for speed—the service is built around delivering domain name search results as quickly as possible. So when the team began checking their Core Web Vitals scores ahead of Google's Page Experience Update, founder Beau Hartshorne expected the numbers to look good. They didn't. A sea of red "poor" and yellow "needs improvement" results in Google Search Console showed that real users on real devices were having a noticeably worse experience than the team saw in their own testing.
The gap between lab results and field data came down to context. The team develops on fast hardware and fiber connections, the kind of environment that masks problems affecting users on mid-range mobile devices over slower networks. Core Web Vitals scores come from the Chrome User Experience Report, which aggregates real user experiences at the 75th percentile over a 28-day window. That's a stricter bar than a median score would be: it means three out of four visitors need to have a good experience for the site to earn a passing grade.
Stack History and Technical Debt
The site launched in 2005, when the stack was PHP, MySQL, and XMLHttpRequest, with Internet Explorer 6 as a fully supported browser. Since then it has migrated through a series of static site generators and JavaScript frameworks, settling on React served by Next.js for the front end and a Rust backend for domain name lookups. Content is statically exported as HTML, CSS, and JavaScript and served from a CDN whenever possible.
The architecture complicates performance tuning. When someone searches for a domain, the front end queries the Rust backend directly, bypassing the static content path. Some queries return instantly while others—particularly DNS lookups for certain TLDs—can take a second or two. The dynamic nature of these search results pages made it hard to predict how each individual user would experience the site.
Three Metrics, One Ranking Update
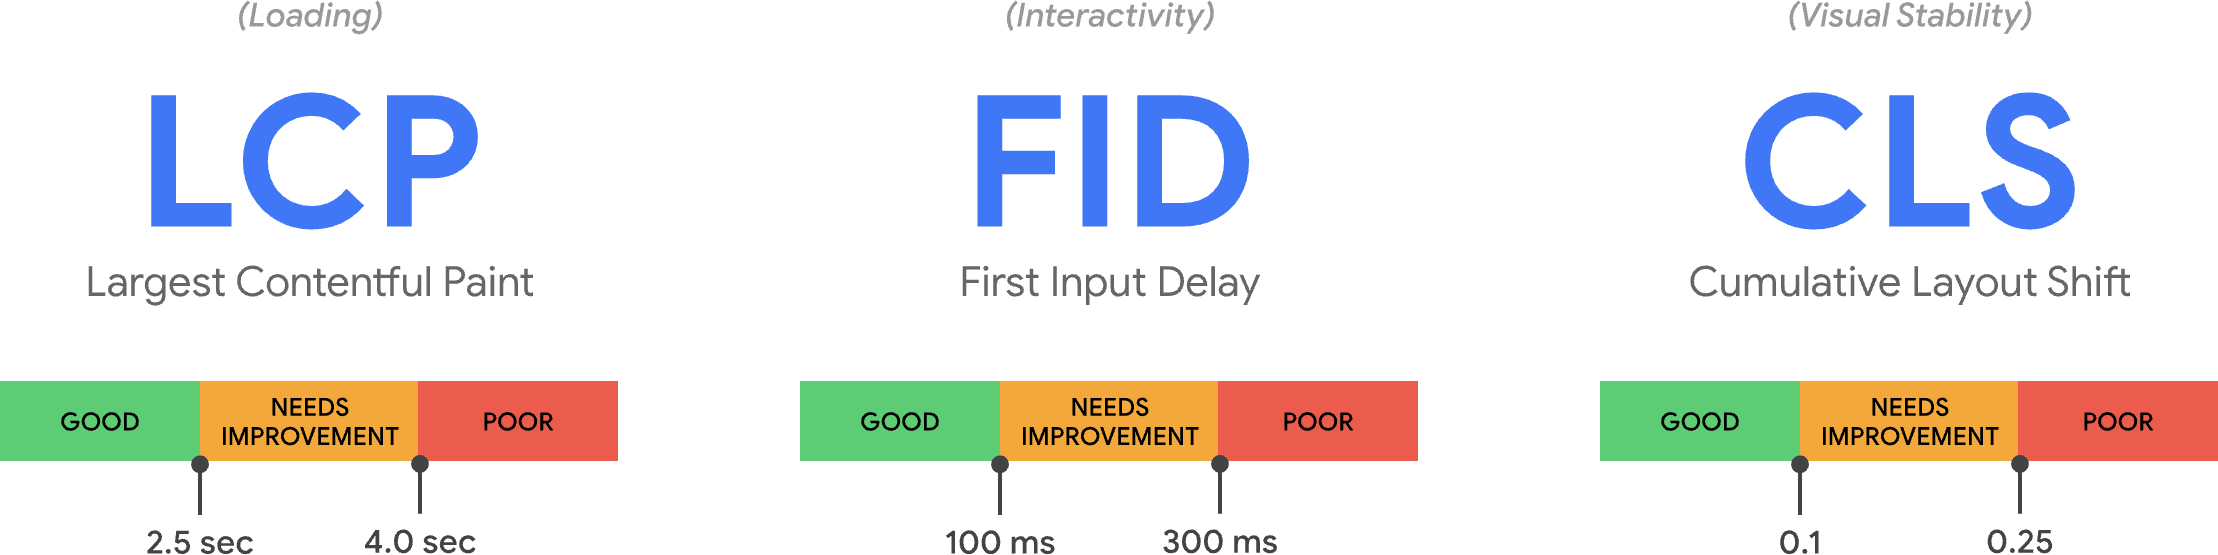
Google's Page Experience Update relies on three Core Web Vitals metrics, each reflecting a different aspect of user experience:
- LCP (Largest Contentful Paint) measures how quickly the largest content element becomes visible on screen.
- FID (First Input Delay) tracks responsiveness to initial interaction—the time between a tap, click, or keypress and the page's response.
- CLS (Cumulative Layout Shift) tracks visual stability by measuring how elements move on the page without user action.
These metrics are collected from logged-in Chrome users and aggregated into the Chrome User Experience Report, viewable via PageSpeed Insights. The 75th percentile threshold is a deliberate design choice: averages hide outliers, while 95th percentile scores capture too many irrelevant edge cases on old devices with broken connections.

Finding Easy Wins
Lighthouse, available both in Chrome DevTools and at web.dev/measure, surfaced the first set of technical problems. The Next.js optimizeCss experimental feature improved overall performance score significantly by addressing how CSS was bundled, which had been slowing initial rendering and hurting FID.
The audit also caught a cache misconfiguration. The team is hosted on Google Cloud Platform, and Google Cloud CDN requires Cache-Control headers to include public. Since Next.js doesn't let you configure all the headers it emits, the team placed the Next.js server behind Caddy, a lightweight HTTP proxy. That move also enabled them to leverage stale-while-revalidate so the CDN can fetch fresh content from the origin asynchronously.
Trimming Dependencies and Third-Party Scripts
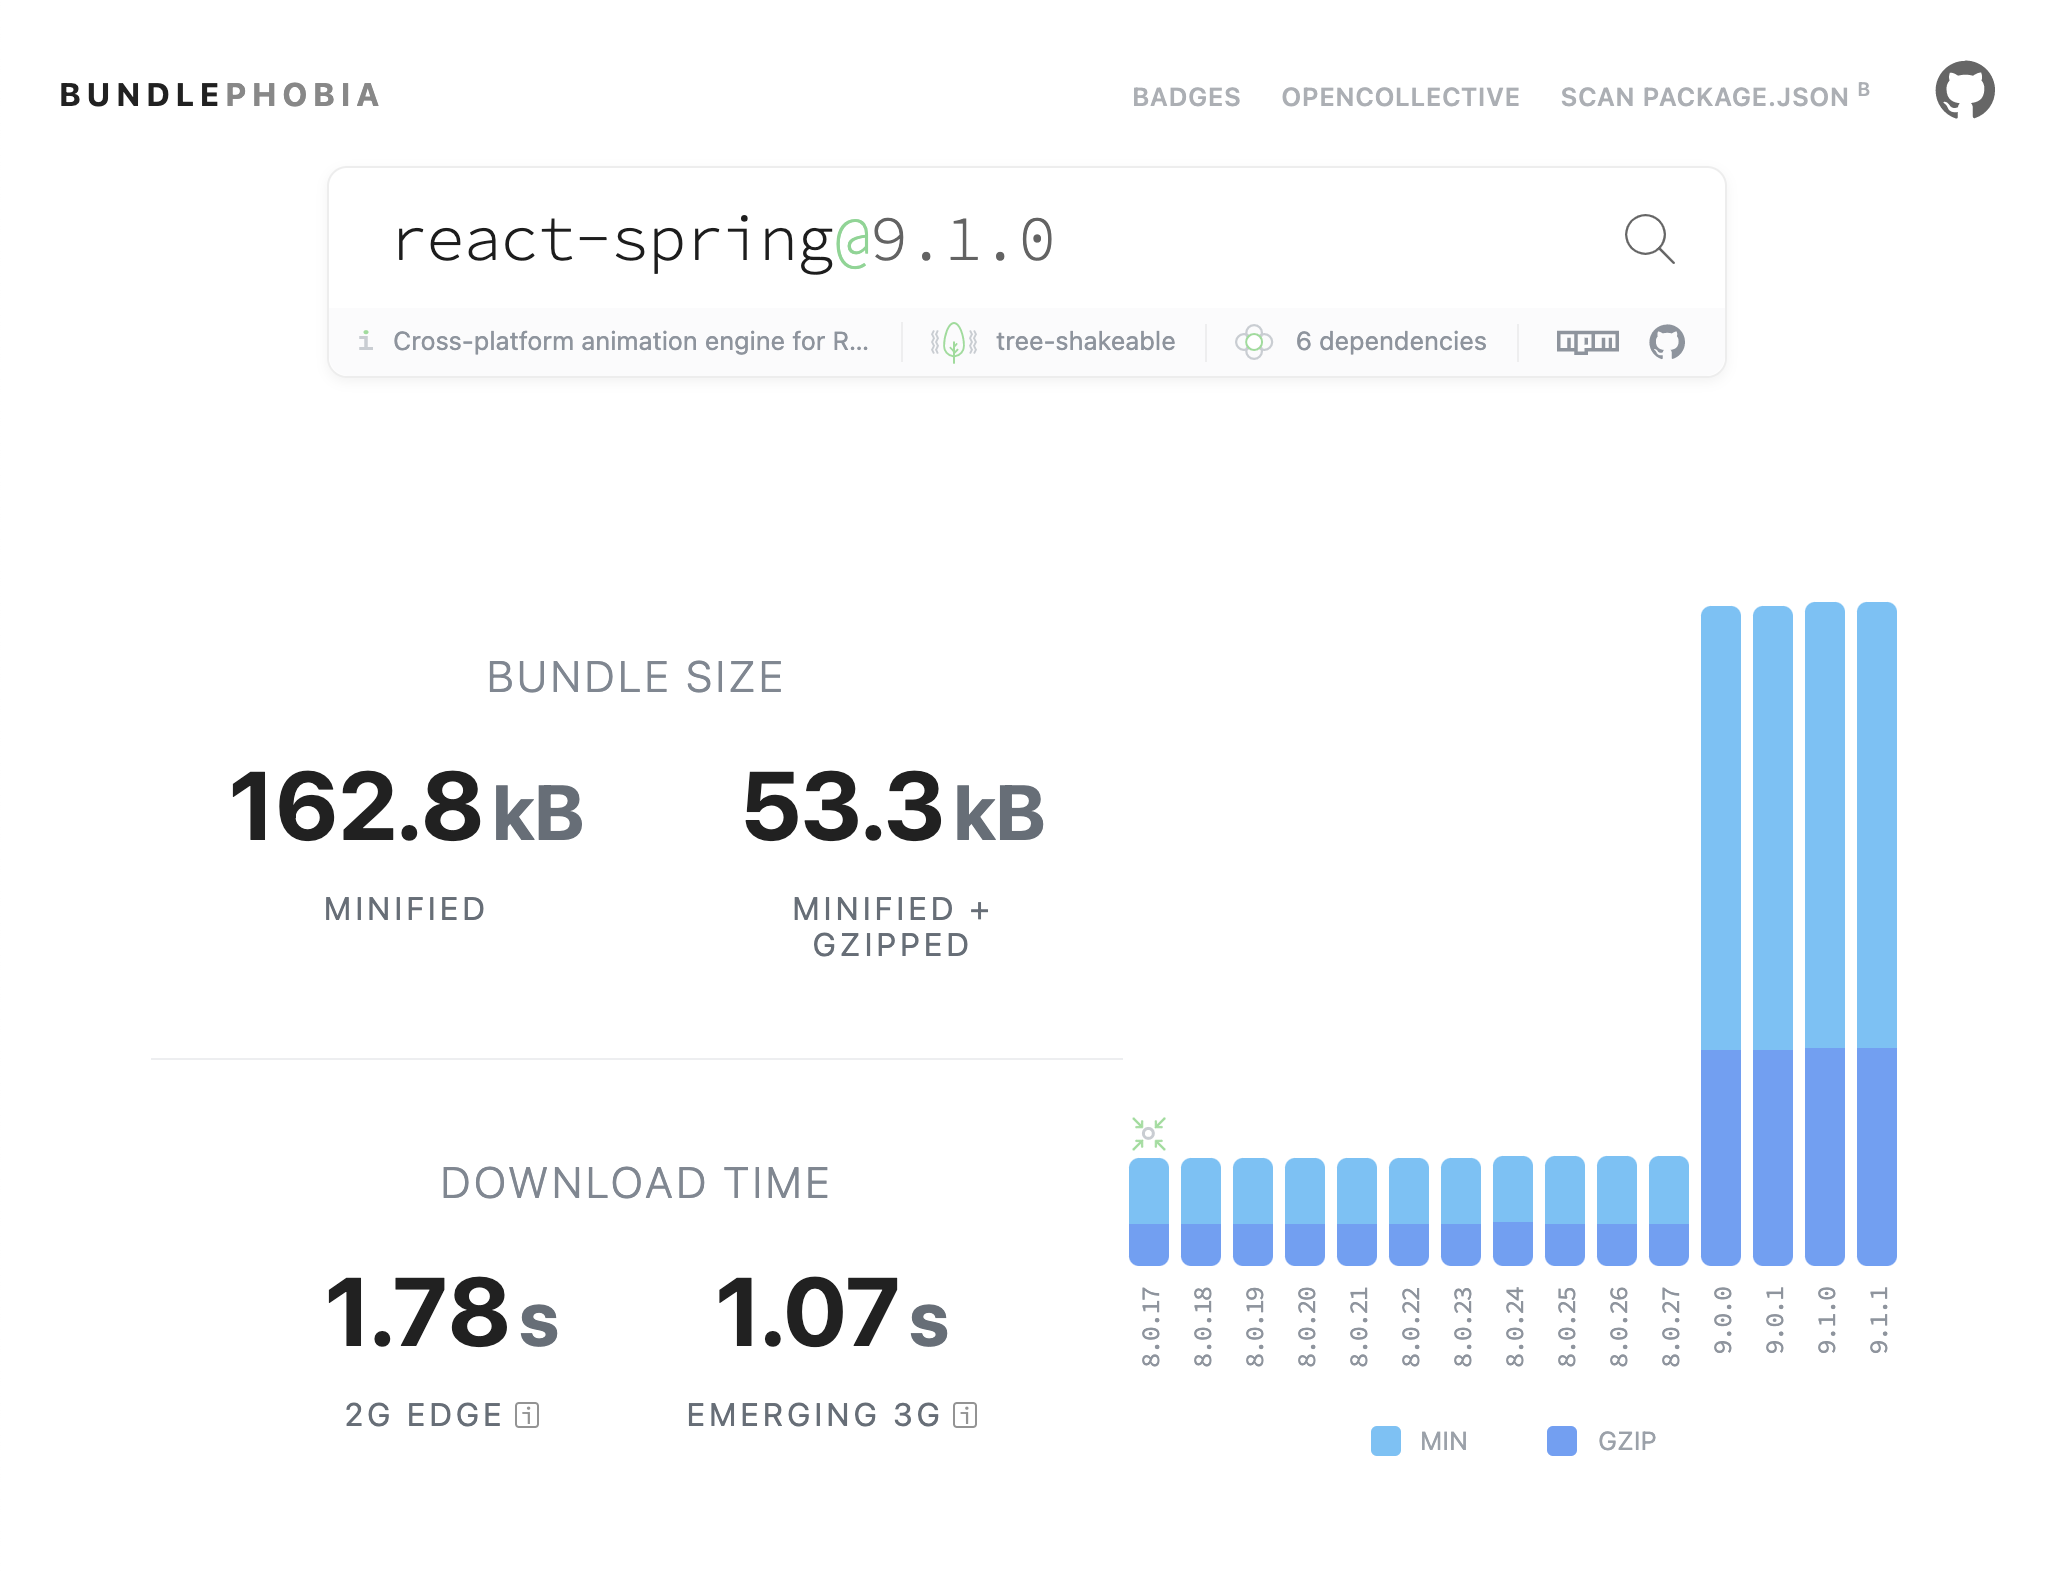
npm makes it easy for bundle sizes to creep upward without anyone noticing the accumulation. BundlePhobia helped the team see exactly what each package costs in bytes and dependencies, leading them to replace several react-spring-powered animations with simpler CSS transitions.
The same tools revealed that third-party error logging and analytics software were a significant part of the load time problem. The team removed these utilities entirely, replacing them with in-house client-side logging built on modern browser APIs: sendBeacon for sending data reliably at page teardown and ping attribute for link interactions. Logging data goes straight to their own Google BigQuery infrastructure, which gives them more granular queries than off-the-shelf tools can provide—with the added benefit of eliminating third-party cookies.
CLS Remains Stubborn
After improving FID and LCP, CLS became the primary problem. The metric is the most complex of the three: it accumulates as users interact with the page, with calculation capped at a five-second session window from initial load or keyboard/click interaction. This penalizes content that shifts in late—common with overlays, popups, and ads that resize when they load.
The Chrome DevTools Web Vitals overlay lets developers see shifts in real time, and the Chrome Web Vitals extension's console logging mode provides more useful detail: it shows LCP, FID, and CLS scores for the current page while identifying exactly which elements relate to those scores. For CLS, the extension makes it easy to watch scores accumulate while scrolling. When testing locally, CPU and network throttling are essential to get numbers that approximate real user conditions.

The team tracked field progress over several deploys using Google's web-vitals module hooked into Google Analytics. That gave them a rough p75 picture, but the summary data left them stuck. Their CLS hovered around 0.23, and they needed to get below 0.1. Google's tools were excellent at reporting that there was a problem but didn't say which components on which pages were responsible.
Neither the Chrome extension logging nor the third-party analytics aggregators preserved the crucial detail: the specific DOM element causing each layout shift. The team needed the field data their real users were generating, not just the aggregate scores.
Building Their Own Vitals Pipeline
To capture the missing data, Instant Domain Search built a serverless function that collects Web Vitals data from browsers and streams it into Google BigQuery via the streaming API. The architecture keeps costs low—streaming ingestion needs no real-time query capability—so they can collect as many data points as they need. The team packaged the client and server libraries and released the project as open source at vitals.dev.
With data flowing into BigQuery, the team could query exactly which elements on which pages contributed most to CLS. The results pointed to their footer as a major offender. Layout shift score is calculated from an element's size multiplied by the distance it moves. On the search results view, a device taking more than 500ms to load results over a slow connection would cause the results area to collapse to zero-height, pulling the footer up the page. When the results finally arrived, they pushed the footer back down—a large element moving a long distance, adding significantly to CLS. While the proper fix requires restructuring how search results are collected and rendered, the team applied a quick solution: removing the footer from the search results view entirely to stop it from bouncing on slow connections.
SELECT
  `<project_name>.web_vitals.CLS`.Value,
  Node
FROM
  `<project_name>.web_vitals.CLS`
JOIN
  UNNEST(Entries) AS Entry
JOIN
  UNNEST(Entry.Sources)
WHERE
  Node != ""
ORDER BY
  value
LIMIT
  10
Those report-style queries became a team punch list. Reviewing them regularly shows whether alterations to the site improve or regress the field metrics. New features and products now receive the same scrutiny during development, so performance monitoring happens before problems hit production, not after.
The project is now open source. Instant Vitals provides a drop-in mechanism for any Next.js or similar front end to collect Web Vitals field data in BigQuery, complete with the schema creation and streaming handled by the server library. The project's GitHub repo has the client and server integrations:
import { init } from "@instantdomain/vitals-client";

init({ endpoint: "/api/web-vitals" });
Sending a metric to BigQuery requires one call to the provided library function, and the library handles dataset and table creation automatically.
import fs from "fs";

import { init, streamVitals } from "@instantdomain/vitals-server";

// Google libraries require service key as path to file
const GOOGLE_SERVICE_KEY = process.env.GOOGLE_SERVICE_KEY;
process.env.GOOGLE_APPLICATION_CREDENTIALS = "/tmp/goog_creds";
fs.writeFileSync(
  process.env.GOOGLE_APPLICATION_CREDENTIALS,
  GOOGLE_SERVICE_KEY
);

const DATASET_ID = "web_vitals";
init({ datasetId: DATASET_ID }).then().catch(console.error);

// Request handler
export default async (req, res) => {
  const body = JSON.parse(req.body);
  await streamVitals(body, body.name);
  res.status(200).end();
};
The Web Vitals tooling Google builds into Chrome remains strong for identifying broad technical issues, but field data told the story lab tests couldn't see. Collecting their own data at scale, with XPath detail, exposed specific problems the p75 aggregate never pointed at directly—and gave the team a trajectory to keep scores trending down.