

Making Performance Regressions Visible
Performance degradation often creeps in through small, incremental changes—a new feature, a package update, a slightly more complex code path. Optimizing an application once isn’t enough; without ongoing vigilance, it will regress. The key is to make performance changes visible, ideally at the point where code is reviewed and merged. This article demonstrates how to surface performance metrics directly in GitLab merge requests using CI pipelines.
Choosing Meaningful Metrics
Before you can monitor performance, you need to define what “performant” means for your project. Metrics are context-dependent, so the right choices depend on what you’re building.
For an npm package, the size in kilobytes is a practical metric. Consumers of your library will care about the impact your code has on their final bundle size.
For a website, consider these options:
- Time To First Byte (TTFB): Measures how quickly the server responds. It’s useful but vague, as it includes everything from server rendering time to network latency. Pair it with Server Timing or OpenTracing to understand what contributes to it.
- Time to Interactive (TTI) and First Meaningful Paint: Both are valuable from a perceived performance standpoint. Note that First Meaningful Paint is being replaced by Largest Contentful Paint (LCP).
Don’t take these suggestions as universal truths—think about what matters in your specific case.
Setting Target Values
A straightforward way to set performance goals is to benchmark against competitors. If you had to outrun a bear, you wouldn’t need to be an Olympic sprinter—just faster than the other person. The same logic applies to performance.
- List your main competitors and identify the common page types (e.g., product list, product details, cart, checkout for an e-commerce site).
- Measure your chosen metrics on each page type for both your competitors and your own site.
- Find the closest competitor value that is better than yours for each metric, add 20%, and set that as your goal.
The 20% margin is a rough rule of thumb—it’s generally considered a noticeable difference to the human eye, as discussed in the article on perceived performance and the “20% rule.”
Competing With Yourself
If your project is unique or you’re already ahead of the competition, use your own past performance as a baseline. Measure each metric on each page type and aim to improve those values by the same 20% margin.
Tracking Bundle Size With CI Artifacts
For synthetic performance testing, the two options are controlled environment tests or Real User Measurements (RUM) from production traffic. This walkthrough focuses on synthetic checks using GitLab CI.
Setting A Size Budget
When shipping a library to NPM, bundle weight still matters — smaller packages reduce data costs for clients and speed up page loads. To keep index.js within budget, use Size Limit by Andrey Sitnik from Evil Martians.
Install it and register the check:
npm i -D size-limit @size-limit/preset-small-lib
The configuration block lists each file you want measured. For a single file, add it to package.json:
"scripts": {
+ "size": "size-limit",
  "test": "jest && eslint ."
},
+ "size-limit": [
+   {
+     "path": "index.js"
+   }
+ ],
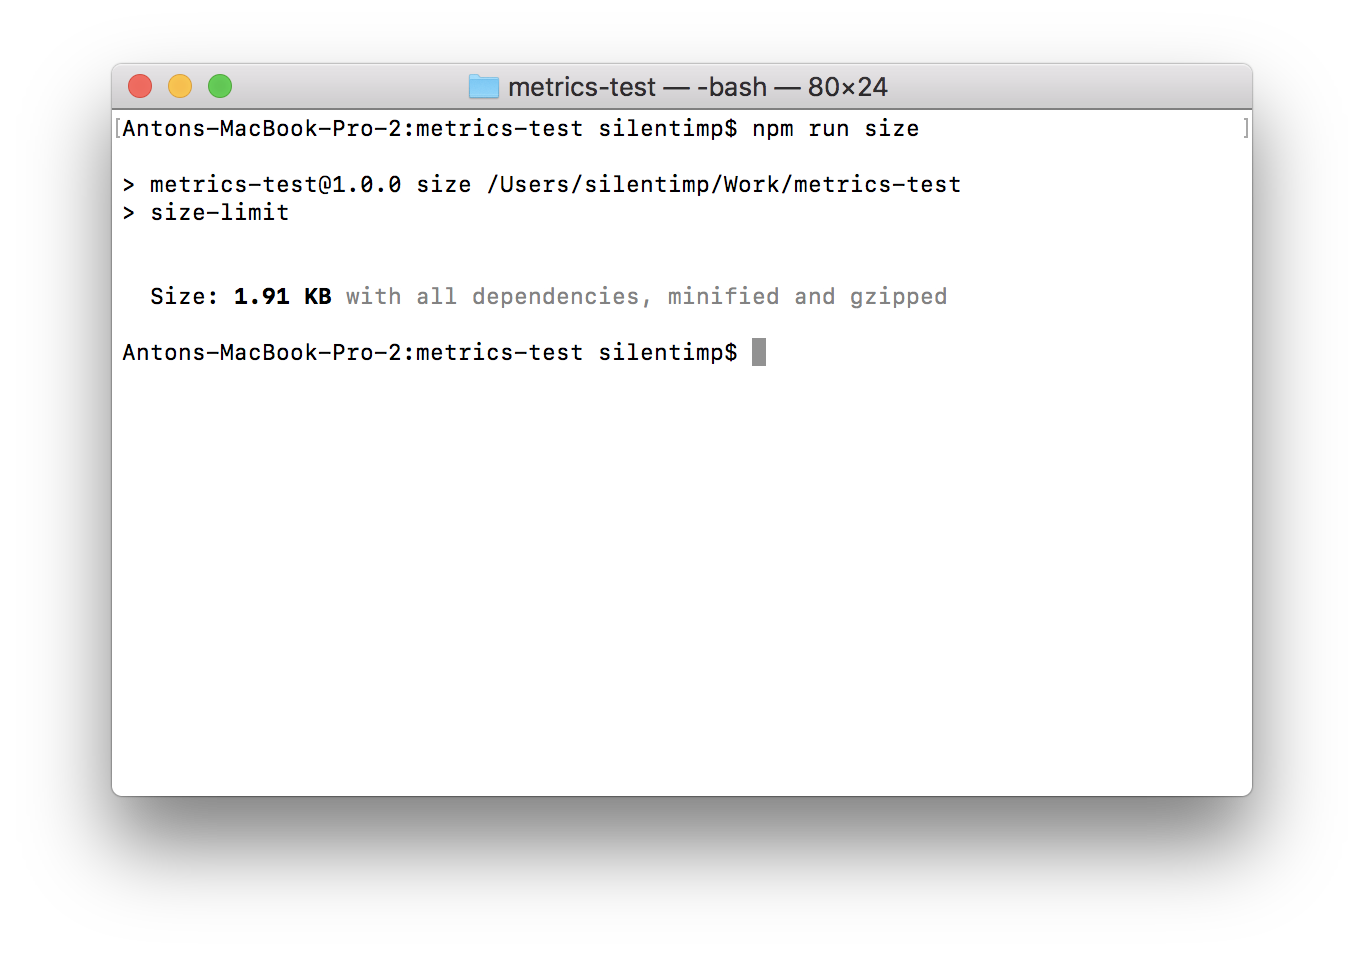
Running the size script reports the current file size:
npm run size
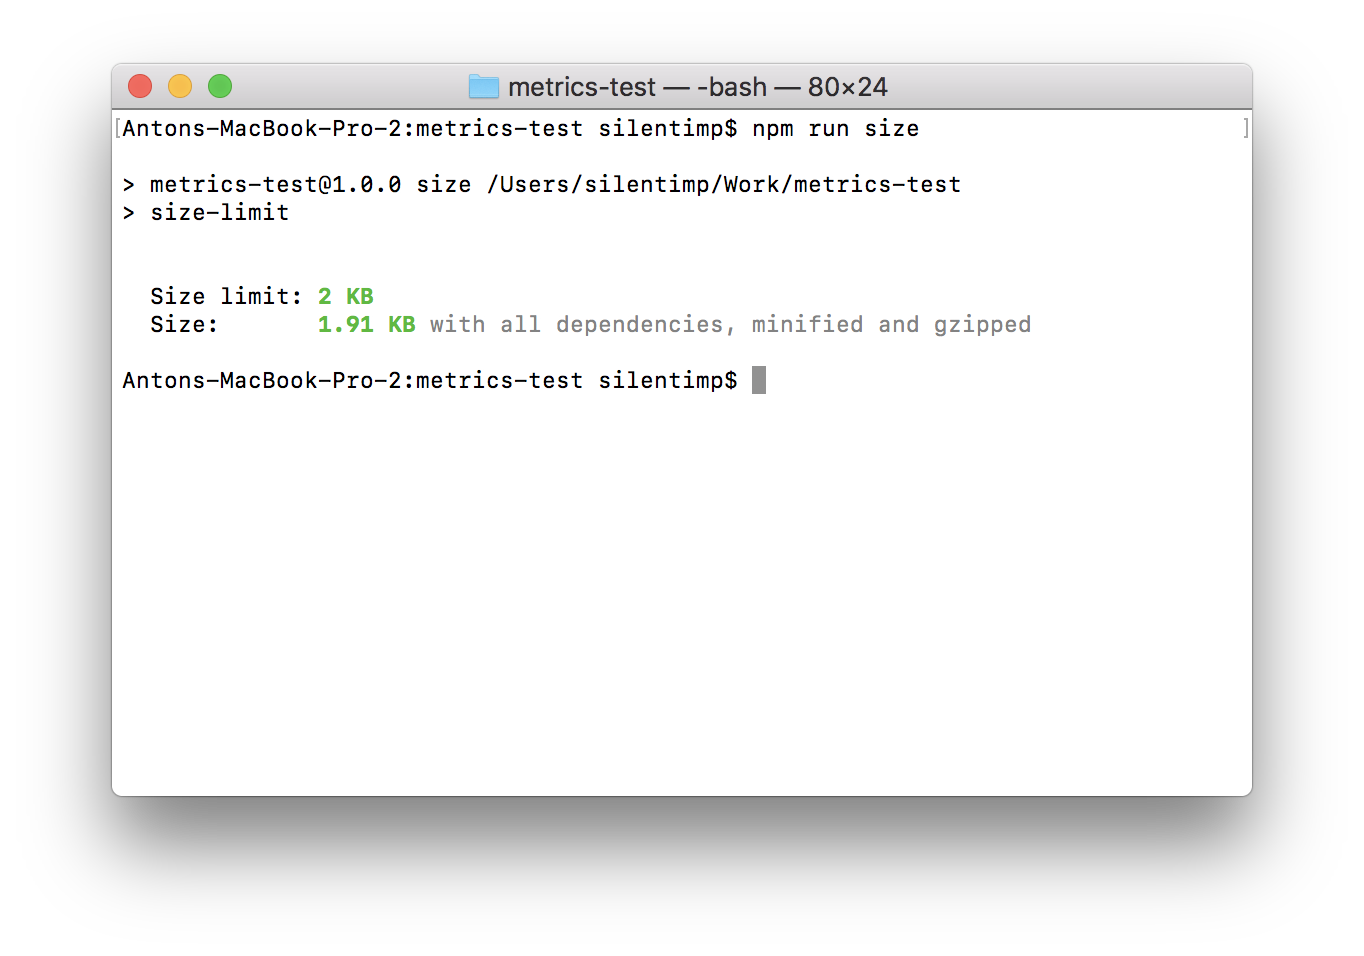
To enforce a ceiling, define a limit in the Size Limit block:
"size-limit": [
  {
+   "limit": "2 KB",
    "path": "index.js"
  }
],
If the file exceeds that limit, the check exits with a non-zero code, which fails the GitLab pipeline.
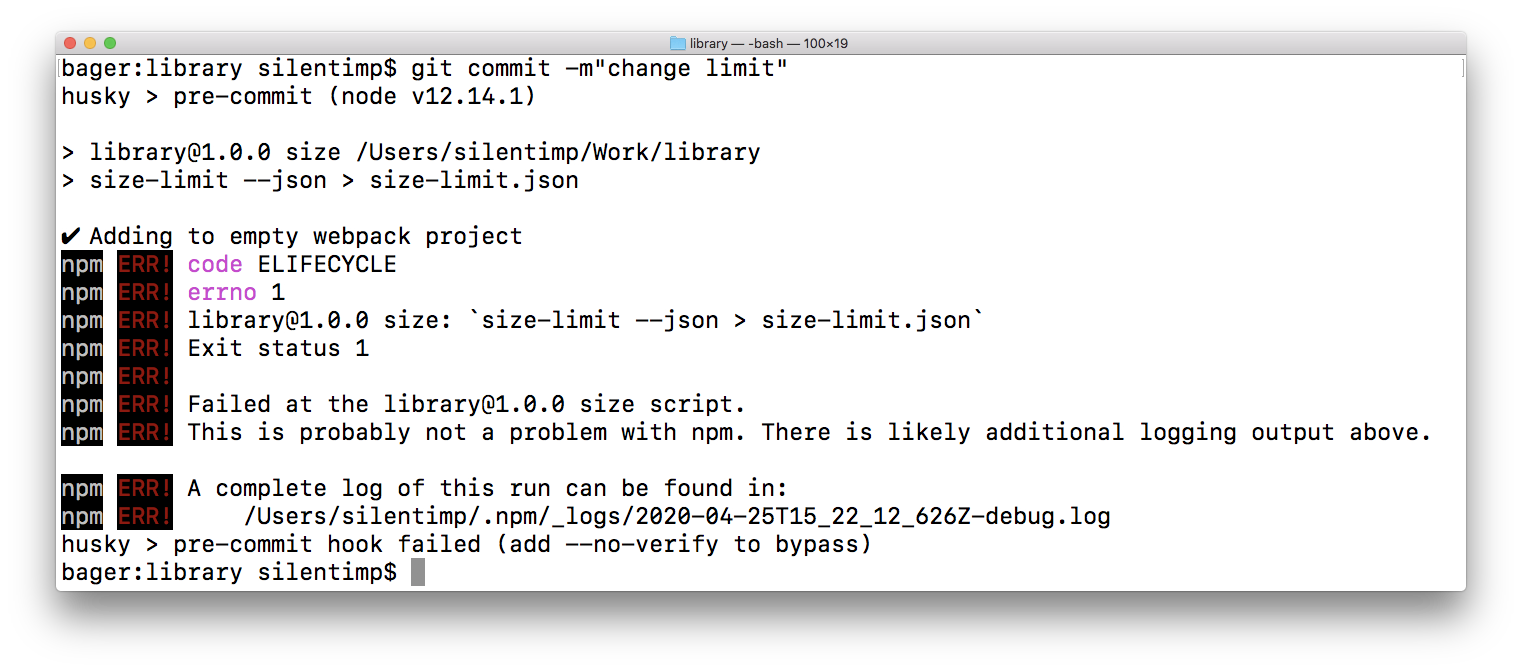
To catch inflation early, wire the check into a git hook via husky. First install it:
npm i -D husky
Then give it a precommit command:
"size-limit": [
  {
    "limit": "2 KB",
    "path": "index.js"
  }
],
+  "husky": {
+    "hooks": {
+      "pre-commit": "npm run size"
+    }
+  },
Now every commit will fail if the limit is exceeded:
Pre-commit hooks are easy to bypass, so don't treat them as the final gate. Also, keep it non-blocking in CI — some growth is expected during feature work. What you want is to surface size changes in merge requests, giving reviewers context before approving a dependency that might introduce unnecessary bloat. To find alternatives, Bundlephobia is useful.
To expose changes in a merge request, GitLab artifacts of the metrics type are the tool. These files persist after a pipeline run and render as a widget comparing the metric value on master versus the feature branch. The artifact needs the Prometheus text format, but for GitLab the value is just free text.
This requires two things:
- Declare the artifact in the pipeline.
- Modify the script to produce the artifact when run.
Update .gitlab-ci.yml:
image: node:latest

stages:
  - performance

sizecheck:
  stage: performance
  before_script:
    - npm ci
  script:
    - npm run size
+  artifacts:
+    expire_in: 7 days
+    paths:
+      - metric.txt
+    reports:
+      metrics: metric.txt
The essentials here:
expire_in: 7 dayskeeps the file available for a week.paths: metric.txt
Saving it in the root directory is mandatory for the download to work.reports: metrics: metric.txt
This assigns thereports:metricstype so the widget appears.
Make Size Limit generate the input JSON by changing package.json:
"scripts": {
-  "size": "size-limit",
+  "size": "size-limit --json > size-limit.json",
  "test": "jest && eslint ."
},
The --json flag outputs structured data;
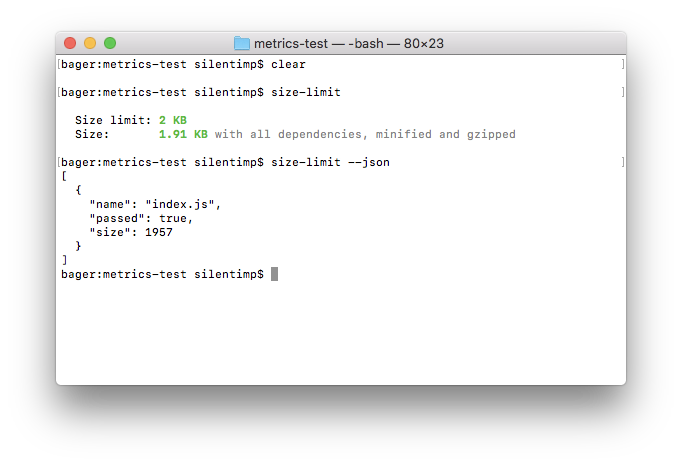
size-limit --json output JSON to console. JSON contains an array of objects which contain a file name and size, as well as lets us know if it exceeds the size limit. (Large preview)Redirecting that output to size-limit.json stores it on disk. The artifact format is [metric name] [metric value], so create a generate-metric.js script:
const report = require('./size-limit.json');
process.stdout.write(`size ${(report[0].size/1024).toFixed(1)}Kb`);
process.exit(0);
Register it as a postsize script:
"scripts": {
  "size": "size-limit --json > size-limit.json",
+  "postsize": "node generate-metric.js > metric.txt",
  "test": "jest && eslint ."
},
Using the post prefix means npm run size runs the main script first, then automatically triggers postsize, which creates the metric.txt artifact file. After merging this setup to master, any subsequent merge request on a feature branch will show the size delta in the widget — the value on the branch and (in parentheses) the master value.
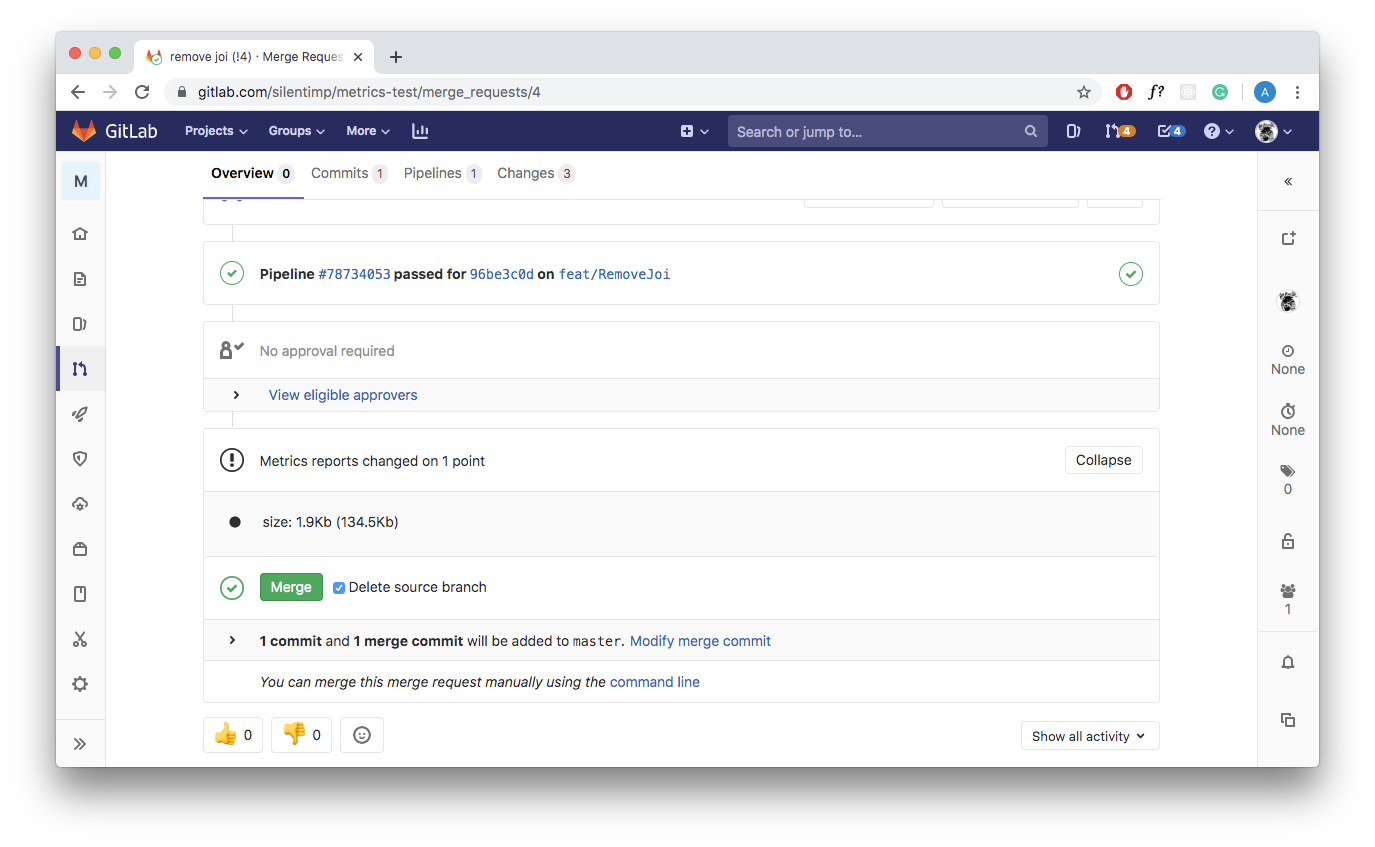
That visibility alone often settles whether a package addition is worth its weight.
- All code is available in this repository.
Measuring Page Quality With Lighthouse
For full page-level oversight, Lighthouse has become the standard for performance, accessibility, best practices, and SEO scoring. Use lighthouse for auditing, and puppeteer as the headless browser. Install both:
npm i -D lighthouse puppeteer
In a new lighthouse.js file, start the browser, then define an audit function:
const puppeteer = require('puppeteer');

(async () => {
  const browser = await puppeteer.launch({
    args: ['--no-sandbox', '--disable-setuid-sandbox', '--headless'],
  });
})();
const lighthouse = require('lighthouse');
const DOMAIN = process.env.DOMAIN;

const buildReport = browser => async url => {
  const data = await lighthouse(
    `${DOMAIN}${url}`,
    {
      port: new URL(browser.wsEndpoint()).port,
      output: 'json',
    },
    {
      extends: 'lighthouse:full',
    }
  );
  const { report: reportJSON } = data;
  const report = JSON.parse(reportJSON);
  // …
}
That function accepts the browser object and returns another function which takes a URL, runs a Lighthouse audit against it, and returns the report. The arguments passed to lighthouse are:
- The URL to audit.
- Options such as the browser
portand the reportoutputformat. - Config describing the categories — here,
lighthouse:full. For finer control see the configuration documentation.
At this point the result can be treated as a gate:
if (report.categories.performance.score < 0.8) process.exit(1);
If any metric falls below a threshold, the check exits with a non-zero code and blocks the pipeline. But for visibility only, choose the GitLab performance artifact instead.
GitLab Performance Artifact Format
GitLab's own docs are quiet on the schema; the easiest route is reading the sitespeed.io plugin source. The artifact is a JSON file that is an array of page report objects:
[
  {
    "subject":"/",
    "metrics":[
      {
        "name":"Transfer Size (KB)",
        "value":"19.5",
        "desiredSize":"smaller"
      },
      {
        "name":"Total Score",
        "value":92,
        "desiredSize":"larger"
      },
      {…}
    ]
    },
  {…}
]
Each page object has:
subject— an identifier for the page, aptly chosen as a pathname.metrics— array of individual measurement objects.
{
  "subject":"/login/",
  "metrics":[{measurement 1}, {measurement 2}, {measurement 3}, …]
}
Each measurement has:
name— for example,Time to first byteorTime to interactive.value— numeric result.desiredSize— eithersmallerif lower is better (like rendering time), orlargerwhen higher wins (like a Lighthouse score).
Refactor the buildReport function to emit this object for a page:
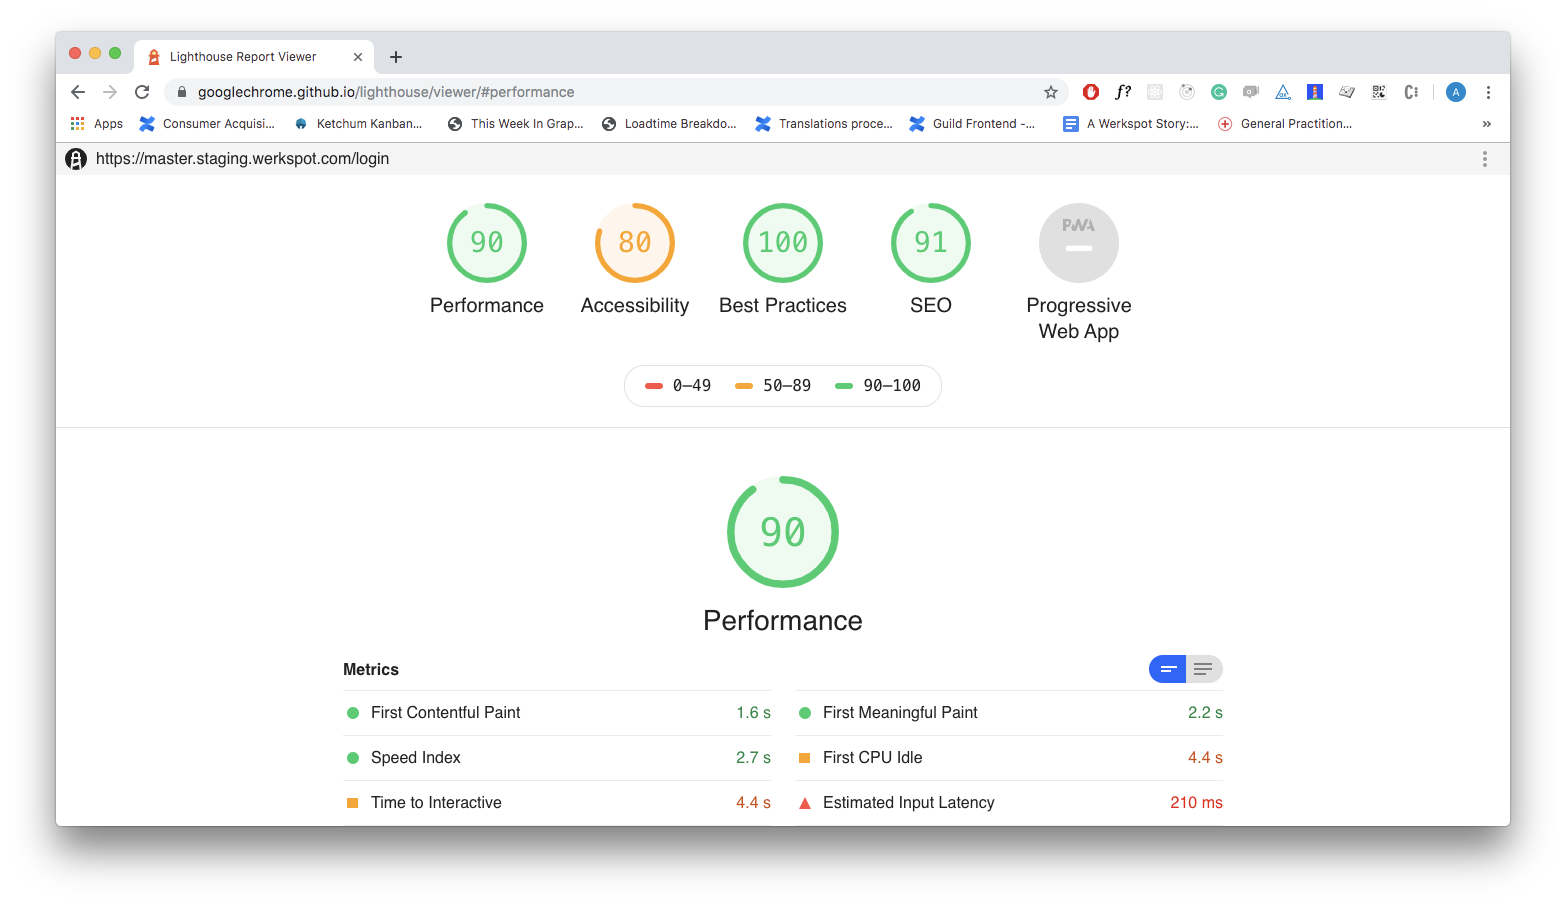
const buildReport = browser => async url => {
  // …

  const metrics = [
    {
      name: report.categories.performance.title,
      value: report.categories.performance.score,
      desiredSize: 'larger',
    },
    {
      name: report.categories.accessibility.title,
      value: report.categories.accessibility.score,
      desiredSize: 'larger',
    },
    {
      name: report.categories['best-practices'].title,
      value: report.categories['best-practices'].score,
      desiredSize: 'larger',
    },
    {
      name: report.categories.seo.title,
      value: report.categories.seo.score,
      desiredSize: 'larger',
    },
    {
      name: report.categories.pwa.title,
      value: report.categories.pwa.score,
      desiredSize: 'larger',
    },
  ];
  return {
    subject: url,
    metrics: metrics,
  };
}
The domain to test is read from process.env.DOMAIN, which should point at an existing staging environment deployed from the feature branch before running the audit.
+ const fs = require('fs');
const lighthouse = require('lighthouse');
const puppeteer = require('puppeteer');
const DOMAIN = process.env.DOMAIN;
const buildReport = browser => async url => {/* … */};

+ const urls = [
+   '/inloggen',
+   '/wachtwoord-herstellen-otp',
+   '/lp/service',
+   '/send-request-to/ww-tammer',
+   '/post-service-request/binnenschilderwerk',
+ ];

(async () => {
  const browser = await puppeteer.launch({
    args: ['--no-sandbox', '--disable-setuid-sandbox', '--headless'],
  });
+   const builder = buildReport(browser);
+   const report = [];
+   for (let url of urls) {
+     const metrics = await builder(url);
+     report.push(metrics);
+   }
+   fs.writeFileSync(`./performance.json`, JSON.stringify(report));
+   await browser.close();
})();
- See the full script in this gist or the working example in this repository.
Note: Do not run multiple Lighthouse instances concurrently, e.g., by overusing Promise.all. Concurrent audits distort their measurements and the tooling is known to throw exceptions in that scenario.
Scaling Measurements With Processes
Parallel measurement is possible with Node.js cluster or Worker Threads, but only makes sense when your CI runner has multiple available cores. Each forked process spawns a full Node.js instance rather than sharing one, which increases RAM consumption. The trade-off is higher hardware costs for only modest speed gains, so this approach is often not worth the complexity.
If you proceed, the steps are:
- Split the URL list into chunks matching the core count.
- Fork a process per core.
- Send each chunk to a fork and collect the generated reports.
Array splitting can be done with a simple utility function, and forks are created per core accordingly. After transferring chunks to the child processes and retrieving the reports, reassemble them into a single array to generate the final artifact.
- See the full code and the example repository for multi-process Lighthouse runs.
Improving Measurement Accuracy
Parallelization increases the already significant measurement error of lighthouse. To compensate, perform multiple runs and average the results. A small function can compute the running average between the current measurement and the accumulated previous results, and the main measurement logic is updated to use it.
- Refer to the averaging gist and the Lighthouse average example repository.
Integrating The Pipeline
Create a .gitlab-ci.yml configuration file to add the check. Several packages are required for puppeteer; a Docker-based setup is an alternative. Set the artifact type to performance in the configuration. Once both the master and feature branches produce such artifacts, the merge request view will show a comparison widget.
A Fair Warning On Licensing
Support for metrics and performance report artifacts is only available in paid GitLab plans starting at premium (previously silver), at $19 per user per month. Specific features cannot be purchased individually; you must change the entire plan. Unlike GitHub's Checks API and Status API, GitLab does not allow creating your own widgets inside a merge request, and no immediate change is expected.
To verify feature support, inspect the GITLAB_FEATURES environment variable inside a pipeline job. If the list lacks merge_request_performance_metrics and metrics_reports, those report types are unavailable. In that case, the artifacts are still generated, but the UI widget will always display the misleading message “metrics are unchanged”.
As a workaround, post a comment containing a table of metrics to each merge request. The workflow is:
- Read the artifact from the
masterbranch. - Format a comparison table in
markdown. - Locate the merge request associated with the current feature branch.
- Add the comment to that merge request.
Fetching The Master Artifact
To compare performance against the target branch, fetch the existing artifact from master using the GitLab Jobs API and fetch within the pipeline script.
Generating The Comment
Build the markdown table with helper functions. You will need a GitLab API token — generate it via the user settings under Access Tokens — and your project ID, available under the repository Settings → General.
Determine the merge request ID by querying the single MR endpoint. The current feature branch name is available in the pipeline as the CI_COMMIT_REF_SLUG environment variable; outside of CI, a current-git-branch package works. Install the necessary packages, assemble the message body, and post it via the comments on merge requests API.
- See the commenting script gist and the demo repository for a working example.
Comments are less prominent than native widget data, but they are a reliable way to surface performance trends even without the paid report feature support.
Handling Authenticated Pages
Performance testing pages behind a login is straightforward — use puppeteer scripts to perform the authentication before running the Lighthouse audit. A script that fills in the credentials and submits the form runs prior to the measurement, and no further customization is needed.
Summary
This approach forms a practical performance monitoring system that makes regression visible during code review. With the artifact pipeline and merge request feedback in place, you can then extend it by storing historical data for longer-term trend analysis or by capturing real user performance metrics.



