

Why log rendering is harder than it looks
Rendering logs in a web UI appears straightforward: they're lines of plain text. But supporting color, grouping, search, and permalinks adds complexity, and the interface has to hold up whether a log has ten lines or tens of thousands. When GitHub Actions went GA in 2019, there were no usage metrics yet, but it was clear that very large log lines would have to be handled properly — otherwise the browser could freeze on initial load or become unusable.
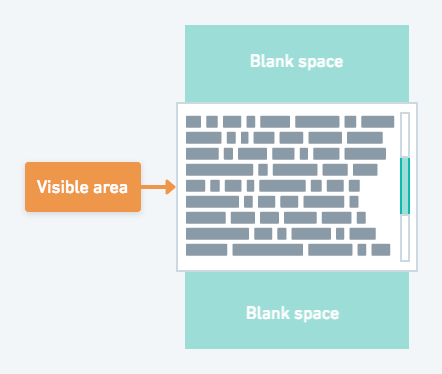
The solution was virtualization: rendering only the subset of items visible in the viewport and updating that subset on scroll, while calculating layout positions for content that isn't rendered to keep scrolling smooth.
Lessons from the first attempt
GitHub tested both React-based and vanilla JavaScript virtualization libraries at launch. Many of those libraries required fixed-height items, which simplifies internal math: scroll position becomes item_index * items_height and total scrollable height is items_count * items_height. But GitHub needed to wrap long log lines, which meant variable-height items were mandatory.
The vanilla JavaScript library chosen had most of the required features — variable element heights and scroll-to-item support — but several limitations surfaced during real use:
- The scrollable area needed a fixed height, which hurt UX because each job step had its own virtualized list, resulting in multiple independent scroll regions plus the page scrollbar.
- Poorly tested handling of switching list visibility caused bugs when steps auto-expanded while the browser tab was backgrounded; logs sometimes appeared broken when the user returned to the tab.
- Text selection broke during scrolling because virtualized elements were removed from the DOM mid-selection.
- Performance suffered because log lines had to be rendered in the background to measure their height; inaccurate calculations caused cut-off lines, so lines were sometimes rendered twice instead of not at all.
Rethinking based on usage data
With real usage metrics available, GitHub could revisit the original assumptions. Their data showed 99.51% of existing jobs had fewer than 50k log lines, but browsers begin to struggle past 20k lines. Memory was also a concern — even a small line count could consume significant memory if lines were long.
This led to two decisions. Data virtualization — loading log content incrementally as the user scrolls — was unnecessary complexity. UI virtualization, however, remained essential. For the edge case of a large file with few lines, logs are truncated with a downloadable link provided instead.
Building a custom virtualization library
No existing library met all the requirements, so GitHub implementing one from scratch. The goals were:
- Render at least 50k log lines, ideally on mobile too.
- Support unrestricted text selection.
- Keep the UI/UX smooth for search jumps, permalinks, and streaming logs.
- Provide a single scrollable area without fixed height.
- Support sticky step headers.
- Keep computations fast and memory usage low, accepting approximations over precise measurements.
Two design choices distinguished the custom approach from typical virtualization libraries:
- Estimated heights before rendering: instead of relying on precise height calculations or fixed dimensions with absolute positioning, heights are estimated beforehand. Relative positioning is used so lines aren't cut off if estimates drift.
- DOM architecture: the scrollable container includes both sticky headers and virtualized lines, but sticky headers are excluded from virtualization to remain fixed.
A quick prototype validated the strategy. Large log tests confirmed the approach could meet all goals, but also revealed how easily the experience could degrade. Rendering few DOM nodes wasn't enough — minimizing DOM mutations while scrolling was equally critical. As users scroll quickly, especially on mobile, nodes must be added when they appear and removed when the leave the viewport; too many mutations causes a sluggish experience.
Throttling and batching updates didn't work well, making the UI less responsive. The winning approach was grouping log lines into clusters: rather than adding and removing individual nodes on each scroll, entire clusters of 50 lines are added or removed at once.
Ship and iterate
Within roughly a week, the initial implementation was usable enough to confirm the UX benefits. Subsequent weeks were spent handling the long tail of edge cases and other UI/UX refinements. Once shipped, the new logs experience proved faster, smoother, and more robust. Reinventing the wheel isn't usually necessary — but in this case, controlling the experience and performance end-to-end justified a custom implementation.



