
Finding the bottleneck
When a server is overloaded, the first step is identifying which resource is being exhausted. The four primary candidates are CPU, network, memory, and disk I/O, and each requires a different remedy.
- CPU: Consistently high CPU usage (above 80%) typically degrades performance noticeably. Serving individual requests is cheap, but at spike scale it can overwhelm the processor. Mitigations include offloading work to other infrastructure, reducing expensive operations, and limiting request volume.
- Network: High traffic can exceed available throughput, and some hosting providers cap cumulative data transfer. Reducing the size and number of responses removes this constraint.
- Memory: Insufficient memory forces data to disk, which is far slower than RAM. Complete exhaustion leads to out-of-memory (OOM) errors. Fixing leaks, adjusting allocation, or upgrading memory resolves this.
- Disk I/O: Disk read/write speed is a hard limit. Caching more data in memory relieves pressure, and if that fails, faster disks may be necessary.
Most sites facing traffic spikes will find CPU or network to be the binding constraint. Start investigating with top on the affected server, supplemented by historical metrics from your hosting provider or monitoring tools if available.
Stabilize before optimizing
An overloaded server can trigger cascading failures elsewhere in the system. Stabilize it before making structural changes.
Rate limiting
Rate limiting caps incoming requests to protect infrastructure. This becomes more urgent as responses slow: users refresh aggressively, compounding the load. Rejecting a request is relatively cheap, but the best defense is to enforce limits upstream via a load balancer, reverse proxy, or CDN. Documentation is available for NGINX, HAProxy, and Microsoft IIS. For broader design guidance, see Rate-limiting Strategies & Techniques.
HTTP caching
Resources served from an HTTP cache (browser or CDN) never reach the origin server. Auditing and correcting Cache-Control, Expires, and ETag headers improves cache hit rates and reduces origin load. Service workers are a separate caching layer and should not be treated as a substitute for proper HTTP caching when handling an overload.
To diagnose, run Lighthouse and inspect the "Serve static assets with an efficient cache policy" audit. It lists resources with short or medium time-to-live (TTL) values. As a rule:
- Static resources: 1-year TTL.
- Dynamic resources: 3-hour TTL.
Set the Cache-Control header's max-age directive accordingly. Configuration guides exist for NGINX, Apache, and Microsoft IIS.
Graceful degradation
Temporarily reducing functionality sheds load with minimal disruption. Options include serving a static page instead of a full application, disabling search or returning fewer results, and turning off expensive non-essential features. Prioritize removals that are easy to reverse and have low business impact. This approach buys time for more substantial improvements while keeping the system responsive.
Offload Static Assets to a CDN
A content delivery network (CDN) takes over the job of serving static files from your origin server. CDNs maintain a large network of edge servers located close to end users, which speeds up delivery. Many CDNs also bundle additional performance features such as compression, load balancing, and media optimization.
Running your own CDN rarely makes sense because these networks benefit from massive scale. A basic setup is surprisingly quick — roughly 30 minutes — and primarily involves pointing your DNS records at the CDN provider.
To find resources that are not being served by a CDN, run WebPageTest and click the square above "Effective use of CDN" in the results. The list shows which resources should be offloaded but are not.
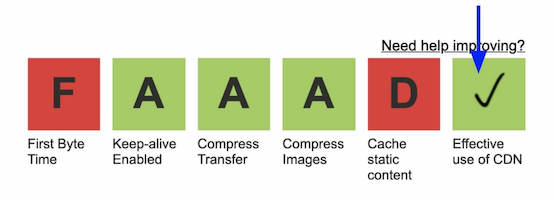
If a resource is not being cached by your CDN, verify these response headers:
Cache-Control: publicheader.- An expiration header:
Cache-Control: s-maxage,Cache-Control: max-age, orExpires. - A length header:
Content-Length,Content-Range, orTransfer-Encoding.
Scale Compute Resources Judiciously
Scaling compute should not be your first resort. Premature scaling introduces architectural complexity and financial cost that are hard to reverse, so diagnose the need carefully before adding servers.
A high Time To First Byte (TTFB) is a common early signal that a server is nearing capacity. Check the Lighthouse Reduce server response times (TTFB) audit for this metric. Then use a monitoring tool to evaluate CPU usage. If current or anticipated usage exceeds 80%, scaling becomes justified.
To scale horizontally, put a load balancer in front of a pool of servers. Cloud providers offer nat ive load balancers (GCP, AWS, Azure), or you can deploy HAProxy or NGINX yourself.
Cloud providers also offer autoscaling (GCP, AWS, Azure), which adjusts compute capacity in response to demand. Autoscaling depends on a working load balancer, but it is not a magic bullet: bringing new instances online takes time and the configuration overhead is significant. Start with a simple load-balancer setup before introducing autoscaling.
Compress Text Resources
Gzip or brotli compression on text-based assets can cut transfer size by roughly 70%. The Lighthouse Enable text compression audit identifies which resources are missing compression.
Turn on compression in your server config:
Optimize Images and Media
Images account for the bulk of file size on most sites (images.guide details the numbers). Fixing them yields fast, visible gains.
Lighthouse provides several audits pinpointing image problems:
- Properly size images
- Defer offscreen images
- Efficiently encode images
- Serve images in next-gen formats
- Use video formats for animated content
Alternatively, use Chrome DevTools to sort by image size: log network activity, click Img to filter out other resource types, and click the Size column to rank files by weight.
Quick pass:Find the largest images that load frequently and run them through a tool like Squoosh. Hero images are often the best candidates. Apply these rules of thumb:
- Size: Serve images no larger than the rendered dimensions require.
- Compression: Quality 80-85 yields a 30-40% file-size reduction with minimal visible loss.
- Format: Use JPEG for photos rather than PNG, and MP4 for animated content instead of GIF.
If images dominate your payload: consider an image CDN. These services are built specifically for optimizing and delivering images while relieving your origin server. Switching requires updating image URLs to point at the CDN but is otherwise straightforward. See Use image CDNs to optimize images and images.guide for details.
Minify JavaScript and CSS
Minification strips unnecessary characters from front-end code. The Minify CSS and Minify JavaScript audits tell you which files still need it.
If time is short, start with JavaScript — sites almost always carry more JS than CSS, making it the higher-impact target.
Monitor for the Long Term
Monitoring tools collect metrics, display dashboards and alert you when server performance degrades, helping to head off future outages. Resist the temptation to instrument everything: collecting and storing more data costs more, and over-alerting on noise cause alerts to be ignored.
Alert on metrics that robustly indicate real problems. Server response time (latency) works especially well — it captures a broad range of failures and maps directly to user experience. CPU-based alerts are a useful secondary signal but miss many issues. Always alert on tail latency (95th or 99th percentile), never on averages, which hide problems affecting only a subset of users.
Major cloud vendors include monitoring stacks (GCP, AWS, Azure). Netdata is a strong free and open-source alternative. Whichever tool you select, you will need to install its monitoring agent on each server and then configure alerting:



