
Lighthouse as a performance workflow
Lighthouse audits a page by loading it and recording how long it takes to reach key performance milestones, called metrics. It then produces a report with a score for each metric and a set of opportunities—specific changes that should make the page load faster if implemented. You cannot improve metric scores directly; instead, you work through the listed opportunities, which tend to move the scores in the right direction. Over time, you track those scores and ensure they don't regress.
You can run a Lighthouse audit from two main surfaces.
Run an audit from your profile
- Enter the URL you want to audit. Lighthouse runs a series of audits and produces a report for that page.
- Review the report to find where the page can be improved. Each audit includes guidance and concrete steps to act on.
Run an audit from Chrome DevTools
Chrome DevTools ships with Chrome, so there is nothing extra to install.
- Open the page you want to audit in Chrome.
- Press
Control+Shift+J(orCommand+Option+Jon Mac) to open DevTools.
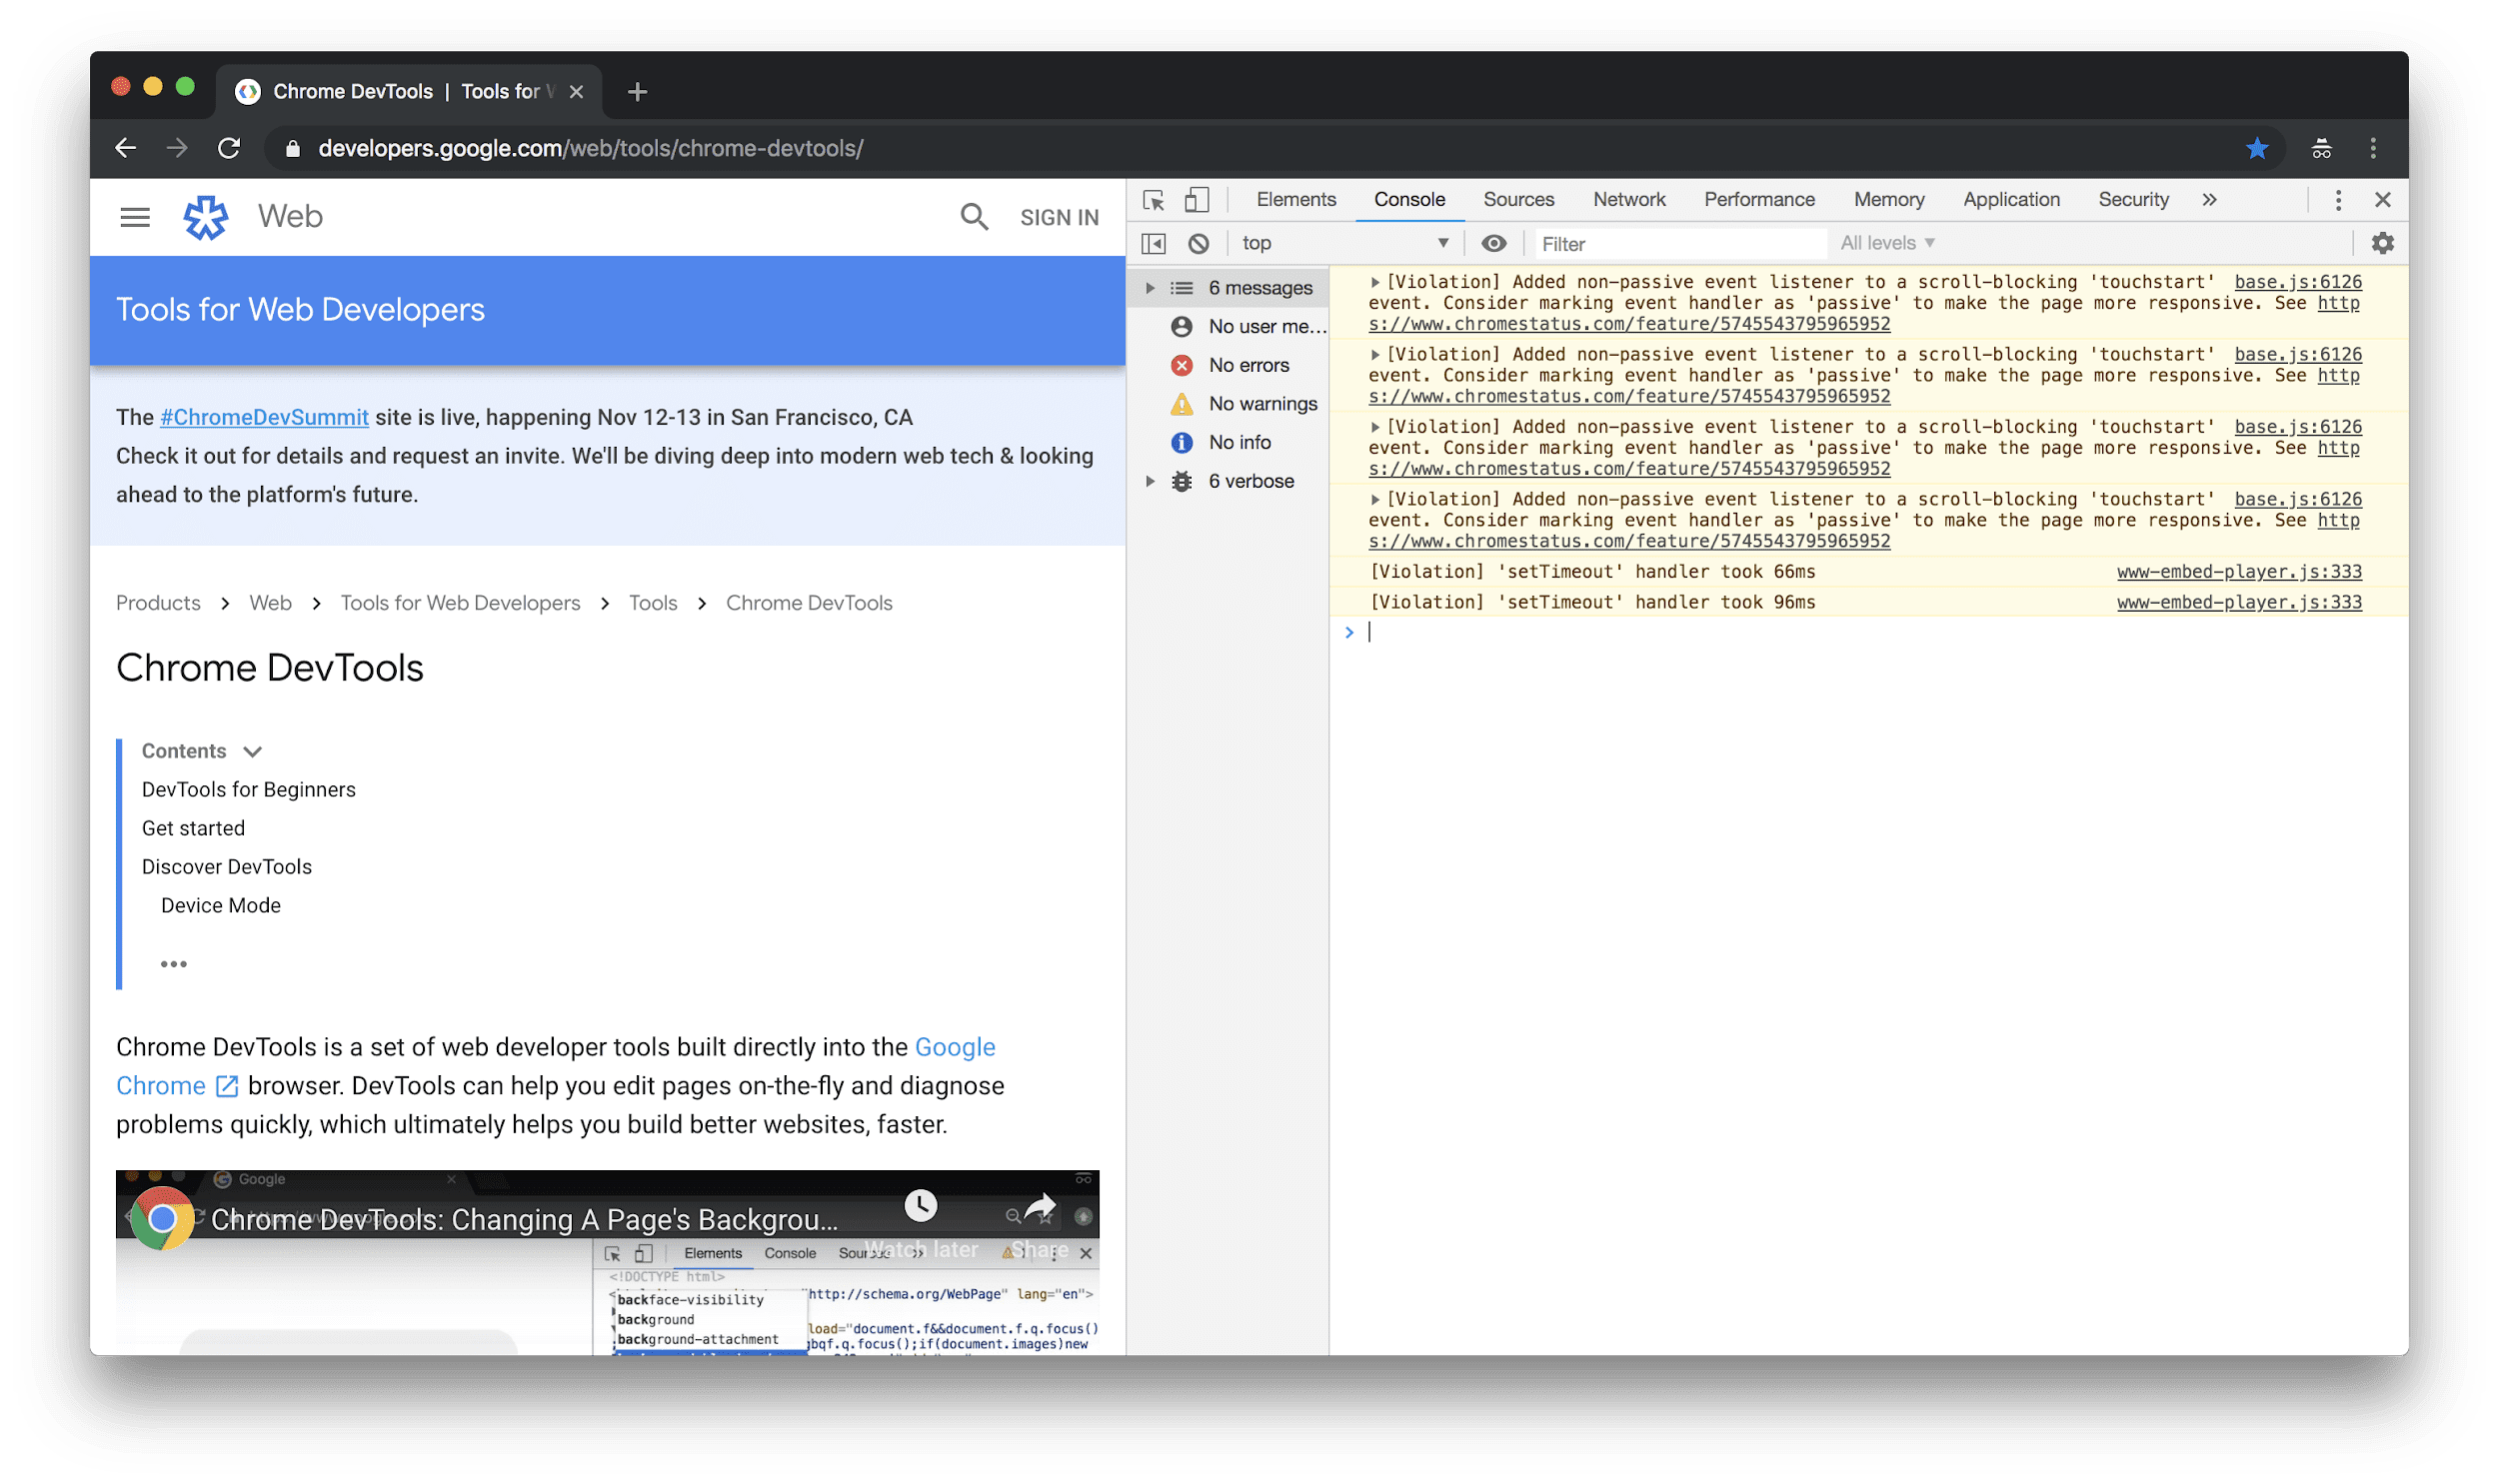
Open the Audits tab. If the tab is not visible, click the » symbol and choose Audits from the menu. The panel is powered by Lighthouse, which is why a lighthouse icon appears there.
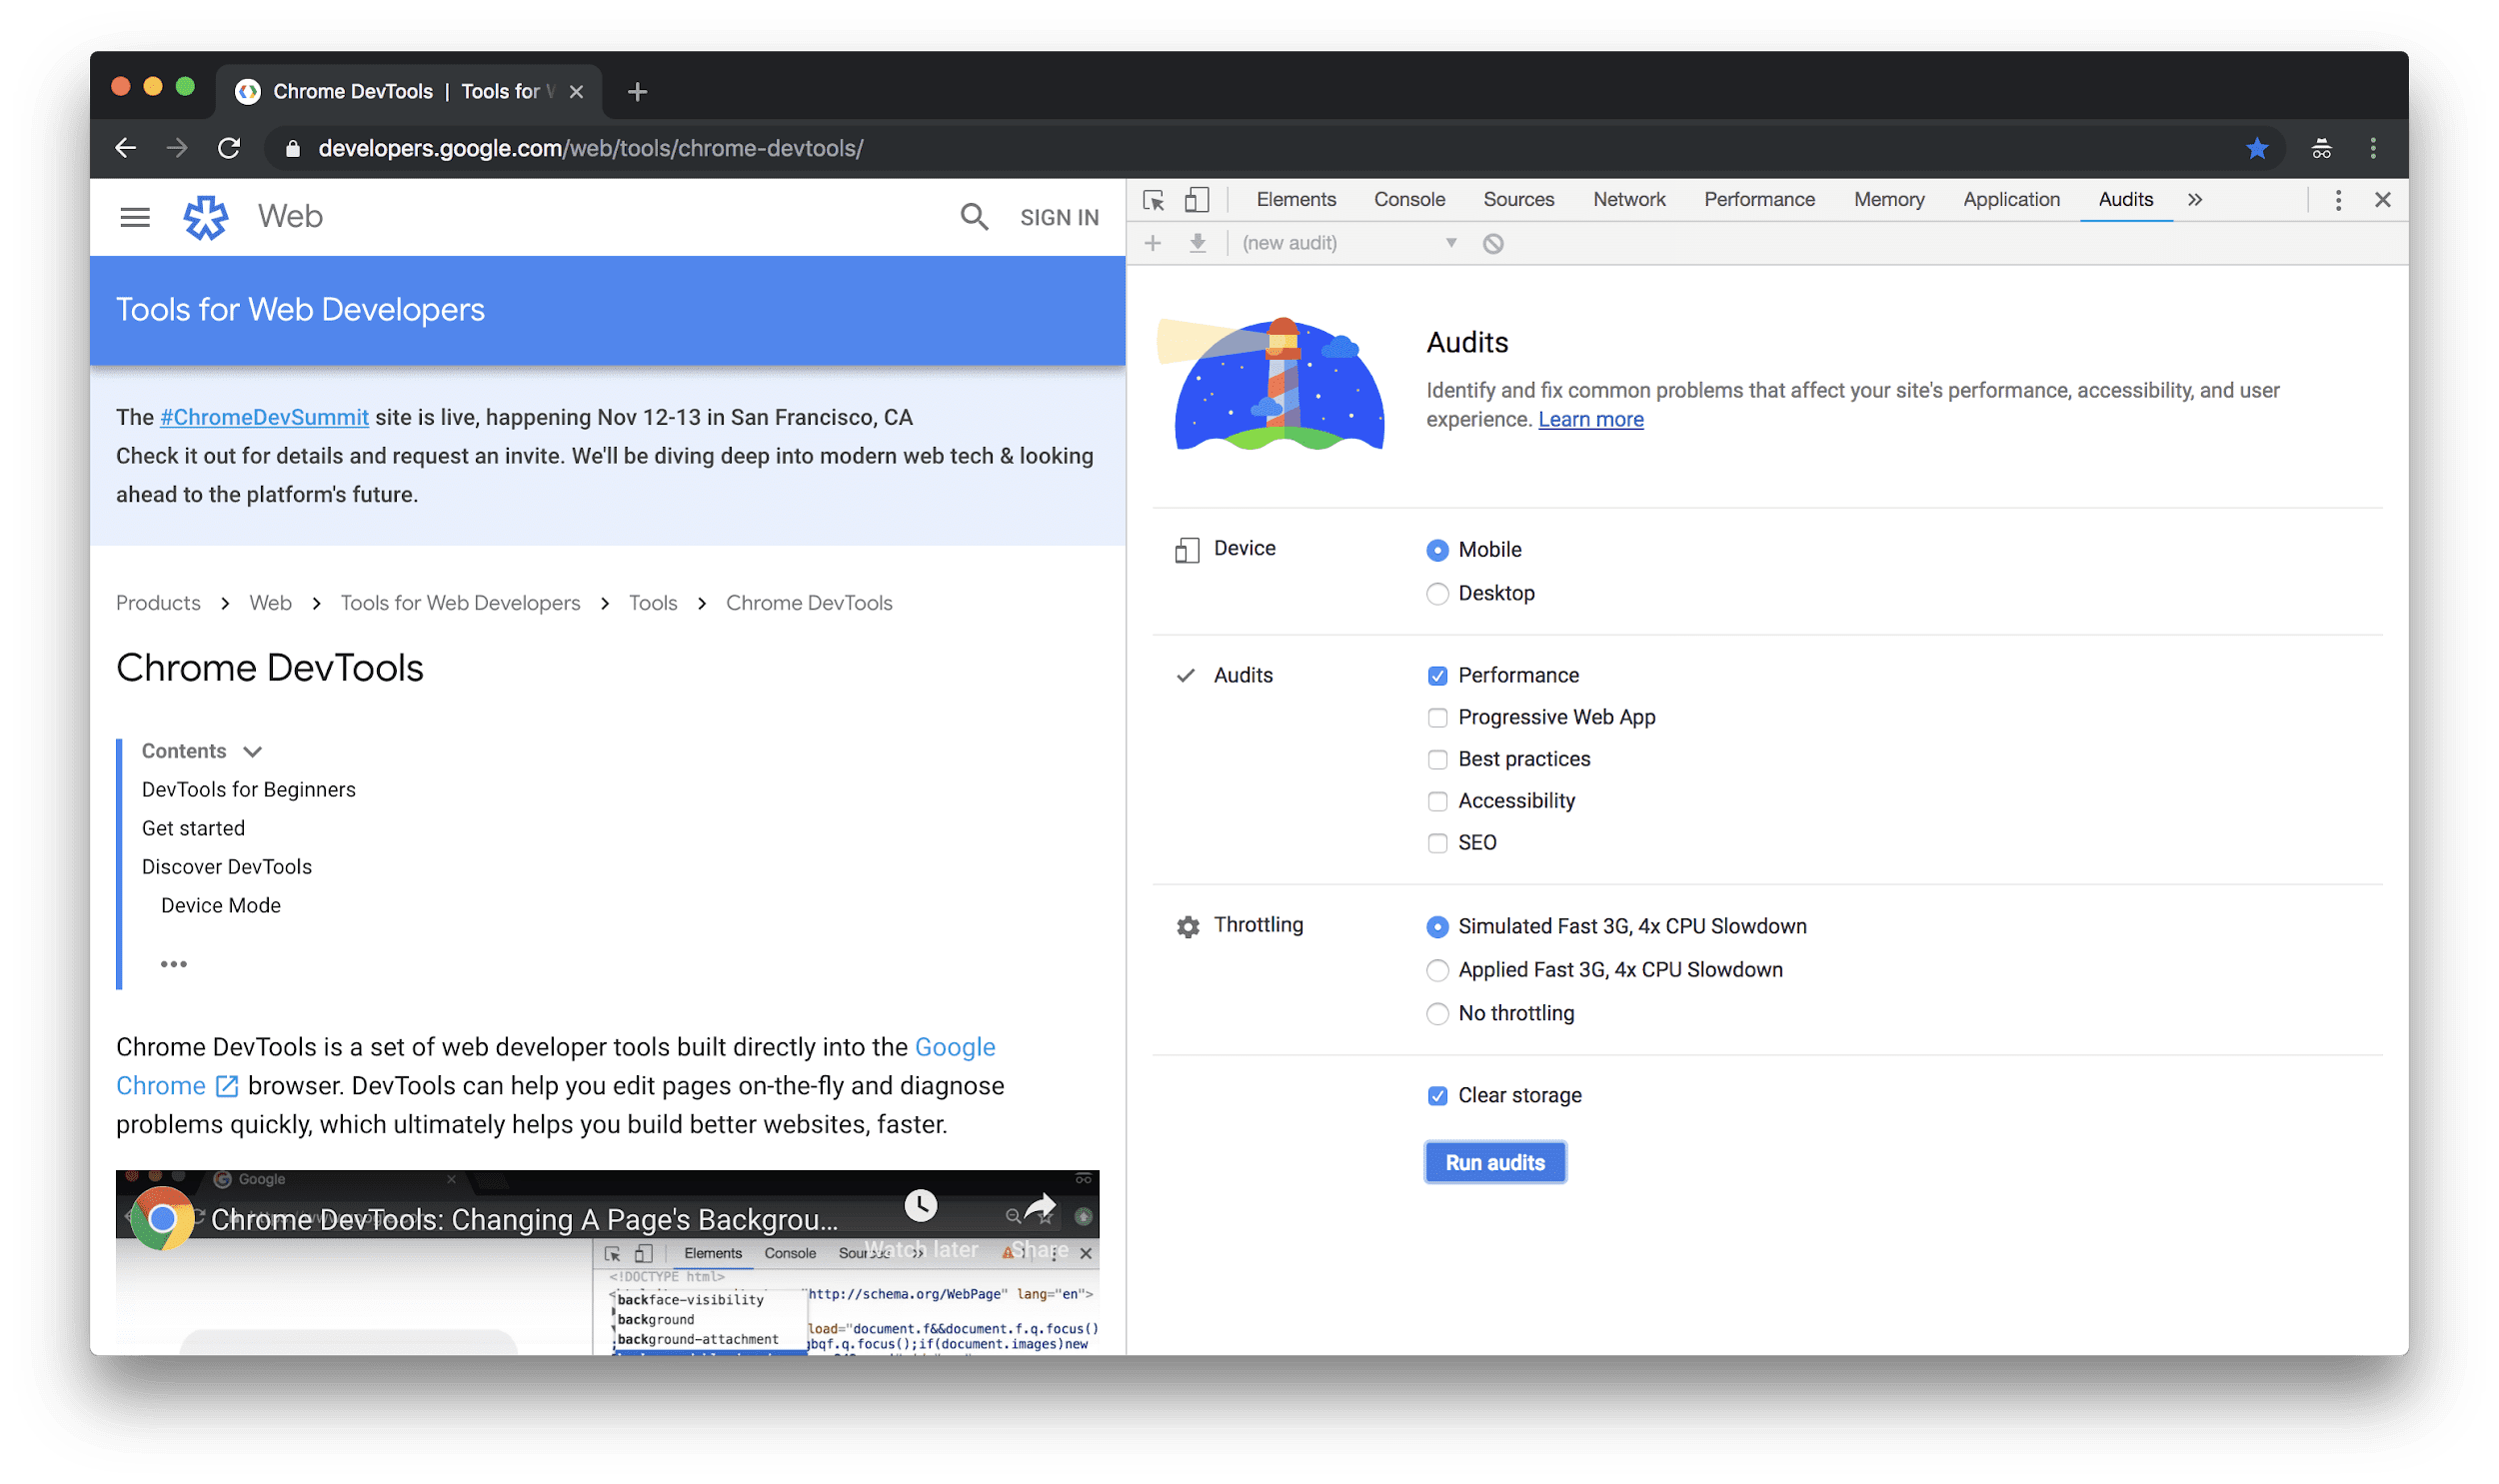
Configure the audit as follows:
- Leave Mobile selected. Lighthouse will emulate a mobile viewport and mobile user agent string during the audit.
- Make sure Performance is checked. Other audit categories are optional; enabling them adds opportunities for those areas to the report.
- Leave Simulated Fast 3G, 4x CPU Slowdown selected. Lighthouse does not actually throttle the network or CPU during the run. Instead, it measures the page under normal conditions and extrapolates what the load time would be on a fast 3G connection with a CPU about four times slower than the local machine.
- Keep Clear Storage enabled. That forces the page to fetch every resource from the network, which mimics the experience of a first-time visitor.
- Click Run Audits. A report appears after roughly 5 to 10 seconds.
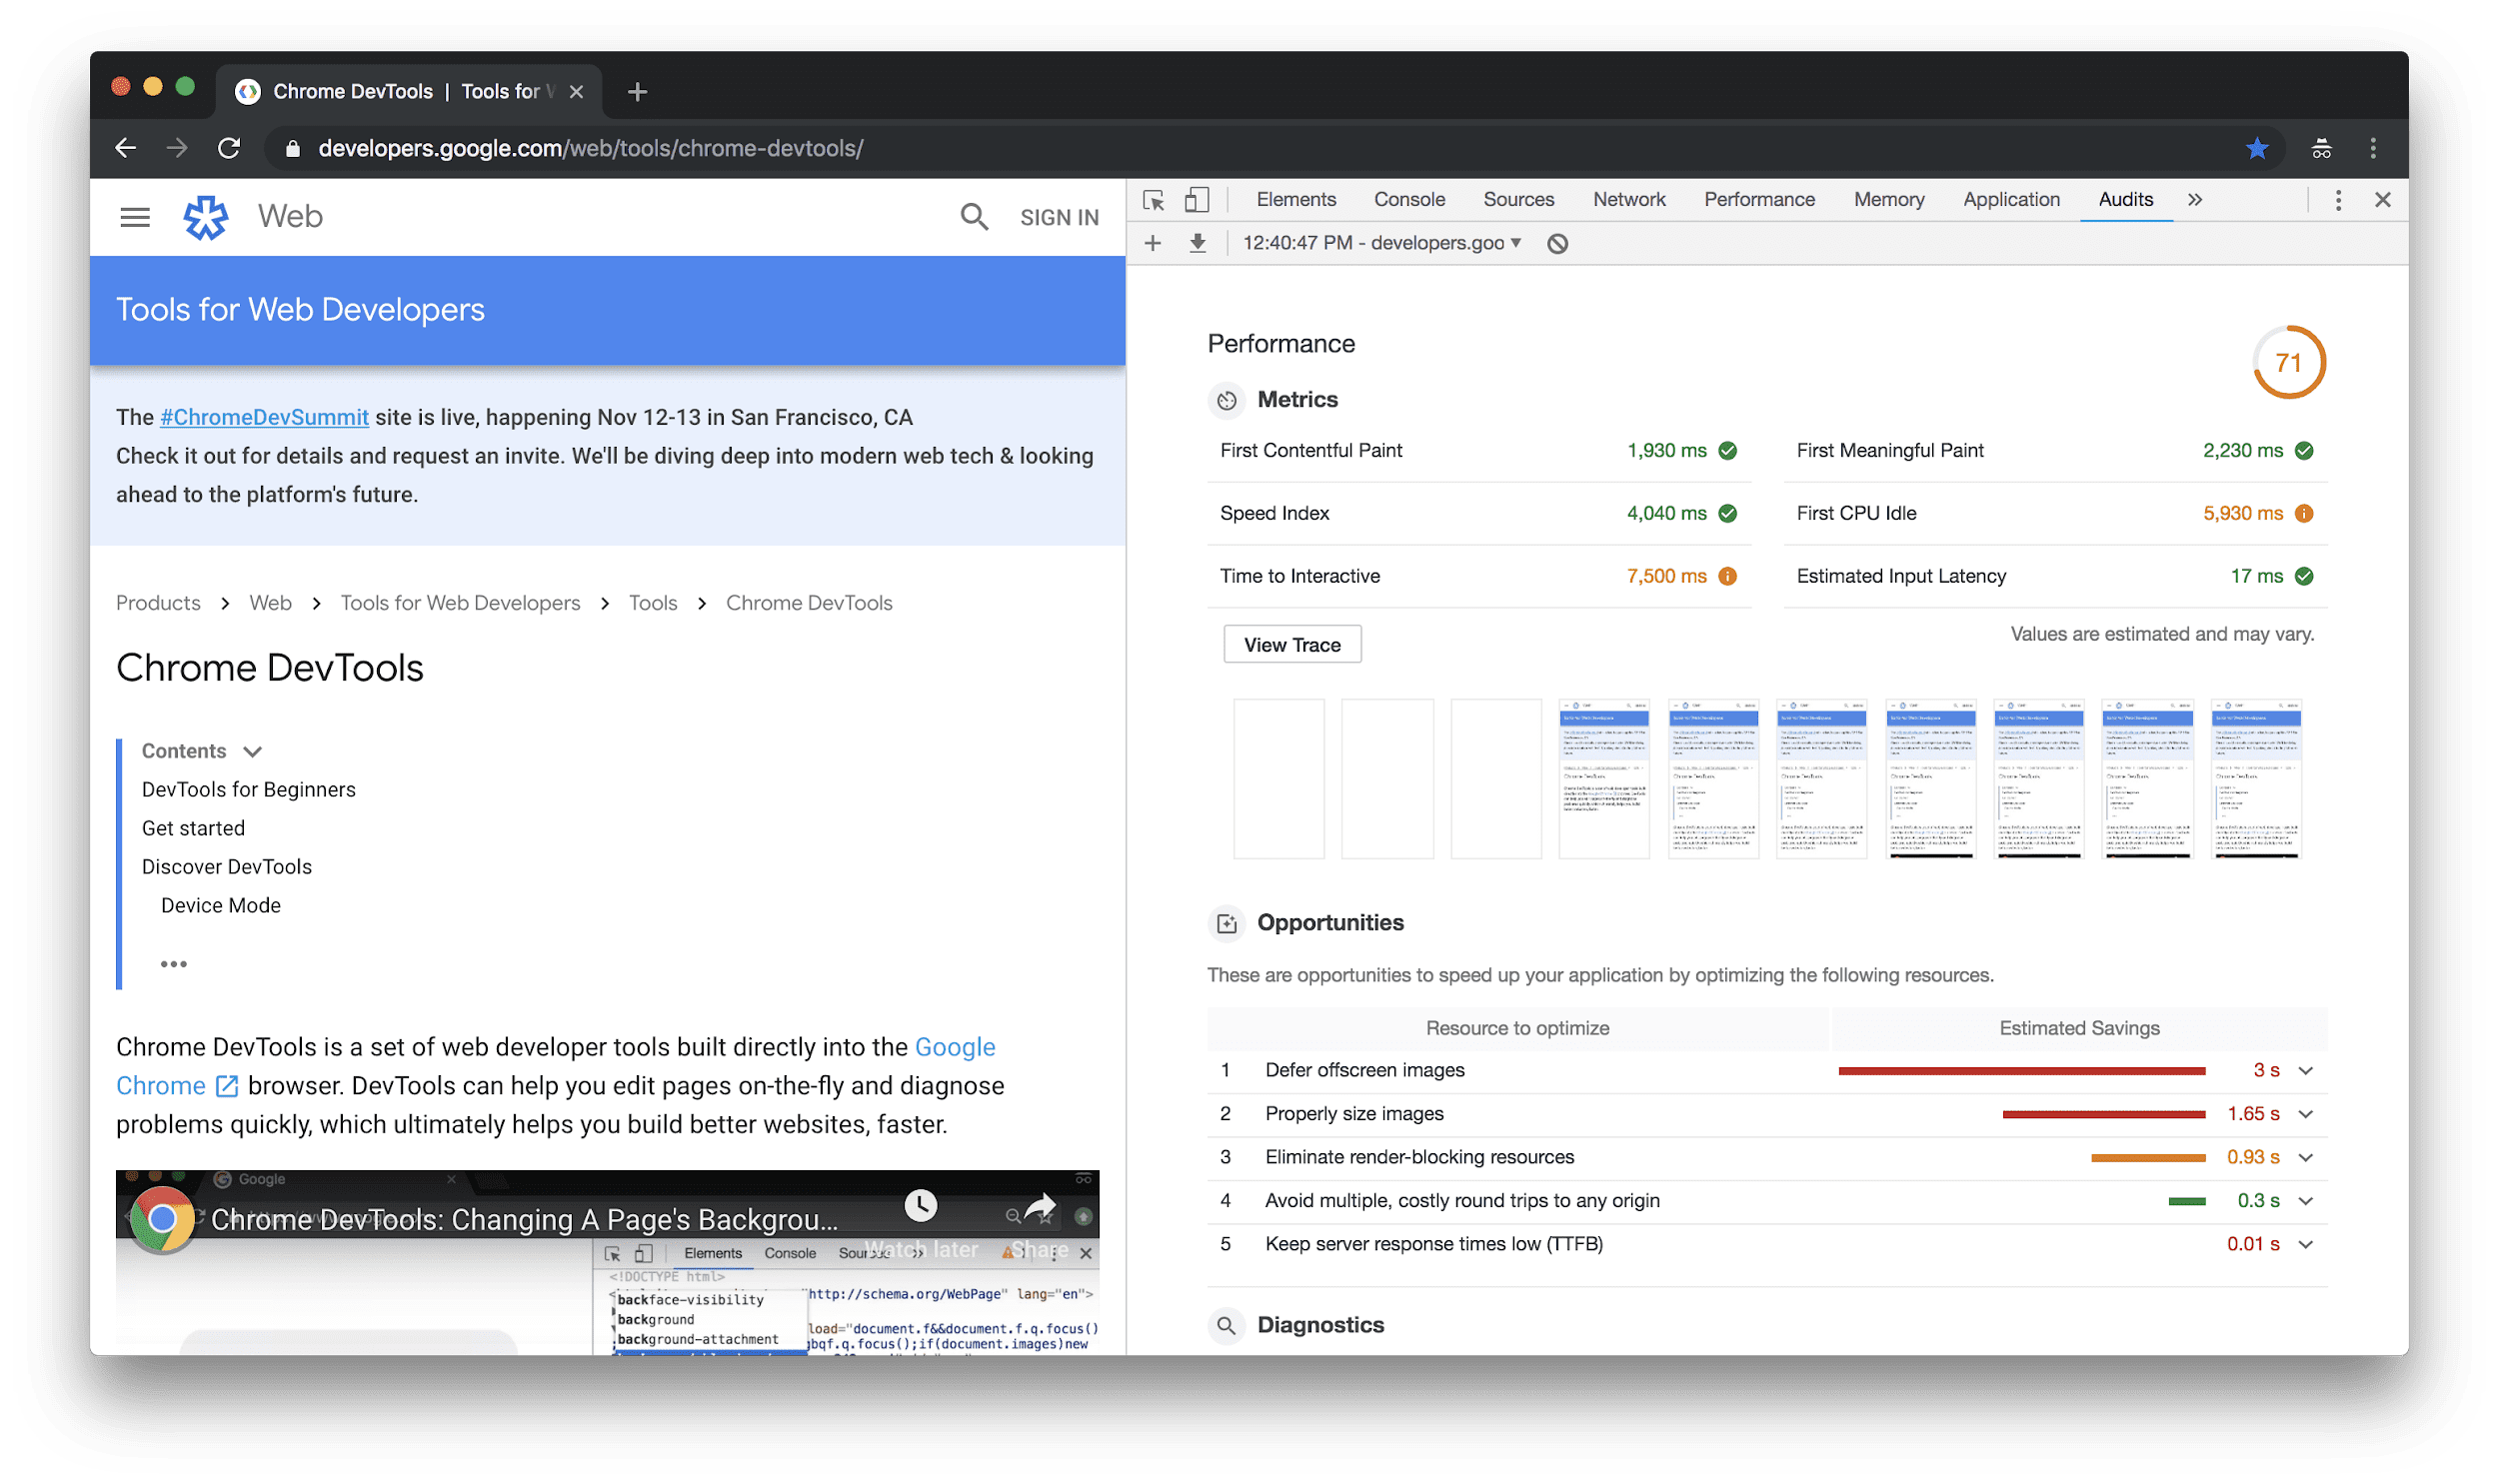
Keep the throttling setting consistent across runs. If you compare a throttled run to an unthrottled run, the throttled scores will look much worse, even though nothing about the page changed—which can send you chasing a regression that does not exist.
Reading the report
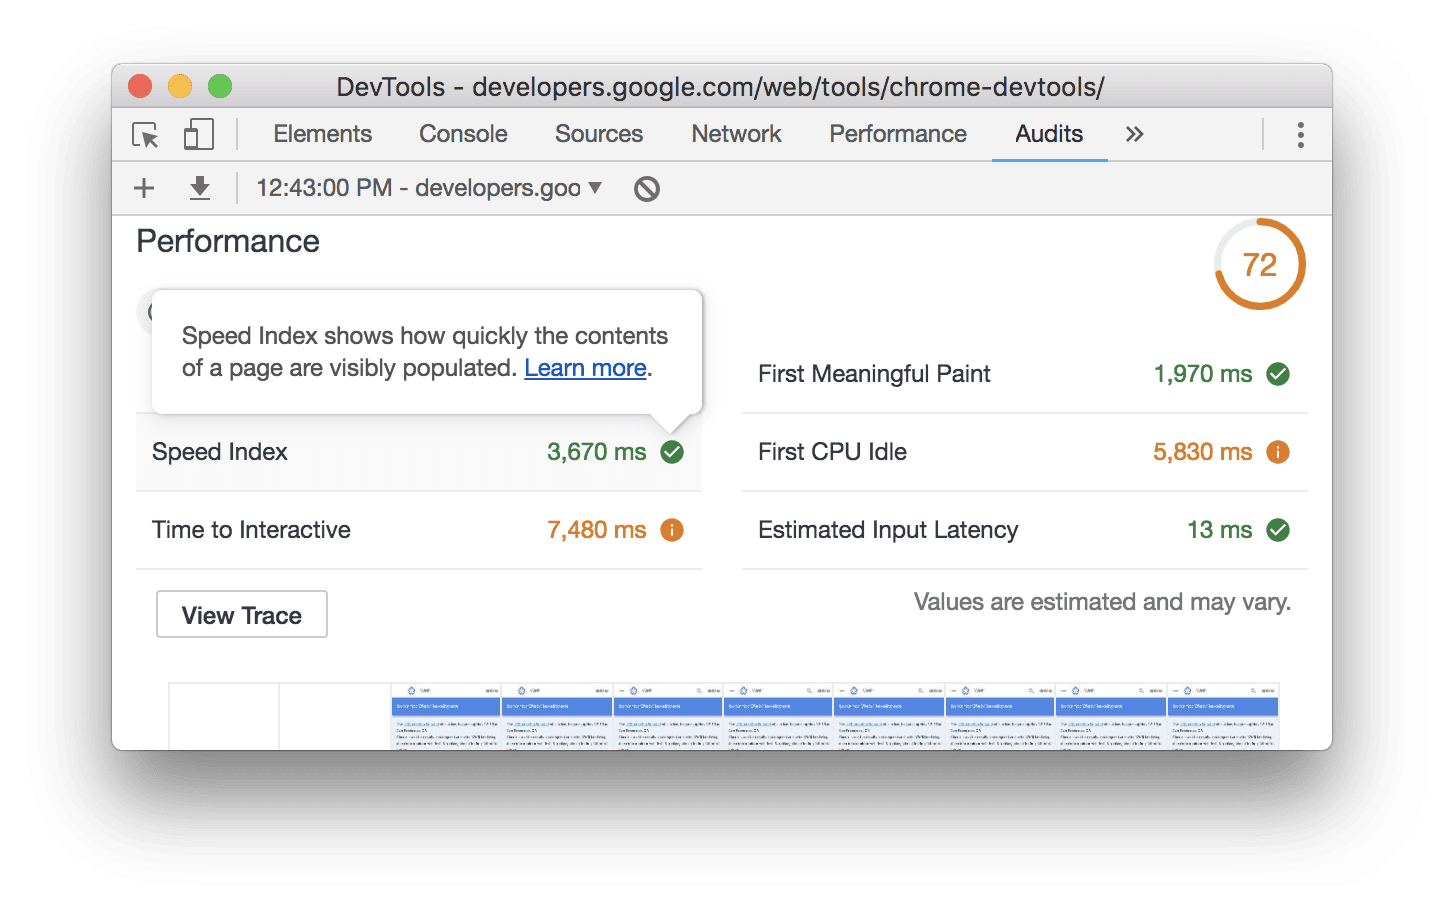
The overall performance score sits at the top-right, on a 0 to 100 scale. Below that are the individual metric scores. The Lighthouse v3 Scoring Guide explains how those scores combine into the overall score.
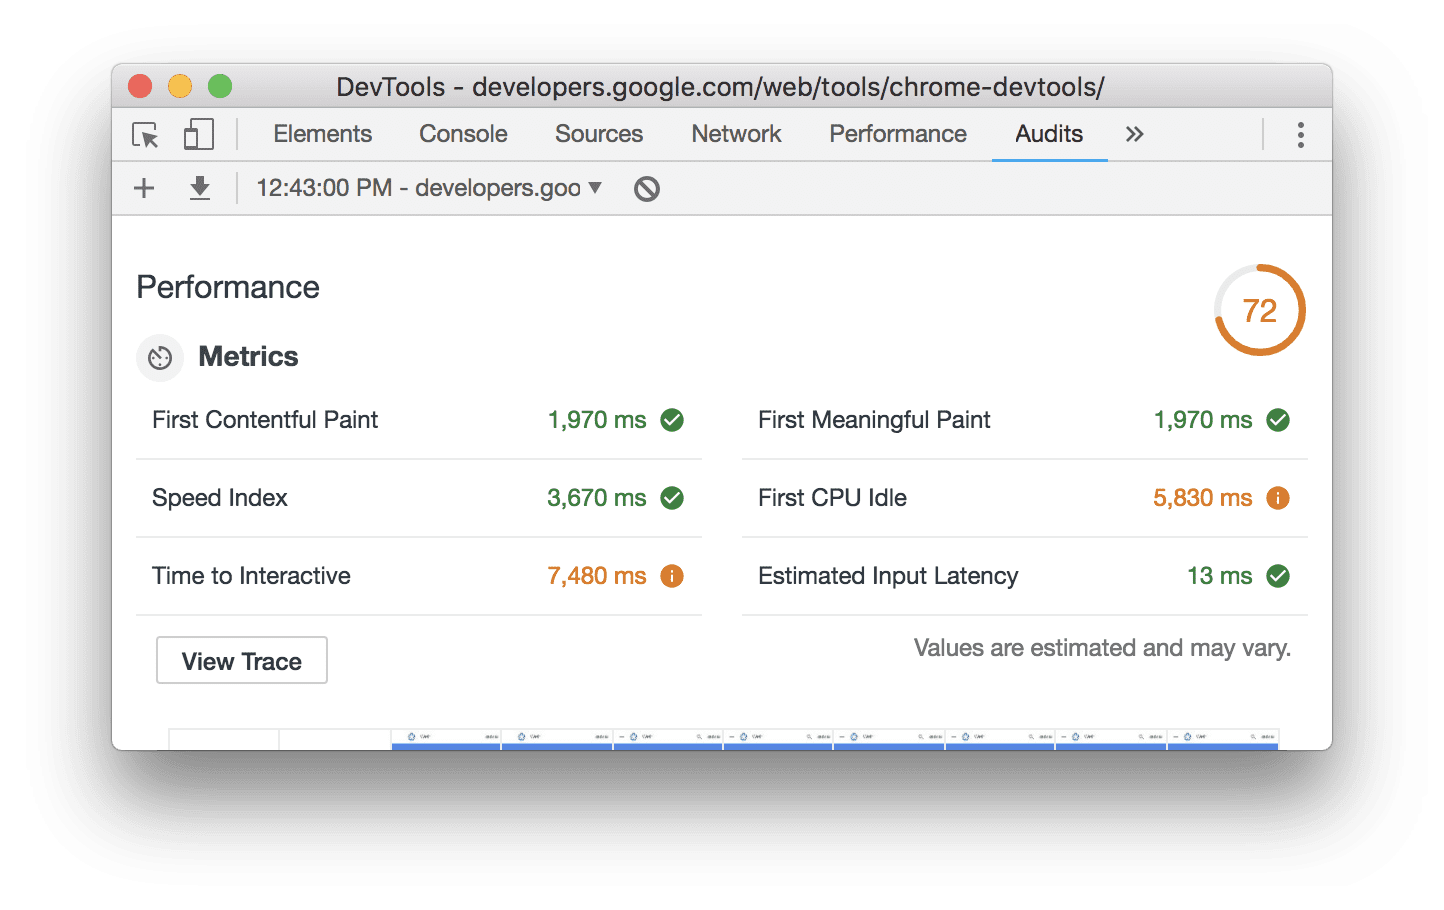
Hover over any metric for a short explanation, or click Learn more to jump to the full documentation for that metric.
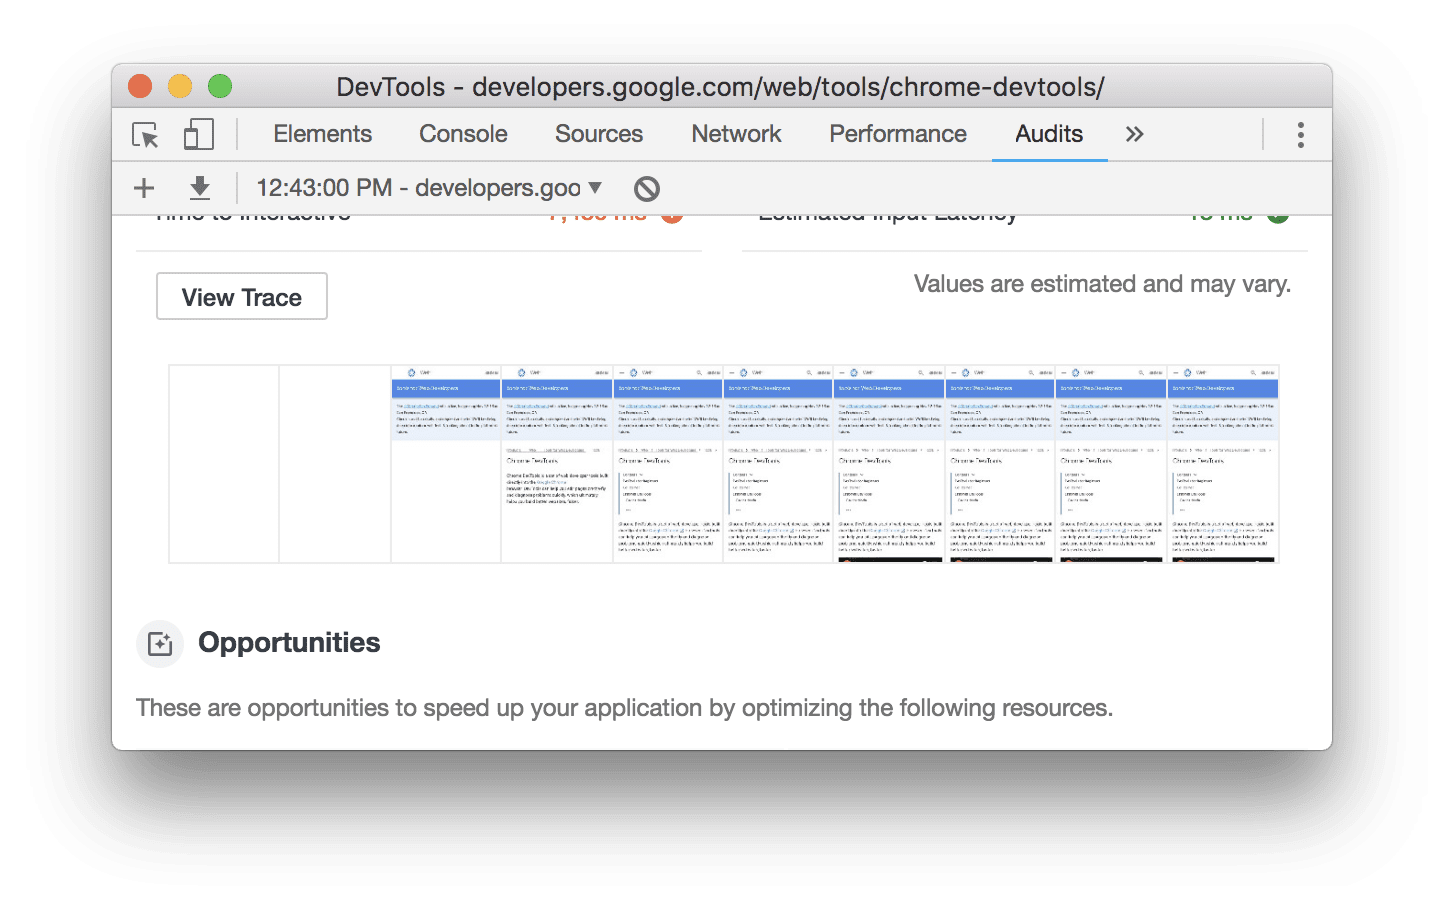
Screenshots of the page during load appear below the metric scores.
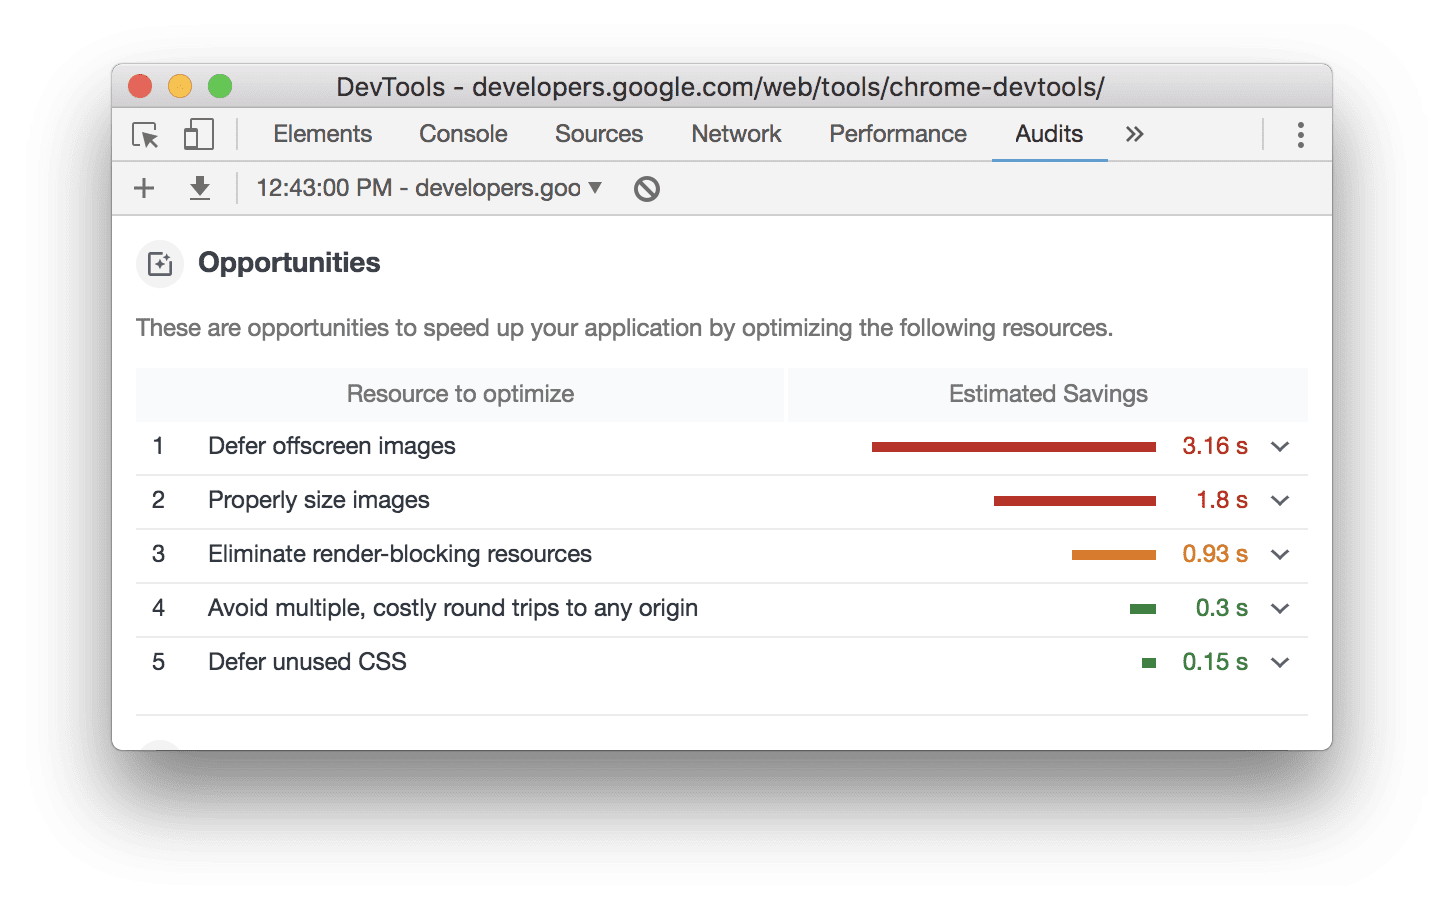
Below the screenshots is the list of performance opportunities.
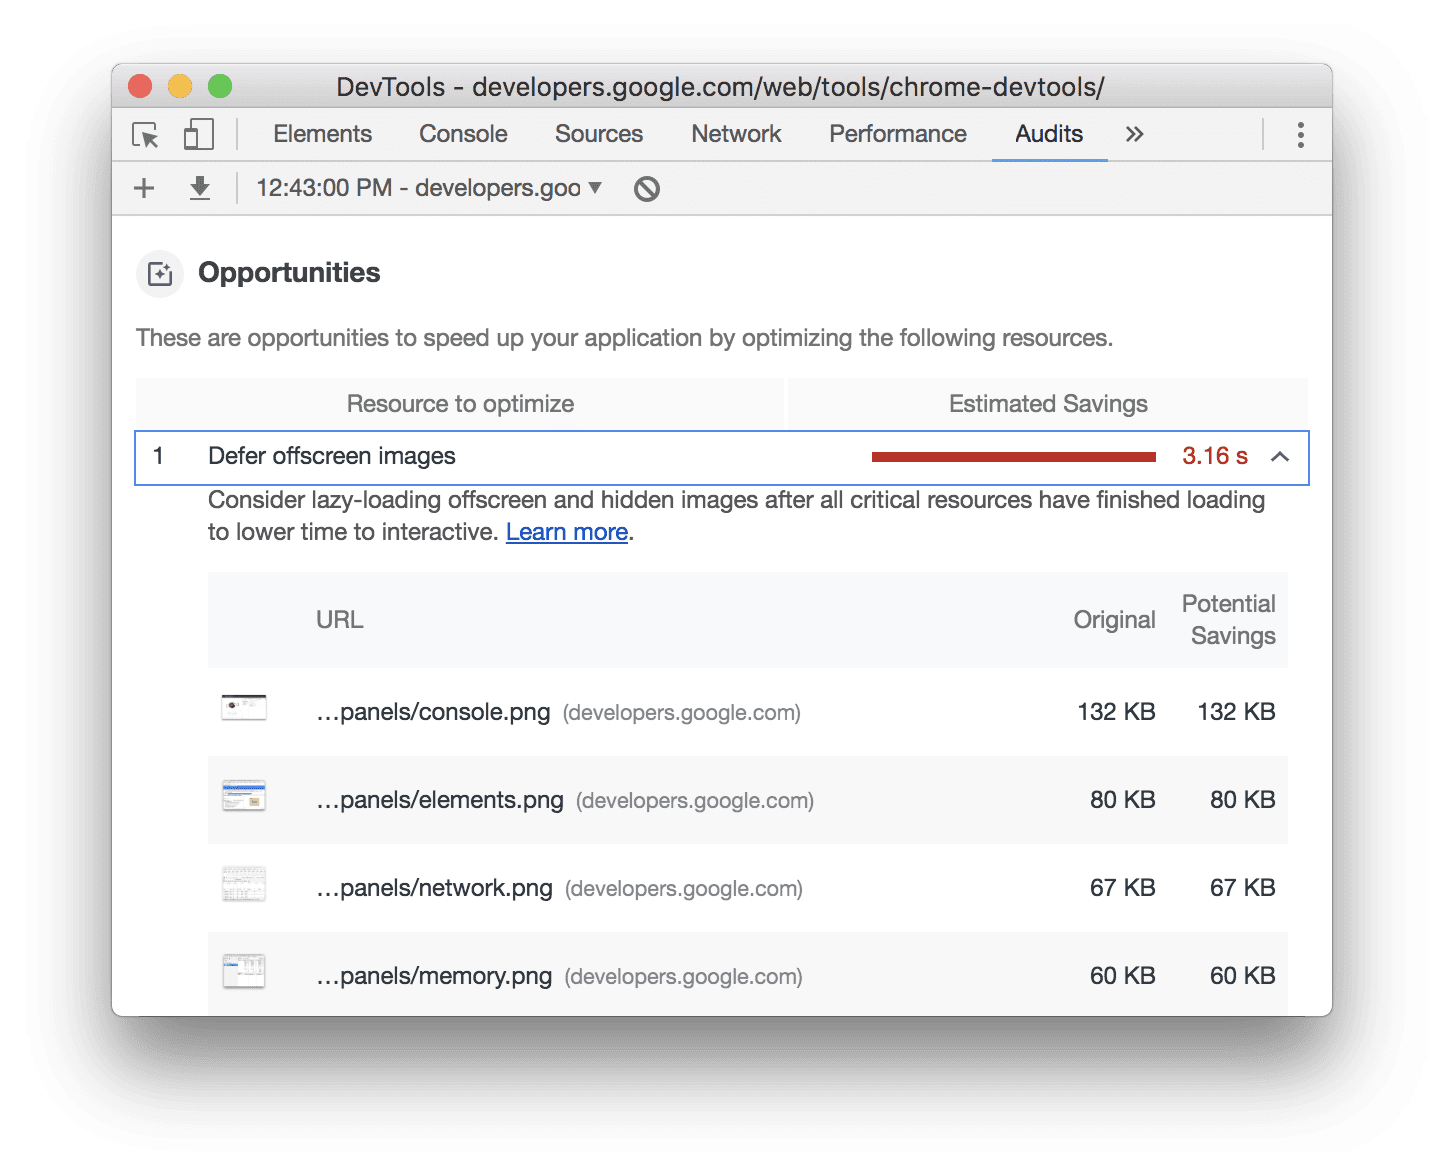
Click any opportunity to see why it matters and how to address it.
Tuning the loop
Audit the page once, implement one opportunity, and run the audit again. Scores should improve slightly, and that opportunity should no longer appear as an outstanding item. That short loop is useful for spot checks, but for ongoing health add the site to your profile so Lighthouse progress is tracked over time.



