
Making Core Web Vitals Work For You
Core Web Vitals are Google’s quality standards for user experience, each measuring a distinct part of how a page feels to visit. You can get these numbers from field data (what real users experience) or lab data (tested in a controlled environment). It’s important to remember that good Core Web Vitals scores don’t automatically mean a perfect Lighthouse score. For SEO purposes, it’s the Core Web Vitals that matter for ranking on both mobile and desktop, so it’s worth keeping an eye on them specifically. The tools below can help you collect, visualize, and act on those metrics.
Comparing Pages With PageSpeed Compare
PageSpeed Compare builds on Google PageSpeed Insights to measure a single page or compare up to 12 pages at once and evaluates lab and field metrics, page resources, DOM size, CPU time, and potential savings. The dashboard-style report gives you a simple read on vitals like FCP, LCP, FID, and CLS.

Beyond the headline numbers, the report details resources by type and request count, including a look at third-party requests and cached resources. It also flags unused JavaScript and images, and checks DOM size, complexity, and child elements. A graph shows layout shifts over time. For CPU, it breaks down time spent on tasks, JavaScript execution, and blocking. Finally, it recommends optimizations for things like server and image configuration, showing the potential savings you could gain with each fix, sometimes at a resource-specific level, such as removing unused CSS.
Bulk Checking A Whole Domain
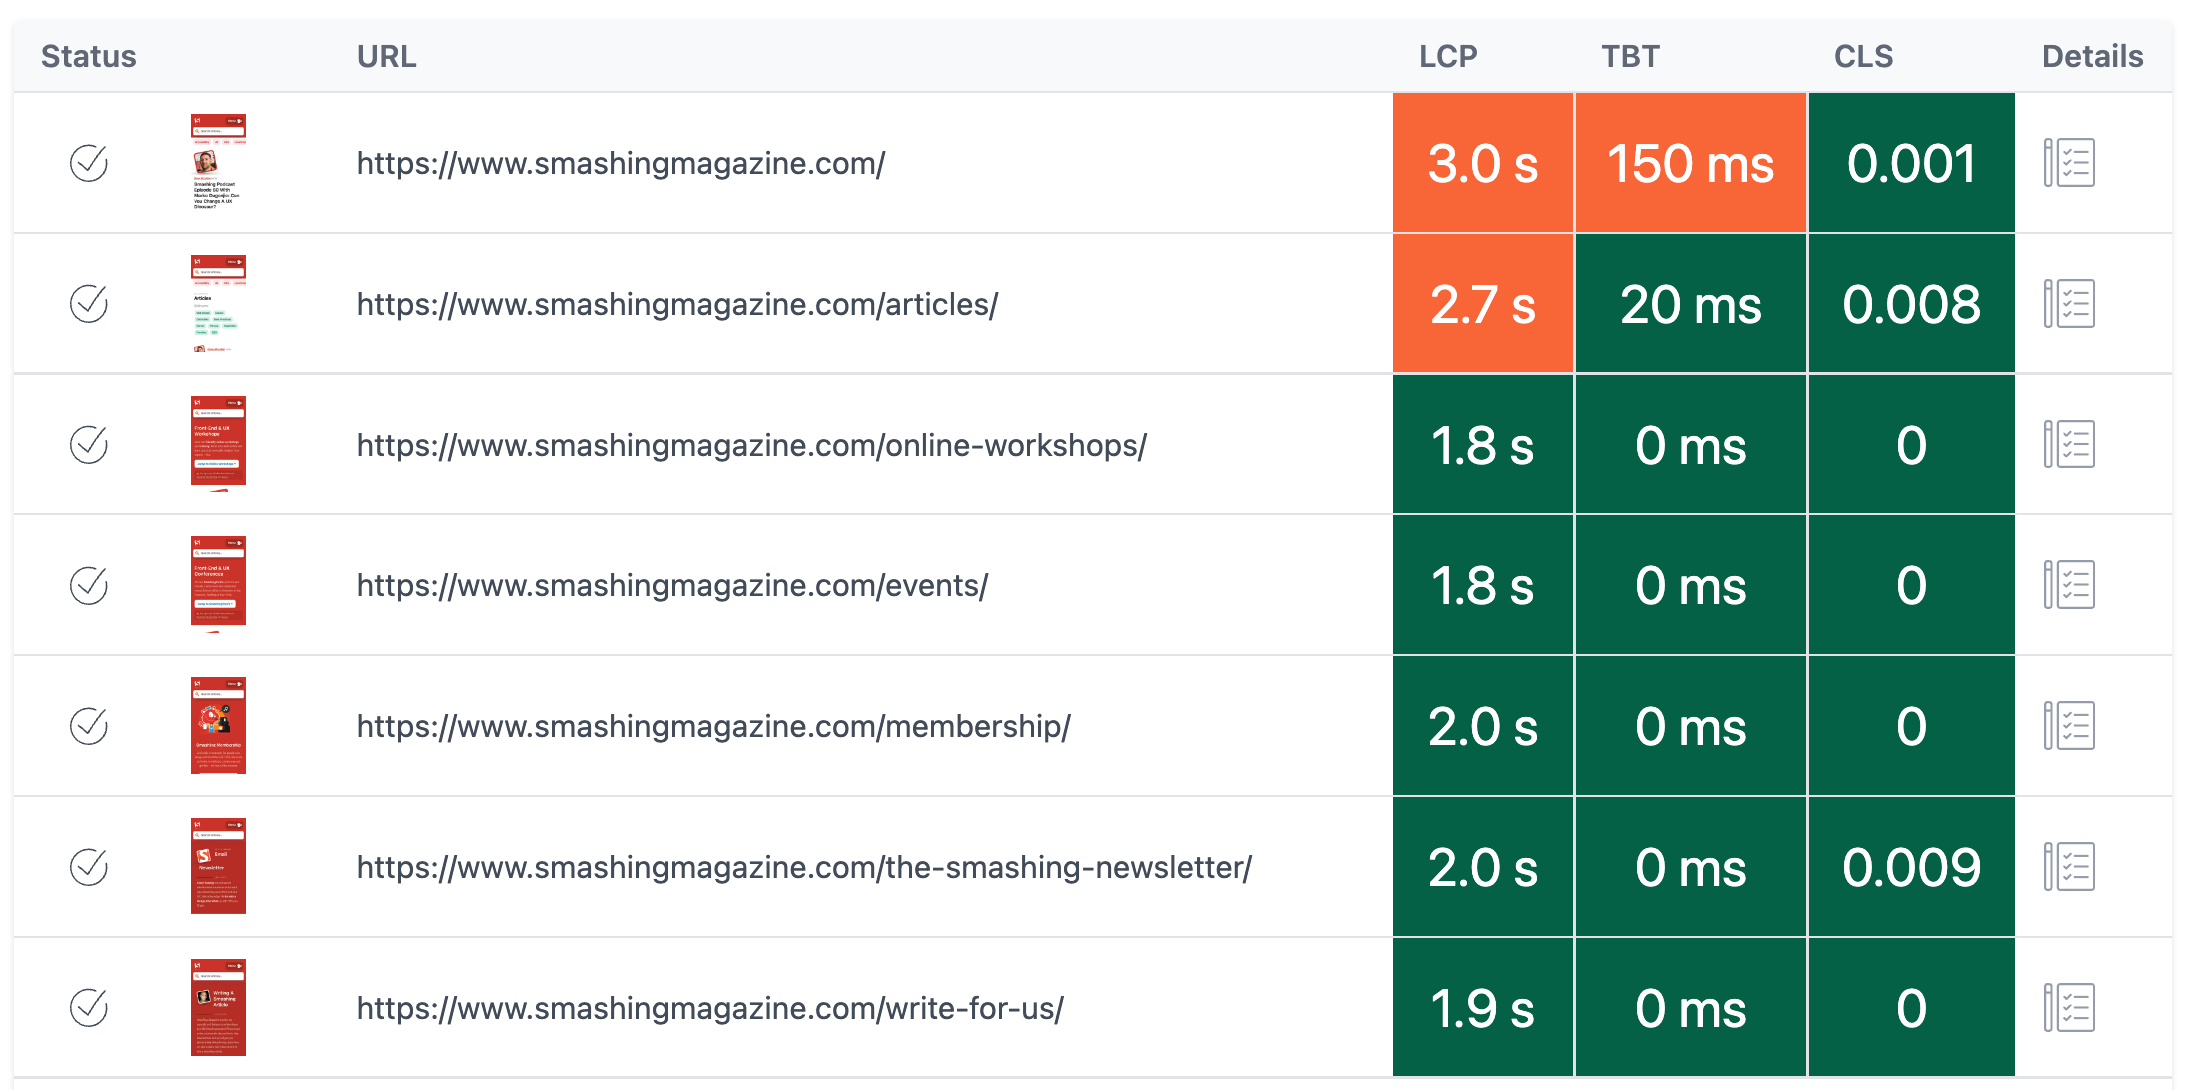
For a higher-level view, Experte’s Bulk Core Web Vitals Check crawls up to 500 pages across an entire domain. Because tests run one at a time, expect to wait roughly 15-30 minutes for the full report. When it finishes, you get a table of results that makes it easy to spot your best and worst performers. The underlying data comes from PageSpeed Insights and can be filtered for mobile or desktop.
Results are exportable as a CSV file for Excel, Google Sheets, or Apple Pages. If you’d rather not use a third-party service, David Gossage’s article on reviewing Core Web Vitals scores in bulk shares the scripts you can run manually with an API key.
Continuous Tracking With Treo
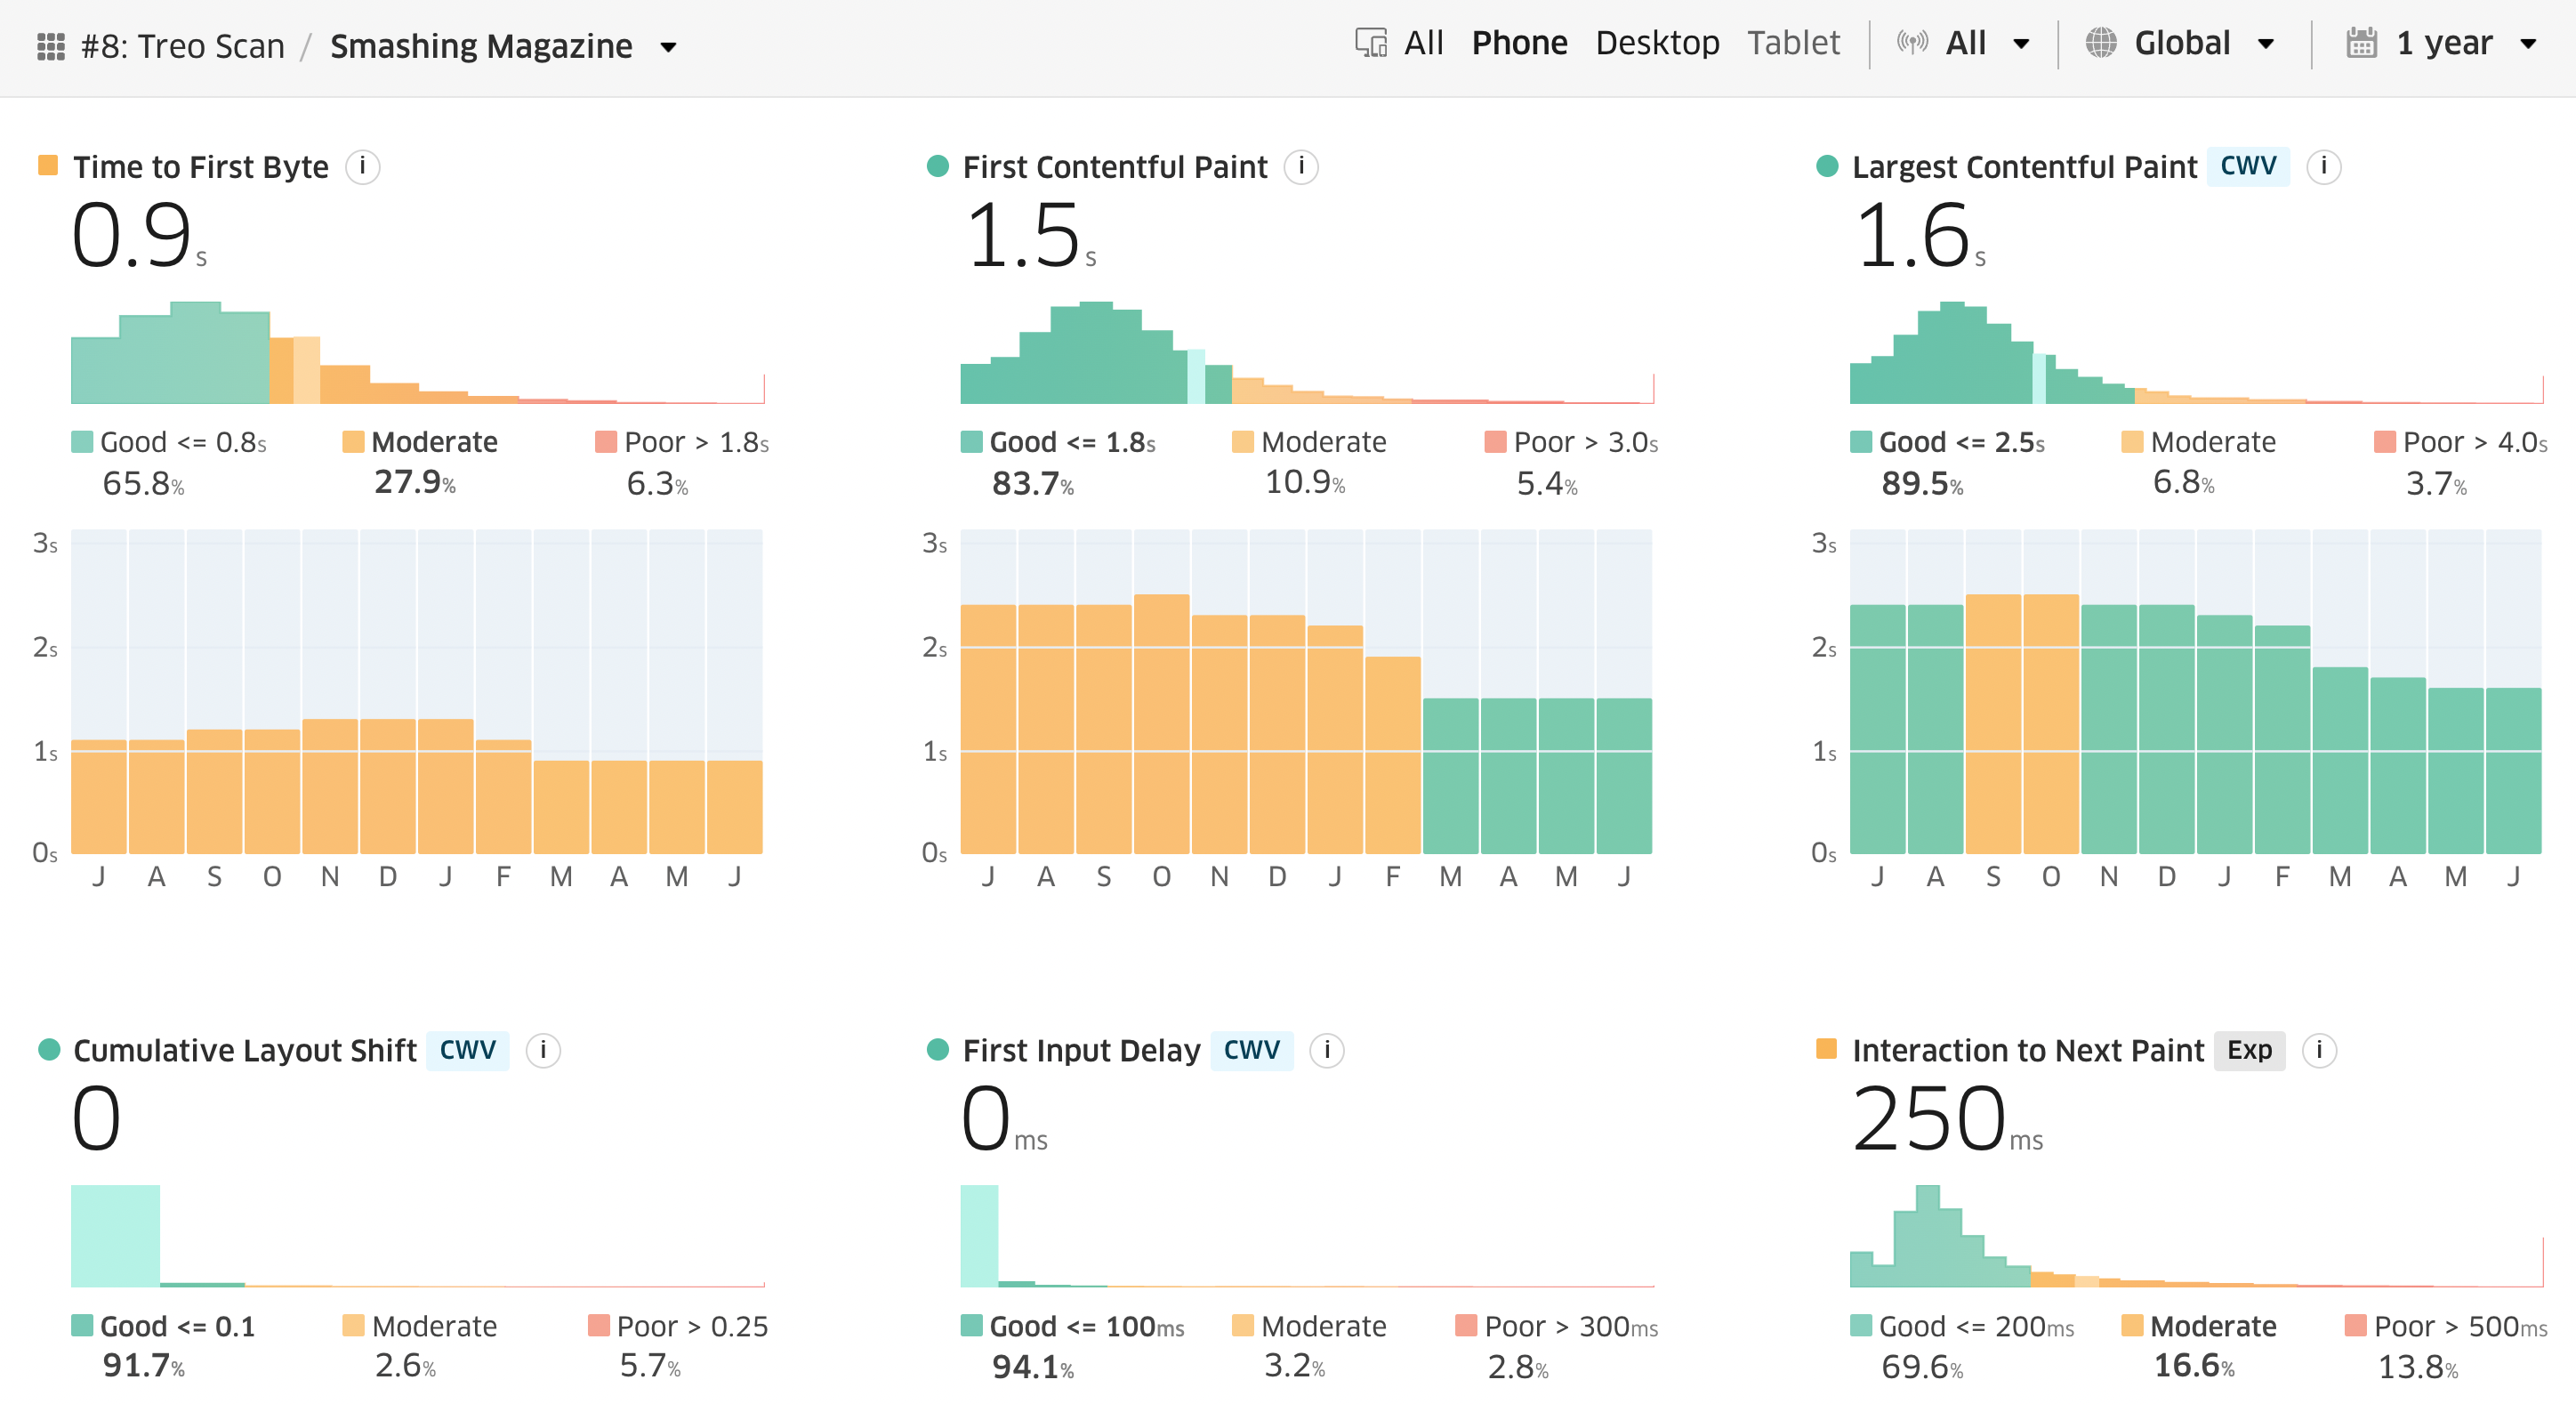
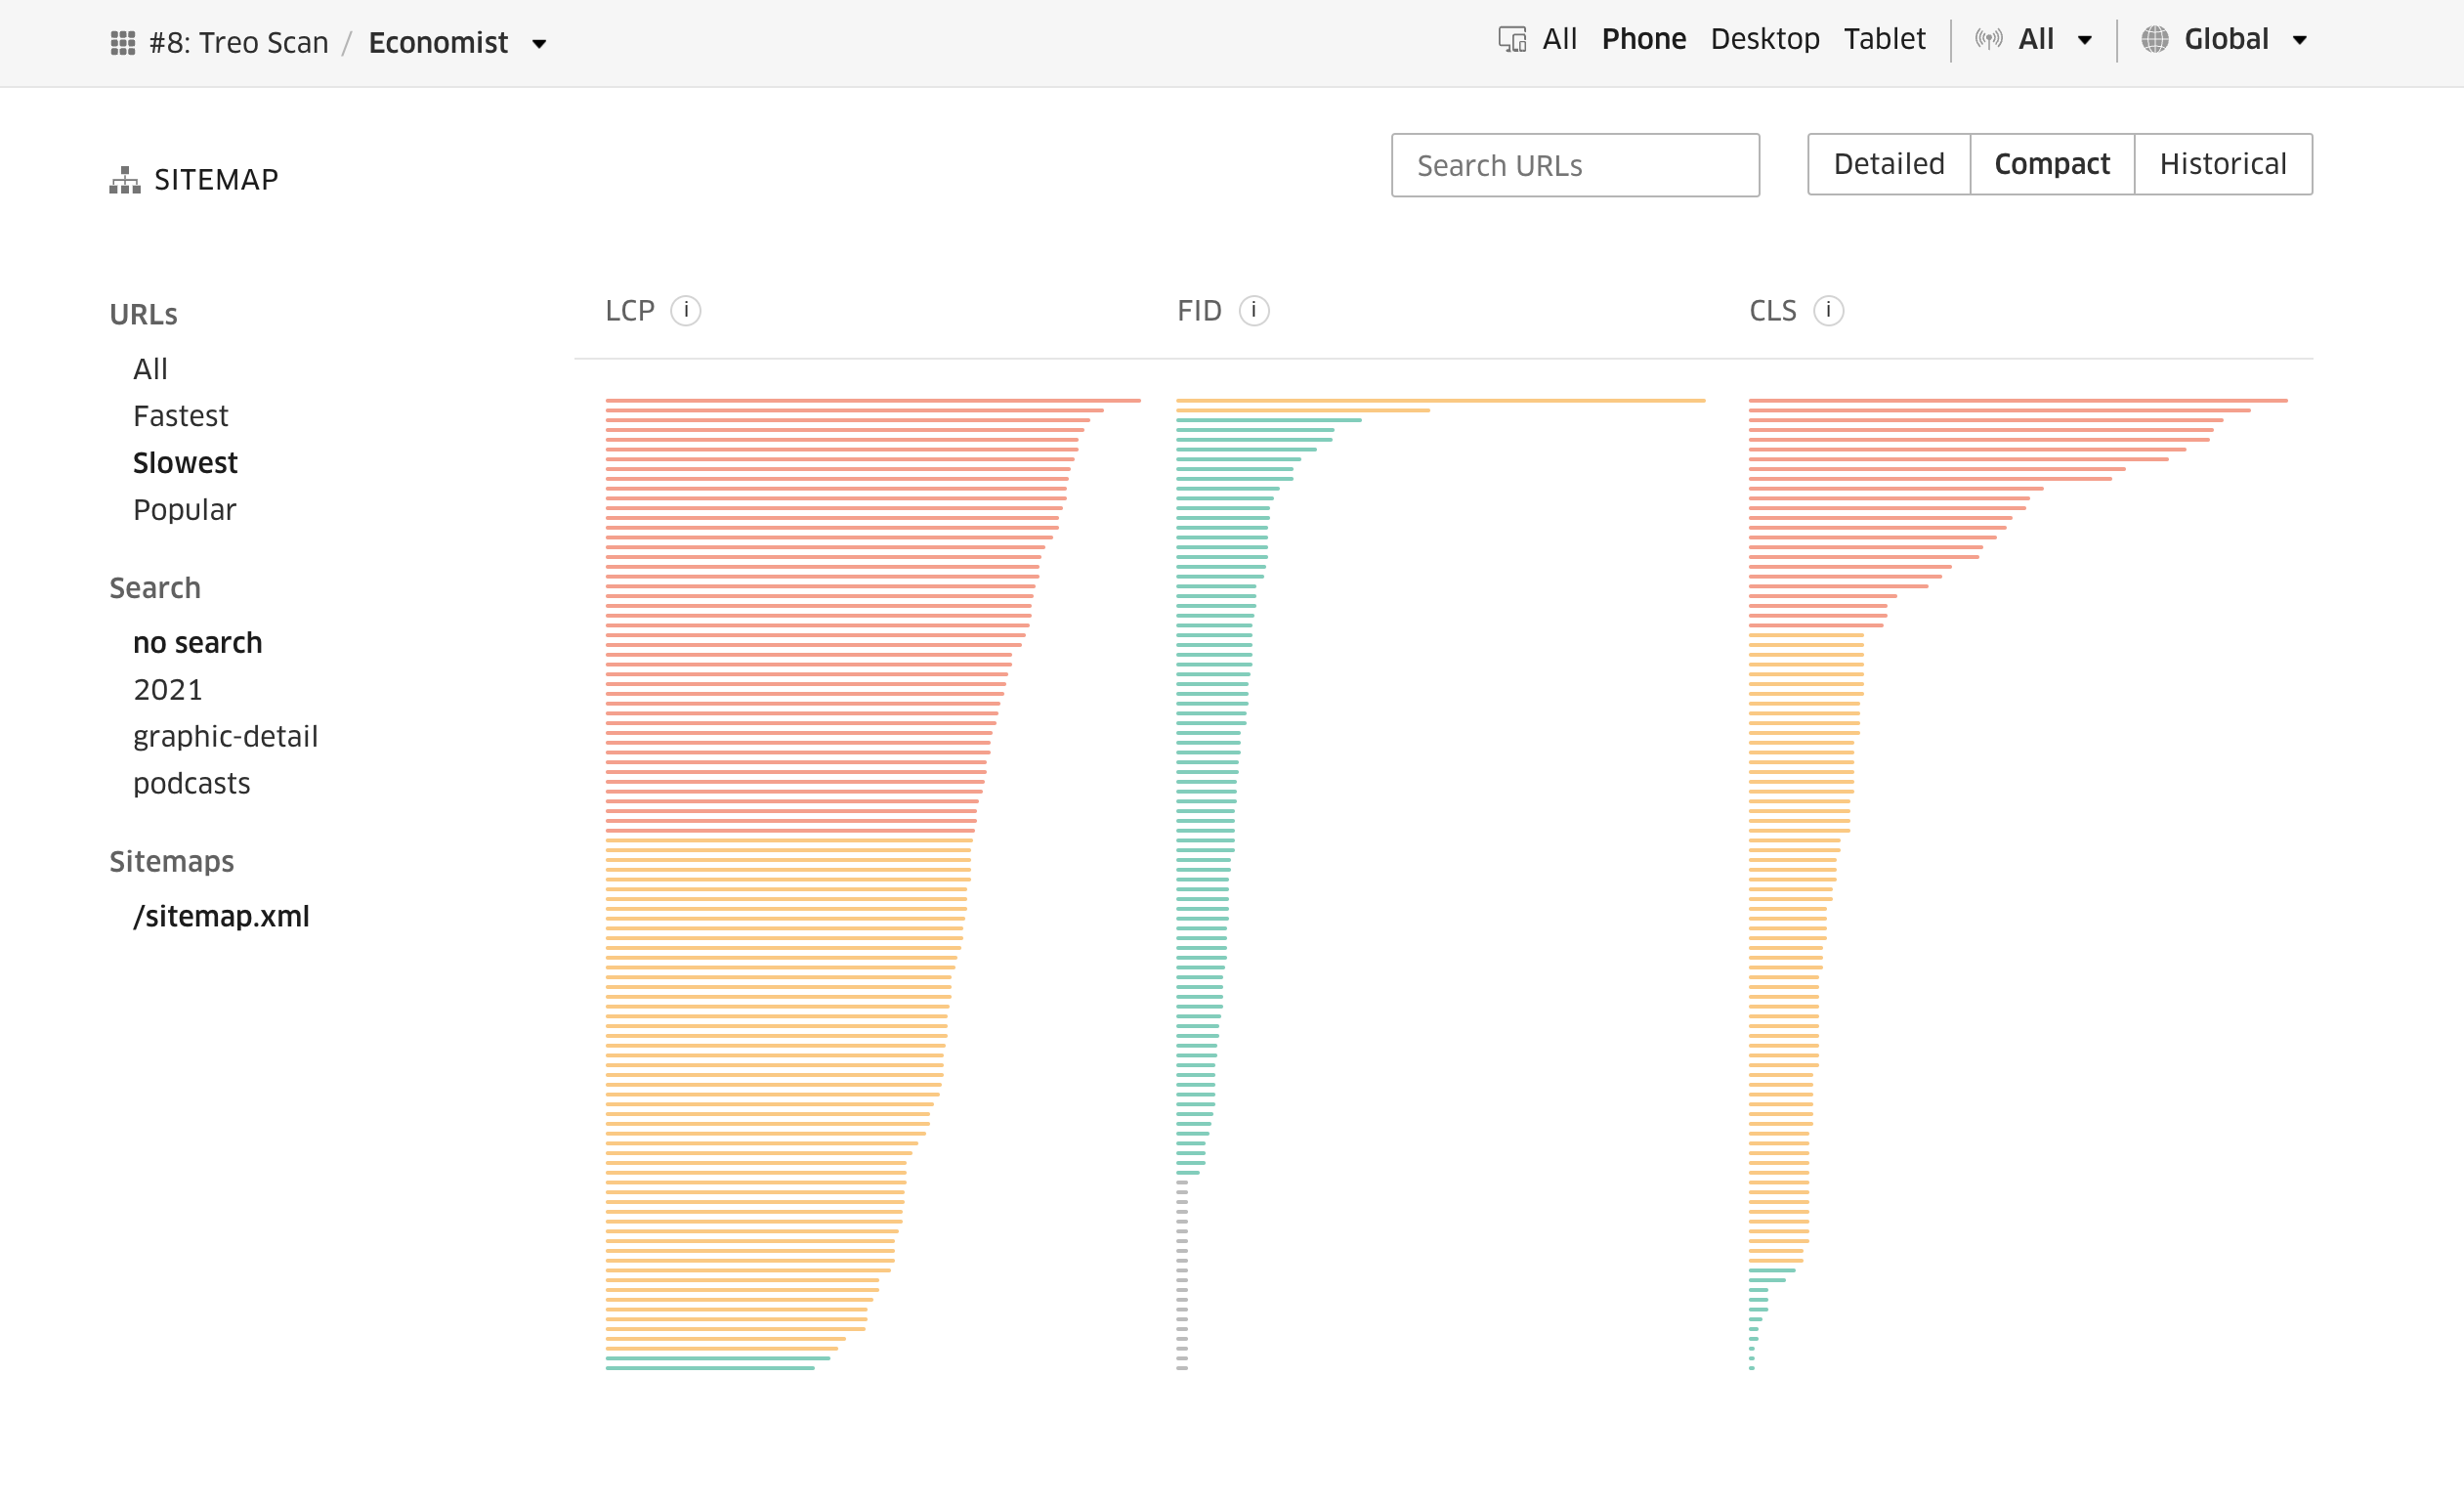
For more persistent monitoring, Treo Site Speed pulls data from the Chrome UX Report, Lighthouse, and PageSpeed Insights. You can run audits across different devices and network conditions. More importantly, Treo tracks performance across all pages in your sitemap and lets you set alerts for regressions, plus receive monthly updates.
Treo also supports benchmarking against competitors. Reports are comprehensive and granular, broken down by device and geography at both domain and page levels. They can be exported, accessed via API, and shared.
Deep Dive Testing With WebPageTest
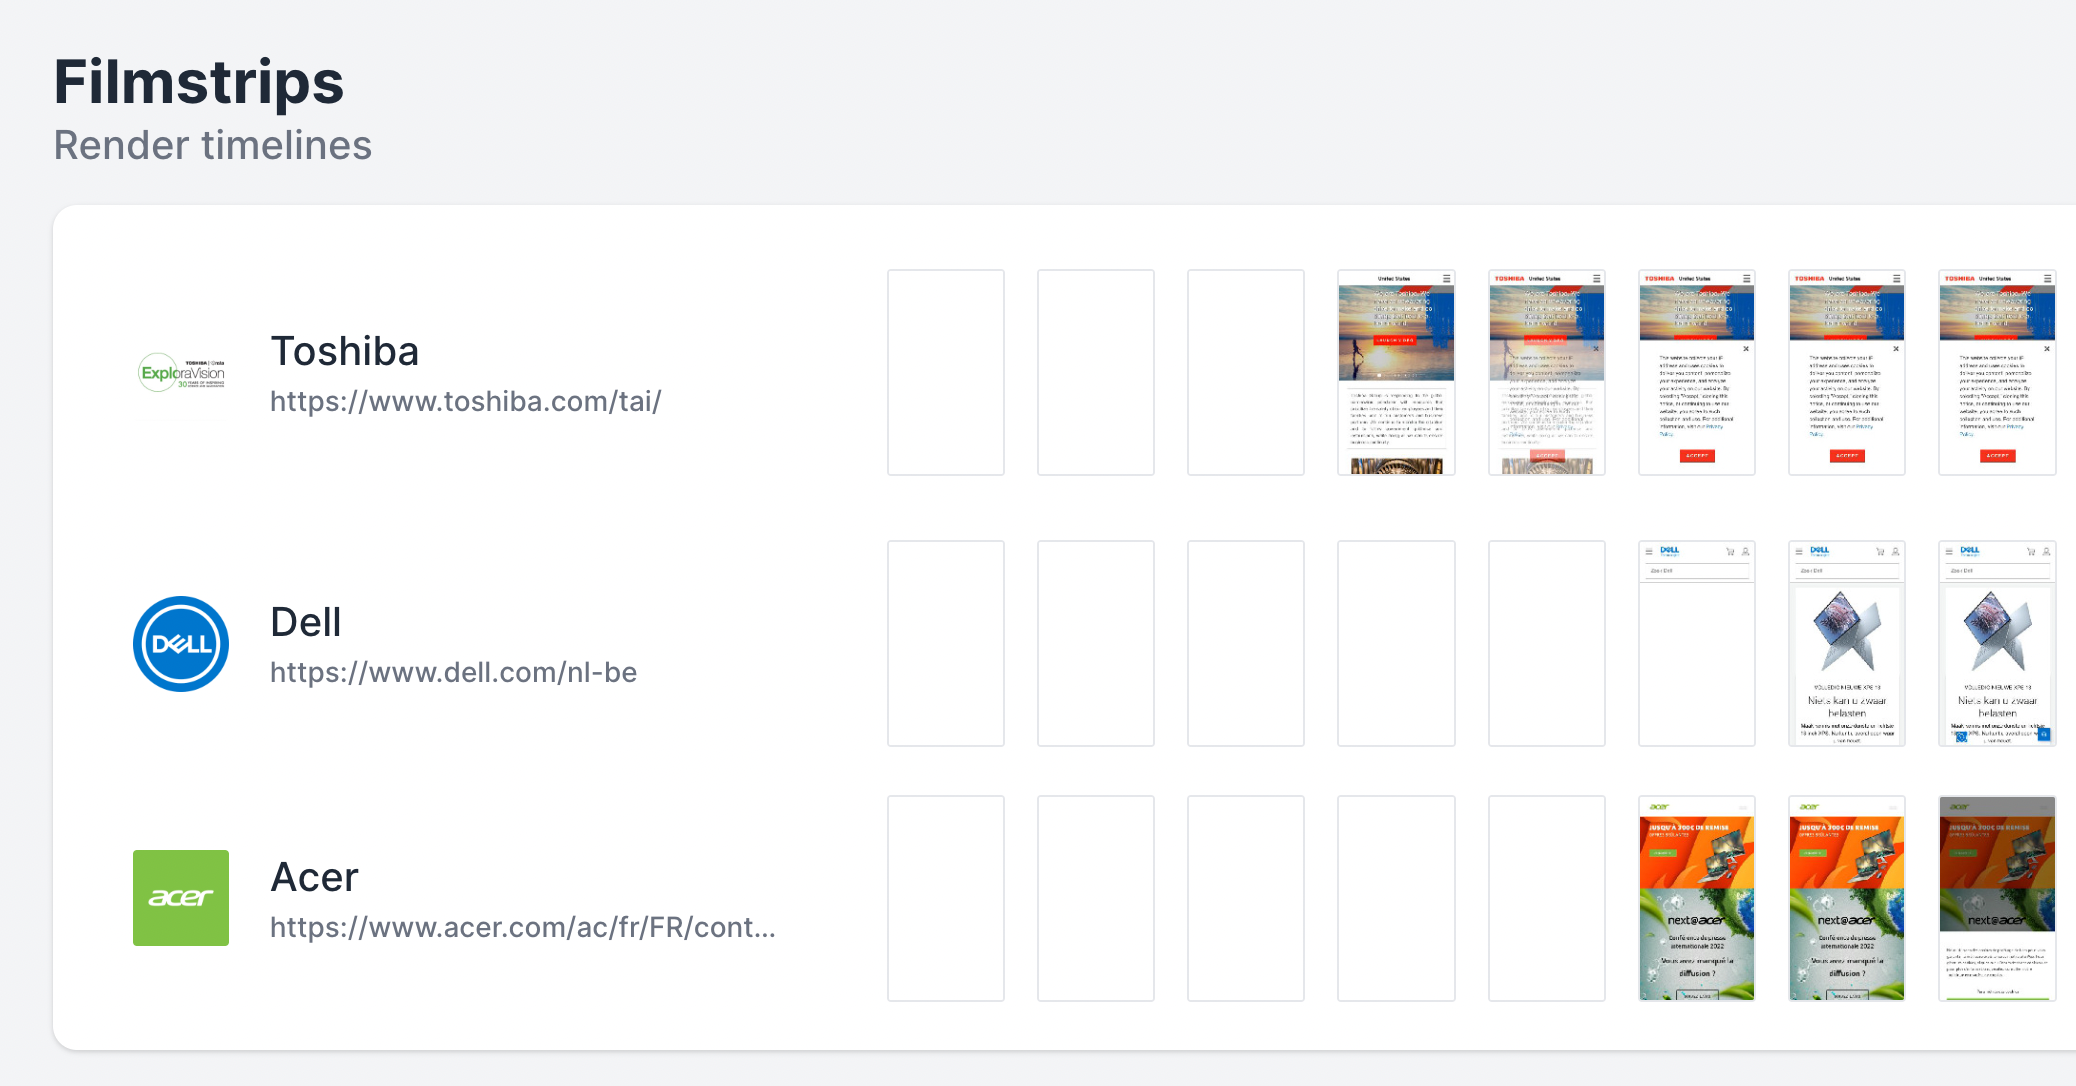
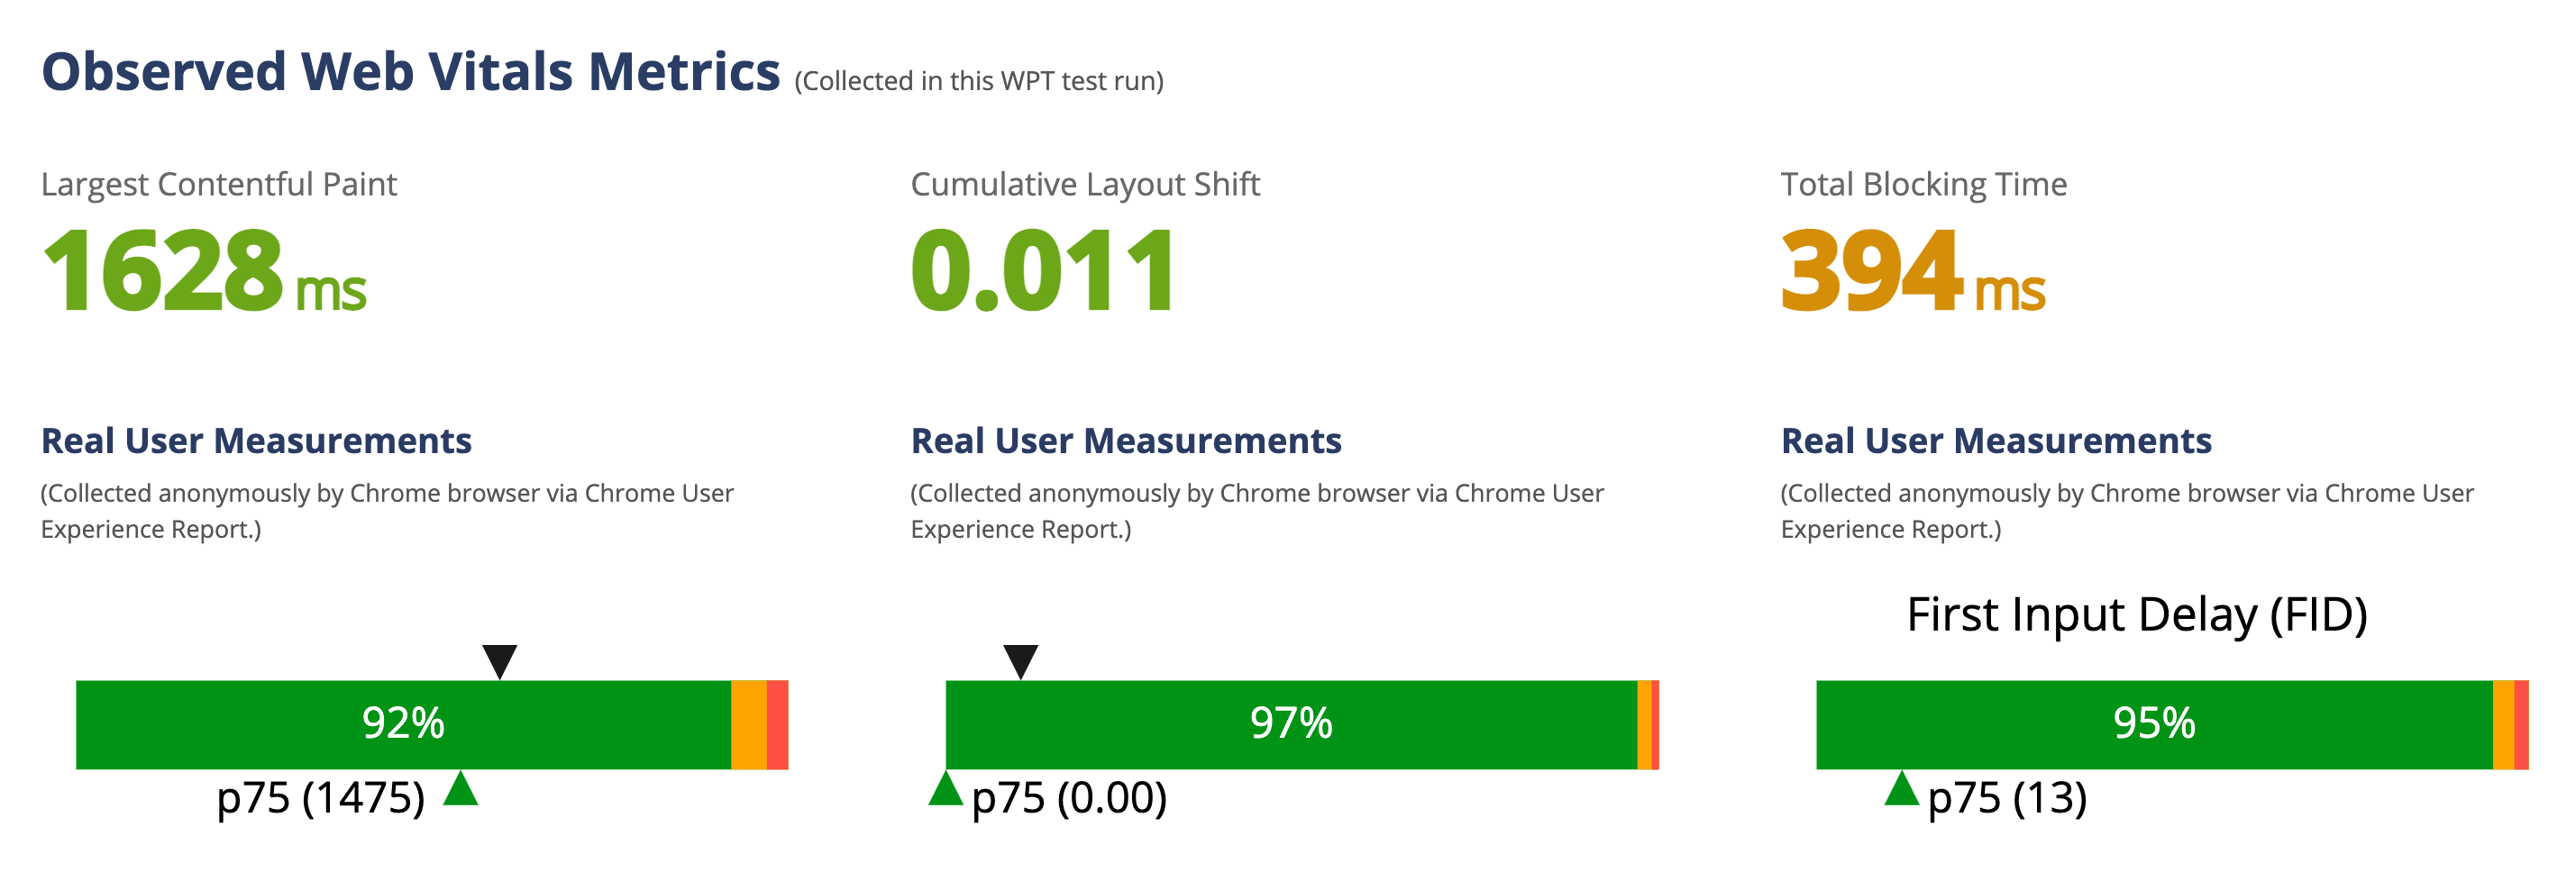
The broader WebPageTest suite includes a dedicated section for Core Web Vitals that provides a metric breakdown along with pointers to problem areas.
The full performance audit includes suggested improvements you can toggle on without touching your code. Some of those advanced tweaks require a pro account.
Visualizing Layout Shifts
Since CLS is often the hardest metric to grasp from a number alone, dedicated debuggers help you see it. The CLS Debugger uses the Layout Instability API in Chromium to calculate CLS for mobile and desktop. During the test, the network and CPU are throttled, and pages are requested from the US. The tool generates a GIF animation showing how viewport elements shift. Elements contributing most to CLS are marked with squares and listed with their individual scores. Alongside the lab metric, the debugger also takes rolling 28-day averages from the Chrome UX Report. You can ignore cookie interstitials and even generate reports for specific countries.

An alternative is the Layout Shift GIF Generator, available as a web page or as a command-line tool. The CLI version adds options like viewport width and height, cookies, GIF output settings, and the CLS calculation method.
Web Vitals In The Browser
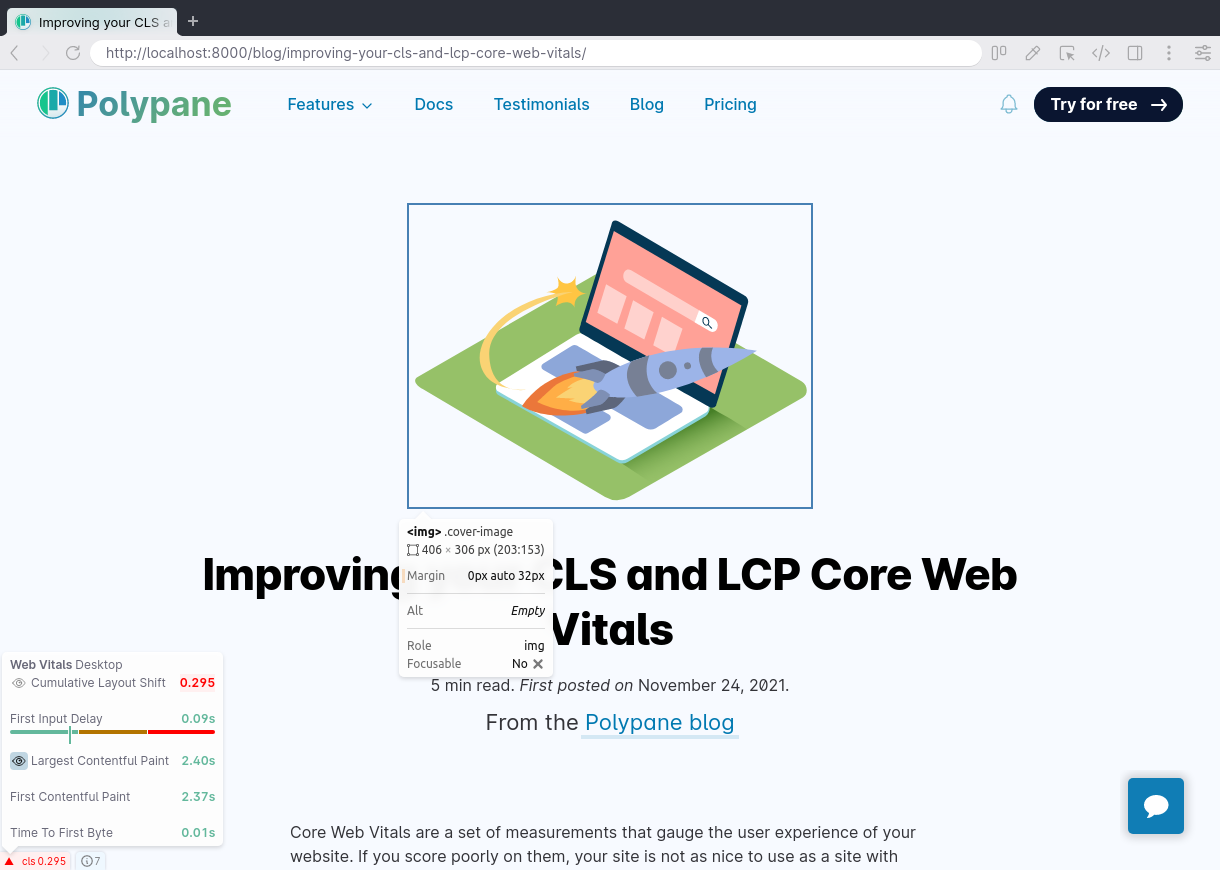
If you prefer immediate feedback during development, Polypane Web Vitals integrates performance checks into the standalone Polypane browser. The tool automatically gathers Core Web Vitals for each page and displays the scores at the bottom. It also provides LCP visualization and highlights layout shifts as they happen.
Other Handy Tools
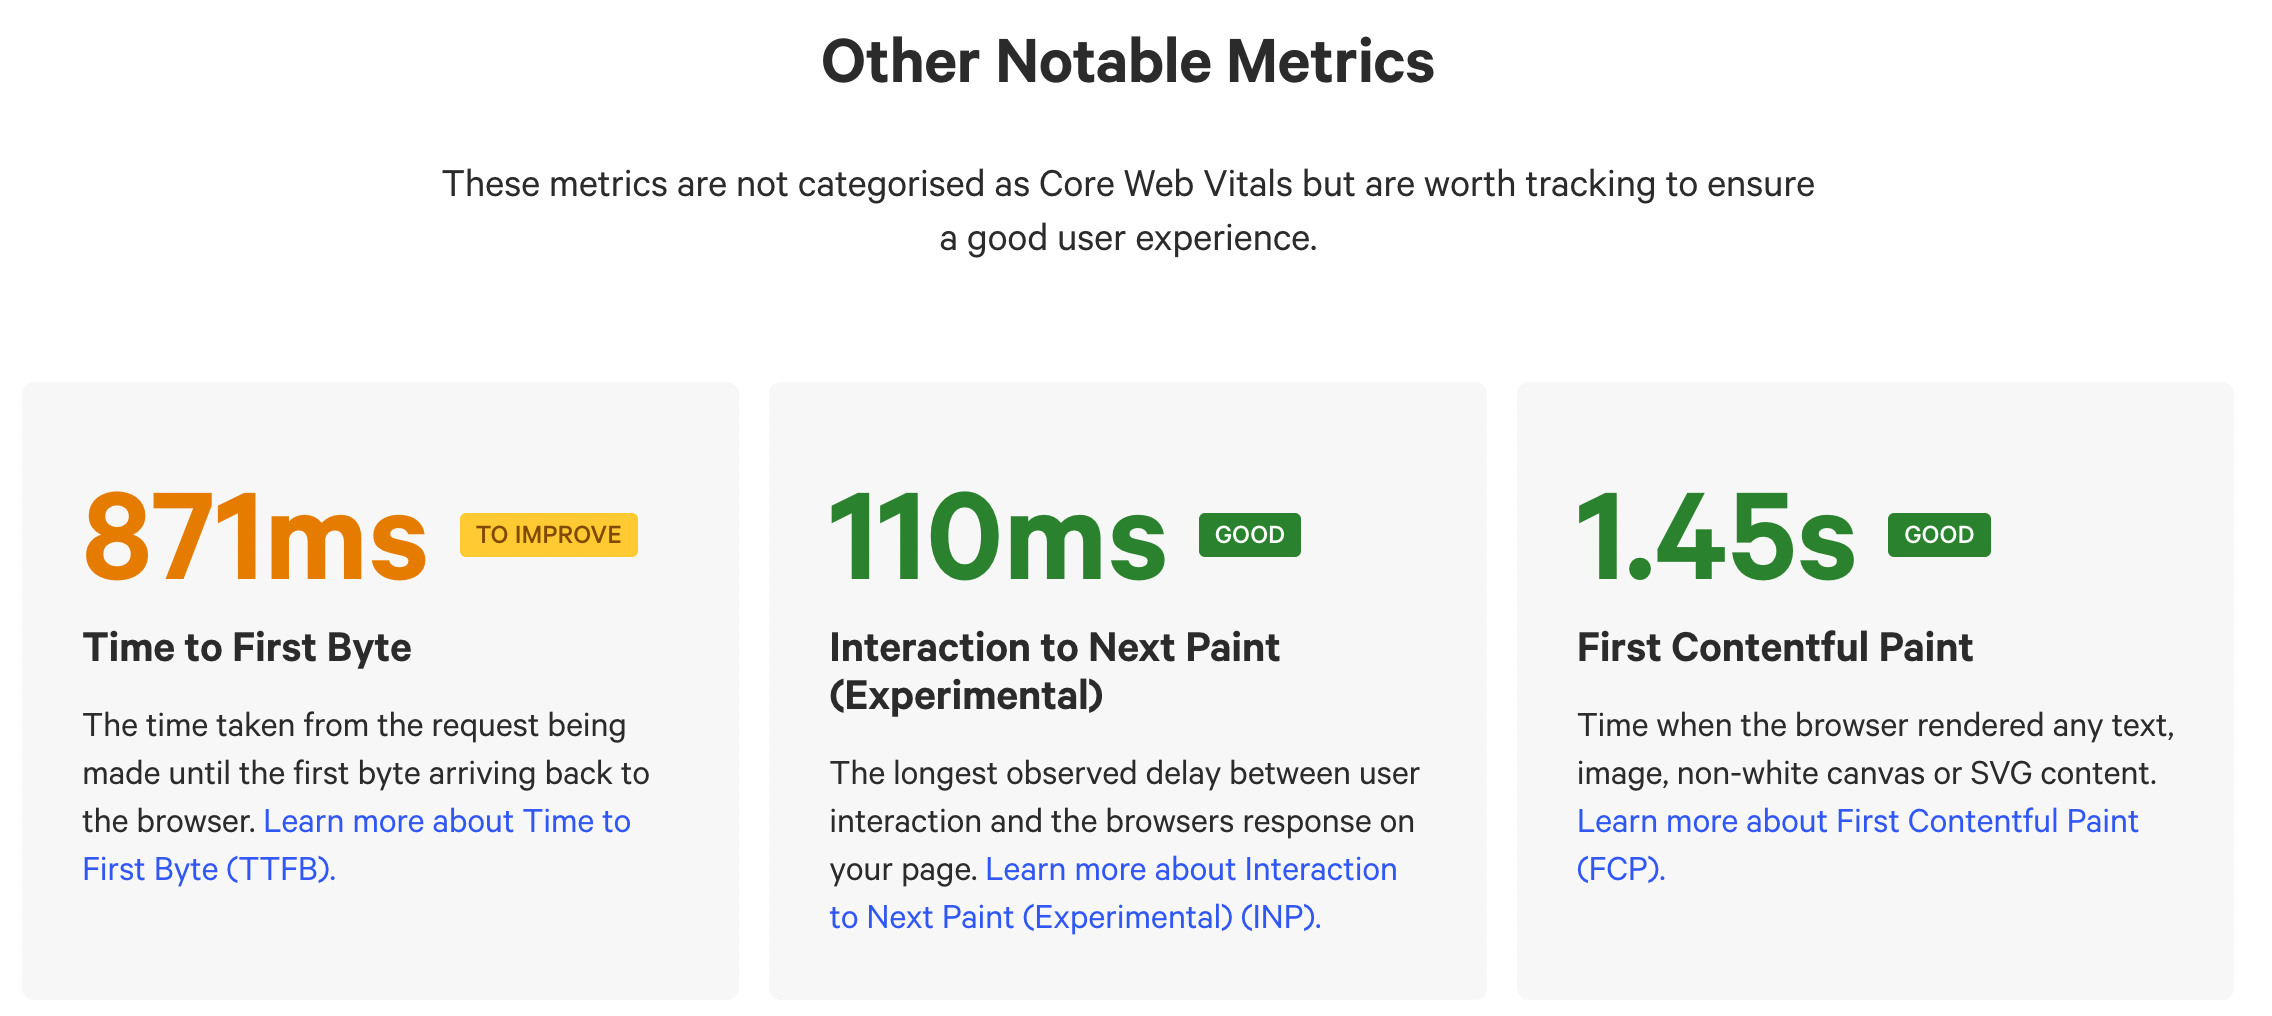
- Calibre’s Core Web Vitals Checker: A one-click check using Chrome UX Report data for LCP, CLS, FID, TTFB, INP, and FCP.
- CrUX Compare: A free utility for comparing Core Web Vitals scores side by side.
- Web Vitals JavaScript library: A small library for measuring vitals from real users on your site.
- An In-Depth Guide To Measuring Core Web Vitals: Barry Pollard’s guide to measuring and fixing Core Web Vitals.