
Why “My App Is Slow” Reports Stall Out
When a customer reports slow performance, the evidence often hides below the surface. Consider an Android complaint that channel switching takes over 1.5 seconds. Server-side logs may show nothing unusual—the request itself completed quickly—but the user's perceived latency tells a different story. The gap between backend timings and what the client actually experiences is precisely where client-side tracing becomes essential instrumentation.
Distributed tracing is standard practice for multi-service backend architectures, but applying the same technique to mobile and desktop clients unlocks a different view: full visibility into every phase of a client operation, from queueing to parsing to local database writes.
From Raw Request to Full Latency Breakdown
The initial step was to wrap API calls in a client-side span called api:request. Gaining visibility into total request duration answered the basic question of what the user waits for, but it did not reveal where delays originate. To distinguish between causes, we expanded the single span into three distinct phases:
api:queue_time: Duration spent waiting in the client's request queue before execution begins.api:http_request: Duration of the actual HTTP exchange, ending when the raw response payload arrives from the server.api:parse: Duration spent converting the raw response into the object returned to the caller—a dictionary, a strongly typed model, or a platform-specific representation.
Each completed phase carries metadata: the endpoint, HTTP status code, and payload size in bytes.
This structure allows an engineer to determine whether API slowness stems from system load, the parsing layer, or the network itself. Since distributed tracing is built to link spans across machines, we propagate trace identifiers through HTTP request headers. Client and server spans then coalesce into a single trace. This combined view reveals which endpoints are slow to parse on the client, which suffer from network or backend congestion, and how system load impacts the API layer. Consistent with our backend strategy, we sampled 1% of API requests across all clients—sufficient to catch regressions on new endpoints without flooding our log pipeline.
Database Transactions: The Hidden Performance Driver
Modern clients are not thin request/response intermediaries. They maintain local caches and support offline workflows atop full-featured SQLite databases. Monitoring database performance in production previously proved difficult. Tracing structures the problem along the transaction lifecycle, which mirrors the api:request breakdown:
db:wait: Time waiting for access to the database when it is locked by a previous transaction.db:execute: Time spent reading and writing records. This phase regularly catches unrelated business logic that accidentally sneaks inside the transaction and backs up the database queue.db:save: Time required to commit dirty changes to disk; reflects the volume of modifications made during the transaction.db:perform_transaction: The aggregate wait, execute, and save duration.
The iOS implementation wraps a block: code inside runs after the transaction opens, and when the block returns, all changes commit atomically. Throwing an exception instead triggers a rollback with no changes persisted.
A Client-Native Tracing API
Our existing span event format measures latency events, so we deliberately designed a customized client API rather than adopting a generic standard. The ubiquitous approach of coupling trace context to thread-local storage breaks on mobile, where concurrency means an operation routinely hops across multiple threads. Our API avoids implicit state; it relies on explicit context passing that is safe across thread boundaries and works well with the language constructs native to each platform.
The code surface begins with a Tracer object. The tracer creates a new trace and stars the clock, returning an object that adheres to the Spannable protocol. Spannable defines something that can be started, completed, or cancelled. Request sampling also happens in the tracer: if a trace is not selected, the return value is nil. Once the measured action finishes, code calls complete(), passing any metadata that should upload with the span.
Mobile introduces a nuance the server side never encounters: applications can be backgrounded at any moment, putting the process to sleep without an explicit hook from the operating system. Without handling, this produces outrageous outliers. Internally, we finalize every open trace when the app goes to background and flag each with _background_flush : true, signaling to tooling that the trace is incomplete.
To keep instrumentation cost low at the call site, each Spannable instance exposes a TraceContext. Because child span creation flows through a separate object, APIs can add subspans without being able to complete the parent span invisibly. Explicitly using TraceContext rather than reading a global or thread-local variable keeps operations safe when handed between threads.
Adoption is eased further by integrating TraceContext directly into common infrastructure libraries—networking and persistence particularly—so typical consumers get tracing without writing dedicated glue code.
Real usage from iOS shows how these pieces fit together in a method that updates a workspace's unread channel state and mention counts: the operation performs one API call, parses the result, writes it through a database transaction, and reports the total duration in spans that capture each substep for analysis.
View Load Traces
Loading views is the most common interaction in any user-facing app, and it needs to be fast. As a messaging app, we started with our most important screen: the channel view. Our goal has always been to show whatever is in our cache as quickly as possible, then asynchronously fetch the latest content from the server — a pattern we've detailed in our prior work on unified cross-platform performance metrics. Tracing lets us go further by explicitly modeling this flow.
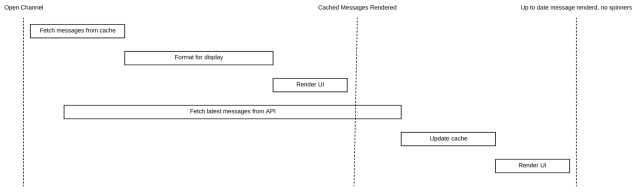
This "render cache, fetch fresh" pattern applies to most screens, so we built a general-purpose schema called a View Load Trace. It consists of three spans:
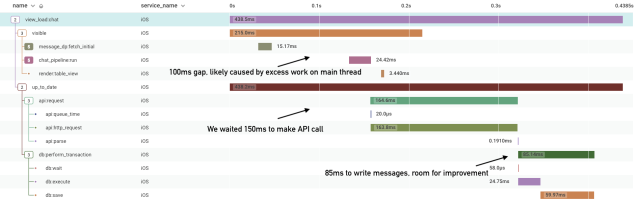
- view_load:<feature_name>: The root span, completed when both
visibleandup_to_datefinish. Examples includeview_load:chatandview_load:all_threads. - visible: Time until meaningful content renders. For
view_load:chat, this is when messages appear on screen. Spans for local cache queries and UI rendering live here. - up_to_date: Time until the view has fresh server content. Network fetch spans belong here.

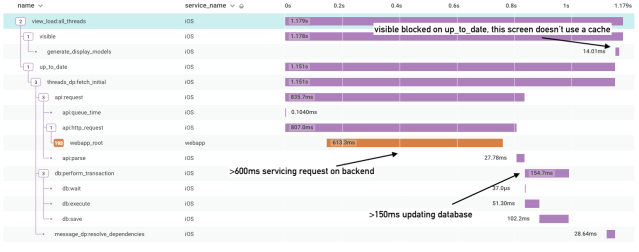
With this schema, we built a new ViewLoadTracer to implement the spec and used it across many screens. Injecting the TraceContext into our existing persistence and networking services made these traces invaluable for spotting bottlenecks in multi-source fetch and render paths.
Measuring Actions and Reliability
Next, we tackled user actions like sending a message or adding a reaction. These traces are straightforward: start when the user hits "Send", finish when the posting API call completes. Combined with database and API tracing, we get a complete picture of the interaction.
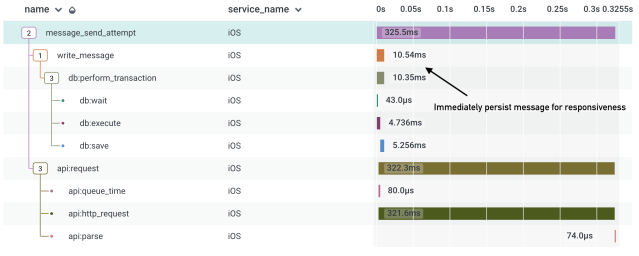
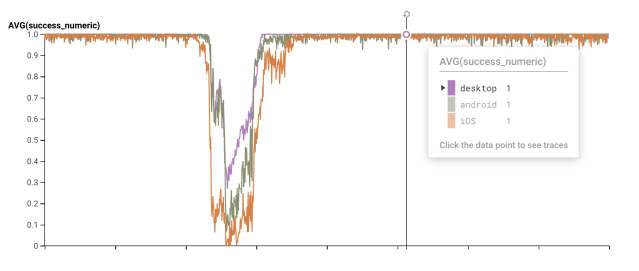
We suffix these traces with _attempt to emphasize reliability. Adding a success tag to every trace gives us client-side reliability metrics that complement server-side incident metrics. An API might fail 50% of the time, but if client retry logic masks it, the user never sees a problem. Tracking reliability as the user experiences it paints a more accurate picture of product behavior.
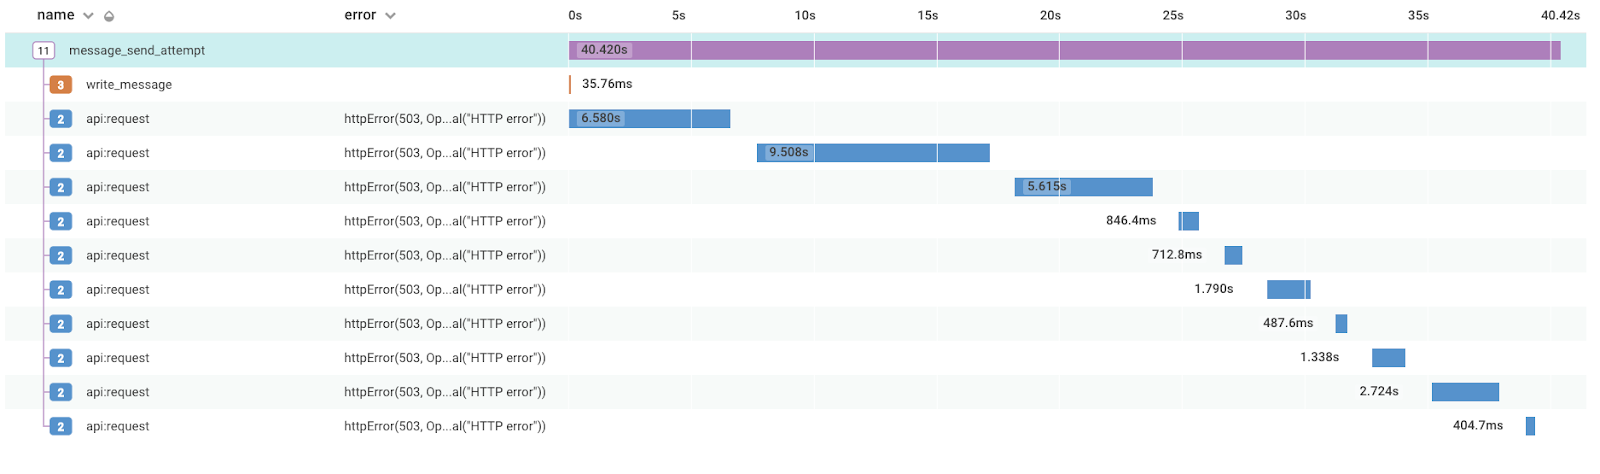
Tracing also reveals how clients behave during incidents. The example below shows a trace from an incident simulation: ten API calls in a 40-second window with little pause between them — all returning 503s. That behavior compounds server overload, so we updated our logic to use exponential backoff.
Getting More From Individual Spans
Slow spans are hard to diagnose. Adding more child spans isn't always the answer — too many spans get expensive and confusing. Instead, we attach useful metadata to the spans we have.
Dropped Frames
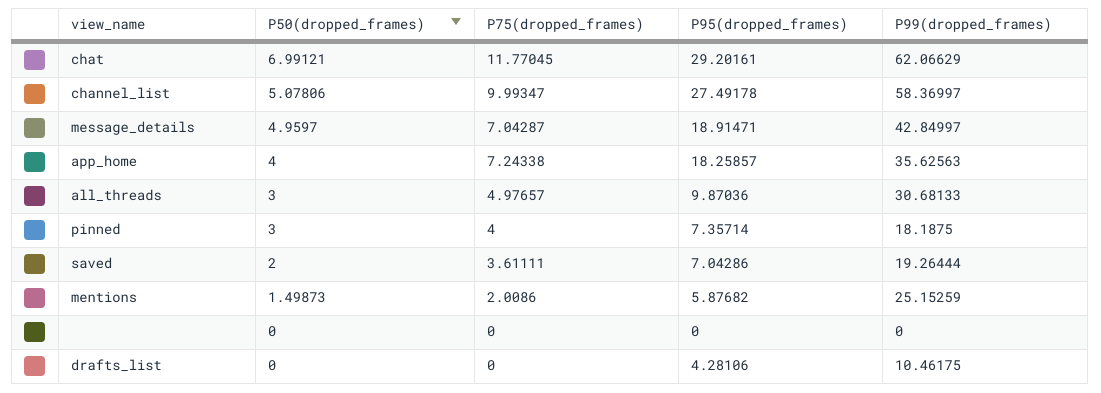
Unexplained gaps between spans often point to main-thread contention. We used to assume this, but now we verify it: every trace is automatically tagged with the total number of dropped frames during its execution. A dropped frame means the main thread exceeded 16ms of work, which correlates with choppy UI. Since tags are independently queryable, we aggregate dropped-frame percentiles across traces to identify which view loads are main-thread-bound and prioritize our optimization work.

Database Transaction Metadata
Database tracing was illuminating, but lacking transaction context made it hard to explain why some users were slower. Recording individual SQL calls wasn't feasible for operations making hundreds of them. Instead, we decorated database transactions with tags counting how many times each table was read or written.
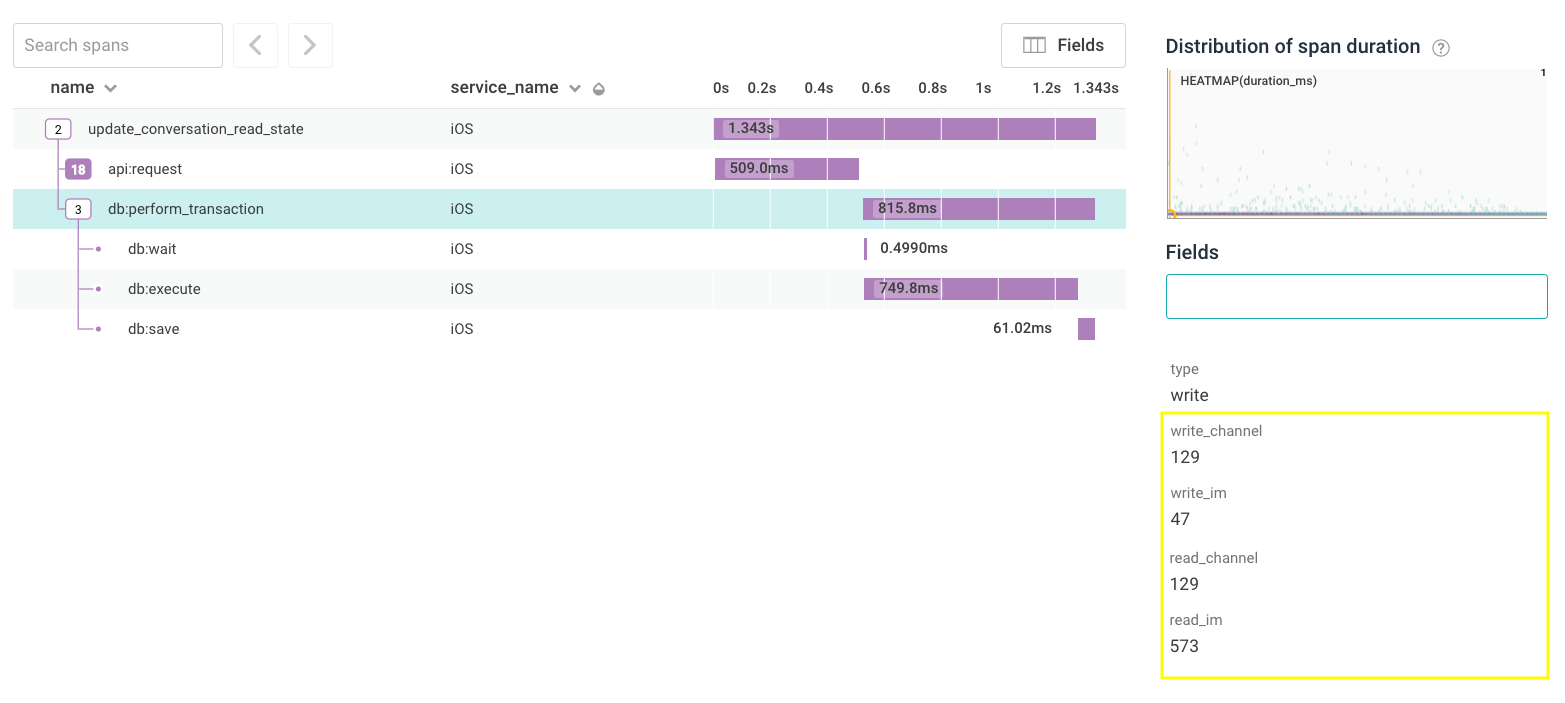
This paid off immediately. Some users took far too long to update their channel list. Inspecting the trace showed the expected flow: one API call, one DB update. But the details exposed an issue: though the user belonged to 129 channels and all 129 were updated, the app fetched almost 600 direct messages from the database even though we only updated 47. The app was loading every conversation the user had ever had just to show a handful in the channel list. Fixing that cut p95 latency for these cases by nearly 40%.
Tracing Complex Operations
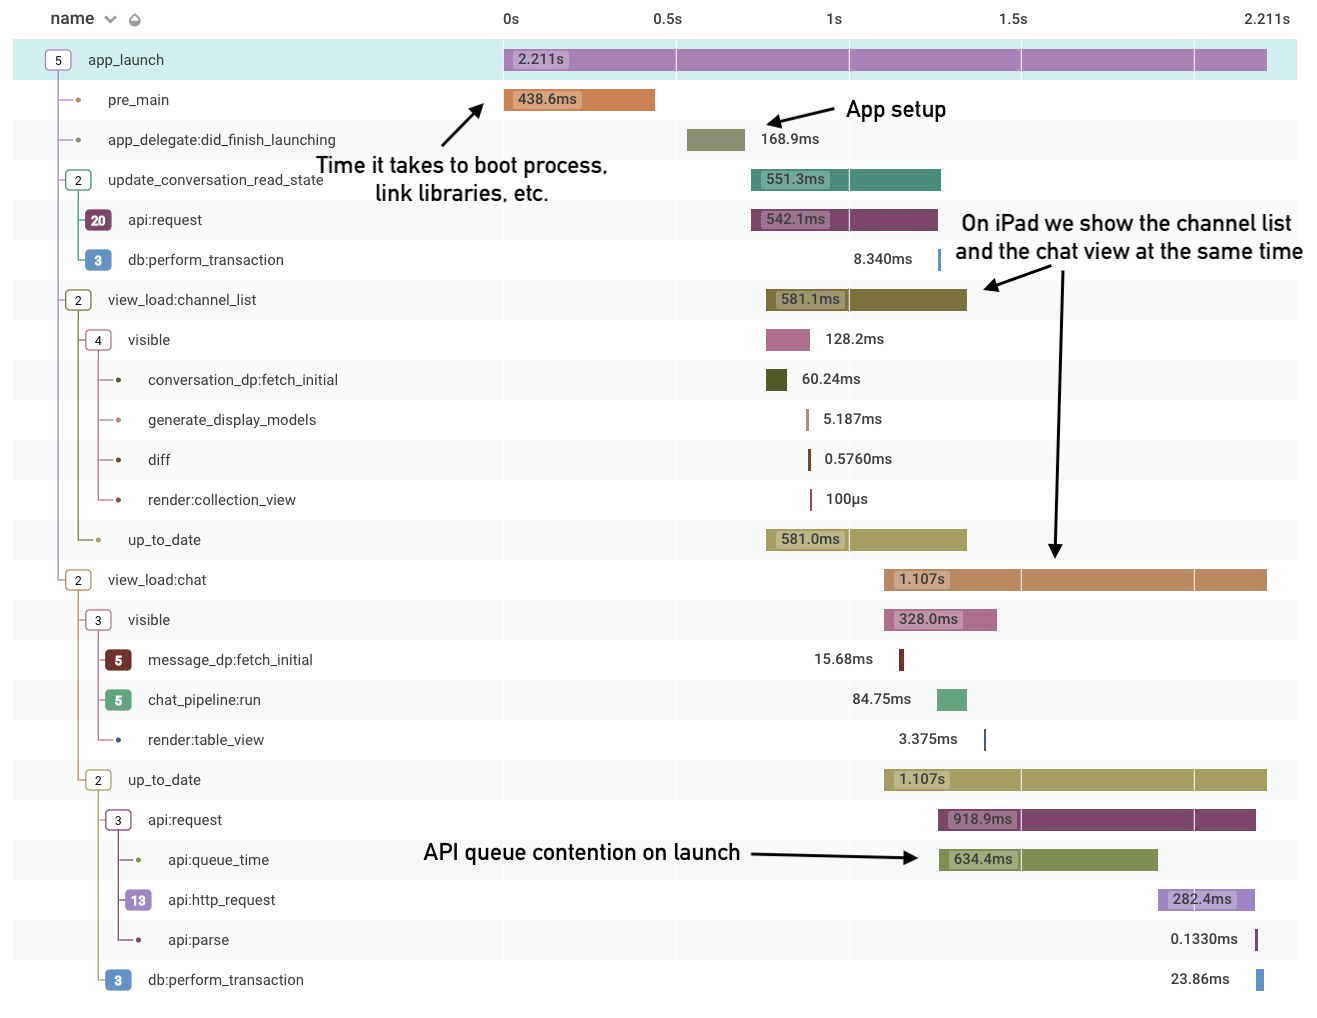
The examples so far are small, but tracing shines in more chaotic scenarios. Our launch trace is a prime case: we define launch as complete when the view load times for all views on the initial screen are done. Traditional profilers show CPU time by function, but tracing reveals how concurrent operations interact — pre-main time versus the rest of launch, how many views get created, and even how API queue contention slows boot.
Conclusion
Tracing brings causality to client logs, making them actionable in a way simple events never were. Modeling common actions like API calls, database writes, and view loads creates consistent, interpretable traces. With over a billion logs per day across nearly 100 distinct traces, our developers have a deep understanding of application performance in the wild — and we're just getting started.



