

Network Diagnostics Get a Boost Across Browsers
DevTools teams have been shipping steadily since the last roundup, with each browser closing feature gaps and introducing original tooling. Chrome's Recorder panel is the headline feature, while Edge experiments with a redesigned UI, and Safari refines its CSS editing tools in the Technology Preview channel.
Chrome's Recorder and Accessibility Experiments
The new Recorder panel tackles the tedious workflow of manually replaying navigation steps while investigating bugs or measuring performance. After recording a user flow, you can replay it with performance measurements enabled, ensuring every test run executes the same scenario. The team is collecting feedback through a Chromium issue, with full documentation available here.
Chrome has also been experimenting with a full-page accessibility tree view. Browsers construct an accessibility tree alongside the DOM tree for assistive technologies, and understanding how markup shapes this tree helps developers write more accessible pages. The experiment lives in the Accessibility sidebar panel of the Elements panel: check "Enable full-page accessibility tree" and a new button in the top-right corner of the DOM tree lets you toggle between both views. More details and feedback channels are available on the Chrome blog and the bug tracker.
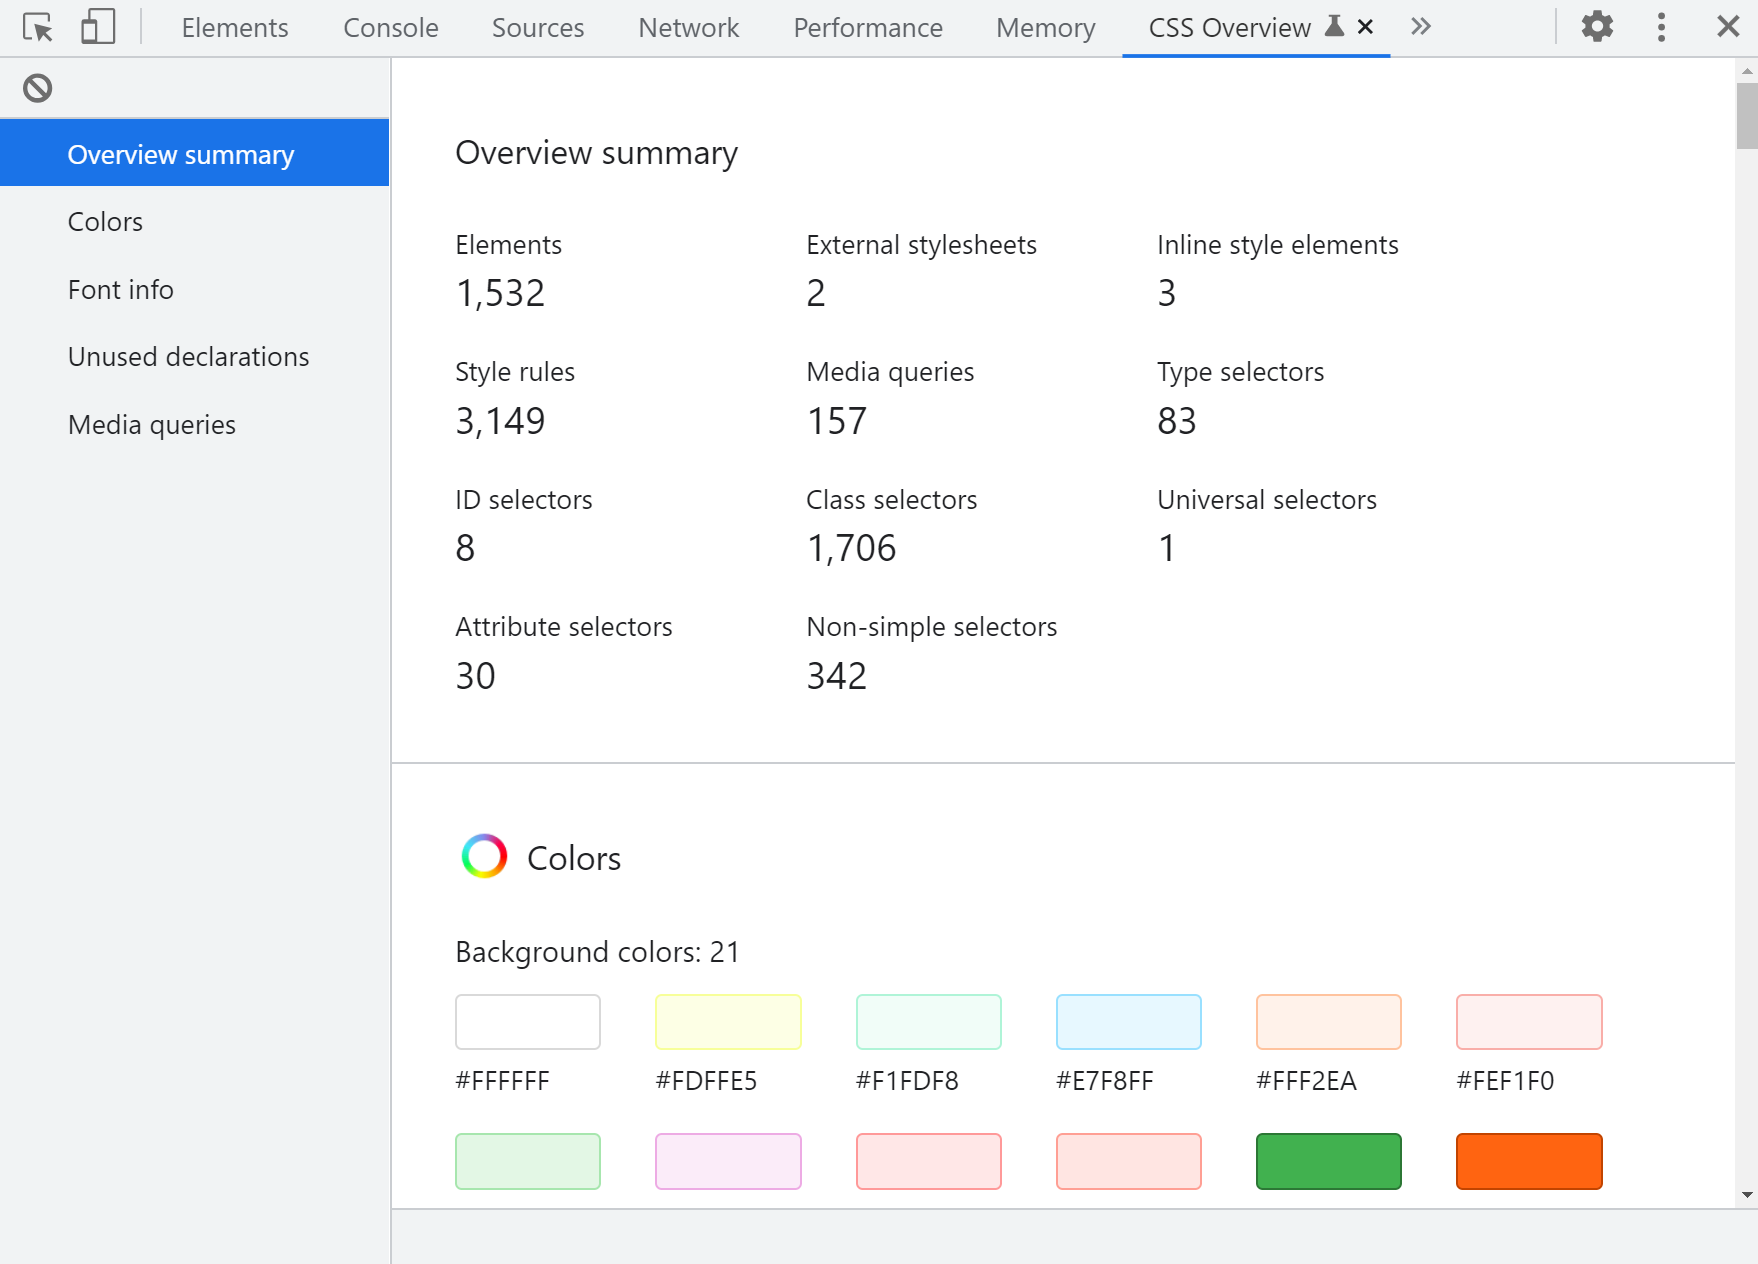
Meanwhile, the CSS Overview panel has left experimental status. Previously hidden behind a DevTools settings flag, it now ships as a regular feature accessible via … > More tools > CSS Overview. The panel surfaces potential issues such as contrast problems and unused declarations, making it a handy tool for quick CSS audits. With over 30 panels now available in Chrome DevTools, the docs are worth consulting when exploring unfamiliar tools.
Edge: Detached Elements and A New DevTools Shell
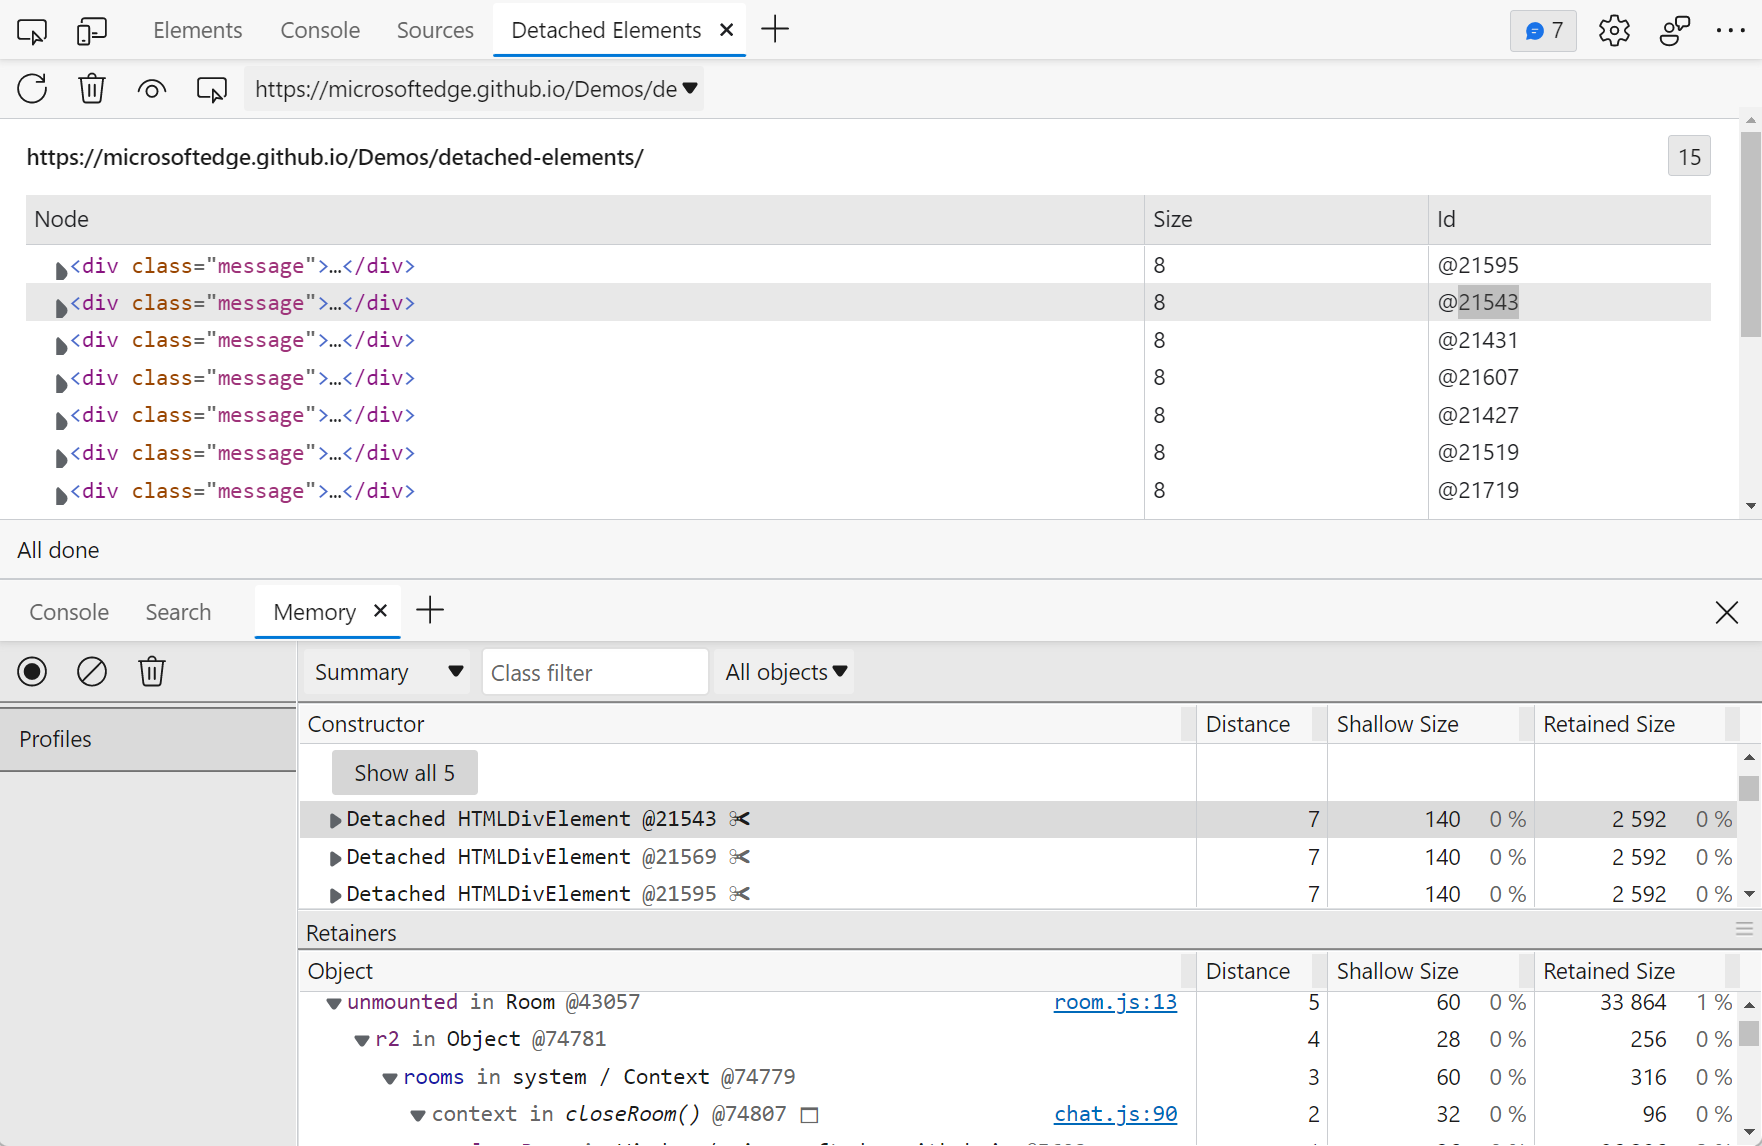
Long-running web apps often suffer memory leaks caused by detached DOM elements — nodes that were removed from the document but never cleaned up. Edge's new Detached Elements tool helps identify these leaks by examining the elements and their JavaScript references. When an app's memory footprint grows over time, this tool can quickly direct you to the culprit elements. The announcement post and docs cover the details.
Edge is also rethinking the DevTools interface itself. User studies by the team found that the traditional panel-heavy layout overwhelms newcomers while experienced developers stick to one or two familiar workflows. The experimental Focus Mode responds to this with an activity bar, simpler tool add/remove interactions, a quick view drawer, and redesigned menus. It's enabled in Settings > Experiments > Focus Mode, and the explainer document describes the design rationale.
Safari's CSS Quality of Life Updates
The Safari Technology Preview channel updates every two to three weeks, offering early access to features destined for the bi-annual Safari releases. Recent Web Inspector changes focus on improving day-to-day CSS editing workflows.
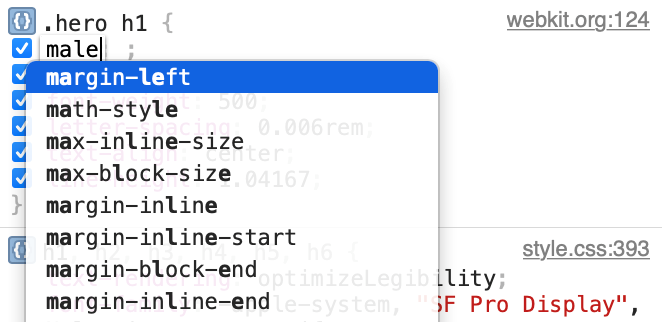
Fuzzy auto-completion has arrived in the Styles panel. Typing "pat" now suggests padding-top, and "bob" matches border-bottom — familiar behavior for anyone who has used fuzzy matching in VS Code or other editors.
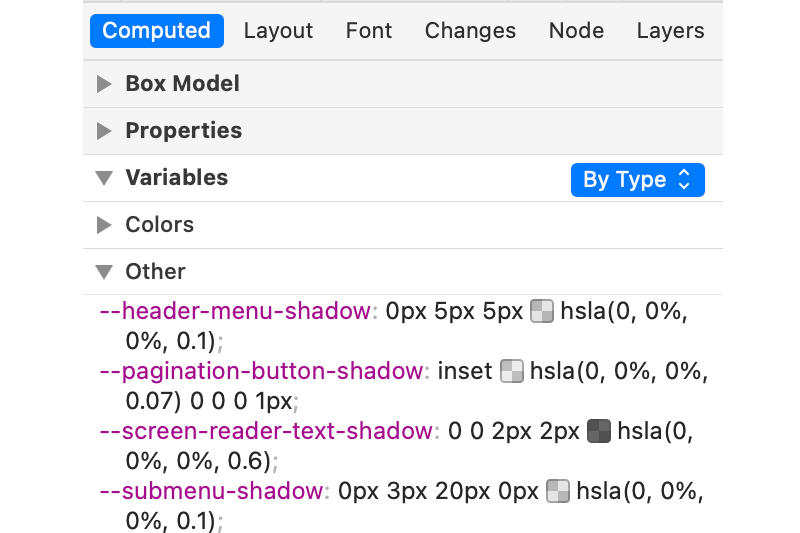
The Computed panel now organizes CSS custom properties inside a collapsible section, further grouped by value types so color variables cluster together. As sites and design systems lean increasingly on variables (custom properties), this declutters what had become crowded panes.
Finally, Safari Web Inspector added a visual alignment editor for flexbox and grid layouts. An icon next to align-content, align-items, align-self, justify-content, justify-items, and justify-self values in the Styles panel opens a picker for flex lines and grid tracks — echoing similar tools that Chrome and Edge have had, with Safari's binding for adjust and focus on its own pane.
Firefox Gets Back to Shipping Features
After a long period focused on re-architecting its DevTools code base — a process that slowed down new feature development — Firefox is now back with a series of improvements. The re-architecture is complete, and the team is once again delivering user-facing changes.
Target Code Execution in the Console
Modern sites often involve multiple execution contexts, whether from iframes or web workers. Since each of these runs in a different process, reaching them from DevTools can be tricky.
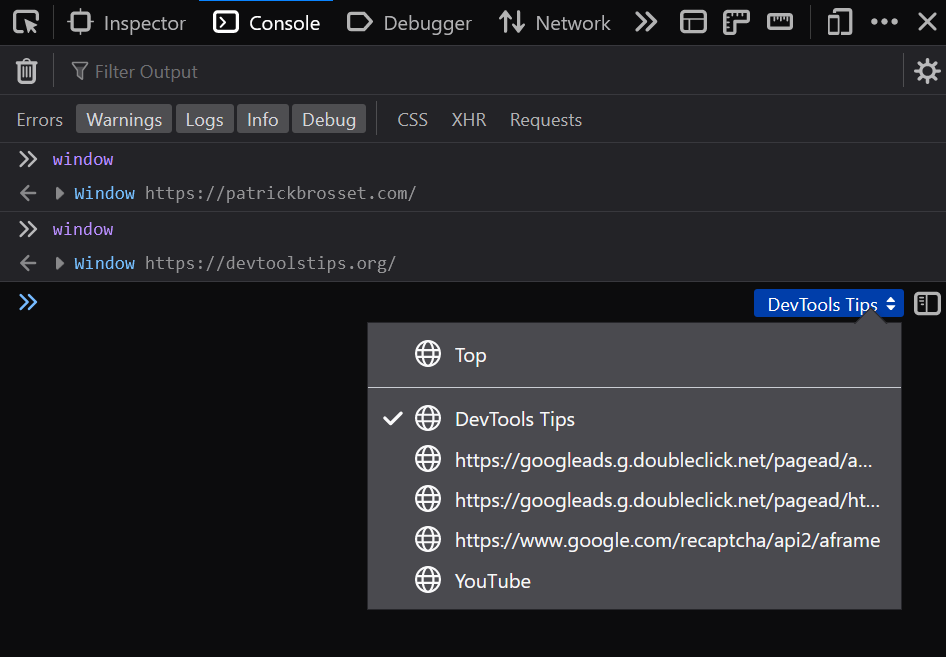
Firefox’s Console now includes a context selector, letting you pick exactly where the code you type gets executed. For instance, if you need to inspect the value of a global variable defined inside an iframe, you can switch the selector to that iframe instead of working around the limitations.
Inspector Improvements
The Inspector now recognizes the hwb() CSS color function from the CSS Color Module 4 specification. This function specifies colors using three values: hue, plus amounts of white and black to mix in for the final color. It is already supported by Safari and Firefox. With this update, the Inspector treats hwb correctly, and an added bonus: when using the keyboard to increment or decrement the W and B values, they are automatically clamped to stay between 0% and 100%.
The Inspector also gains a feature that Chrome and Edge have had for a while — selecting elements with pointer-events: none. Because the element picker relies on mouse interaction, elements with that CSS property were previously unselectable. In Chrome and Edge, holding the Shift key while using the picker bypasses this restriction. Firefox now implements the same trick.
Toggle Event Listeners and Ignore Code Lines
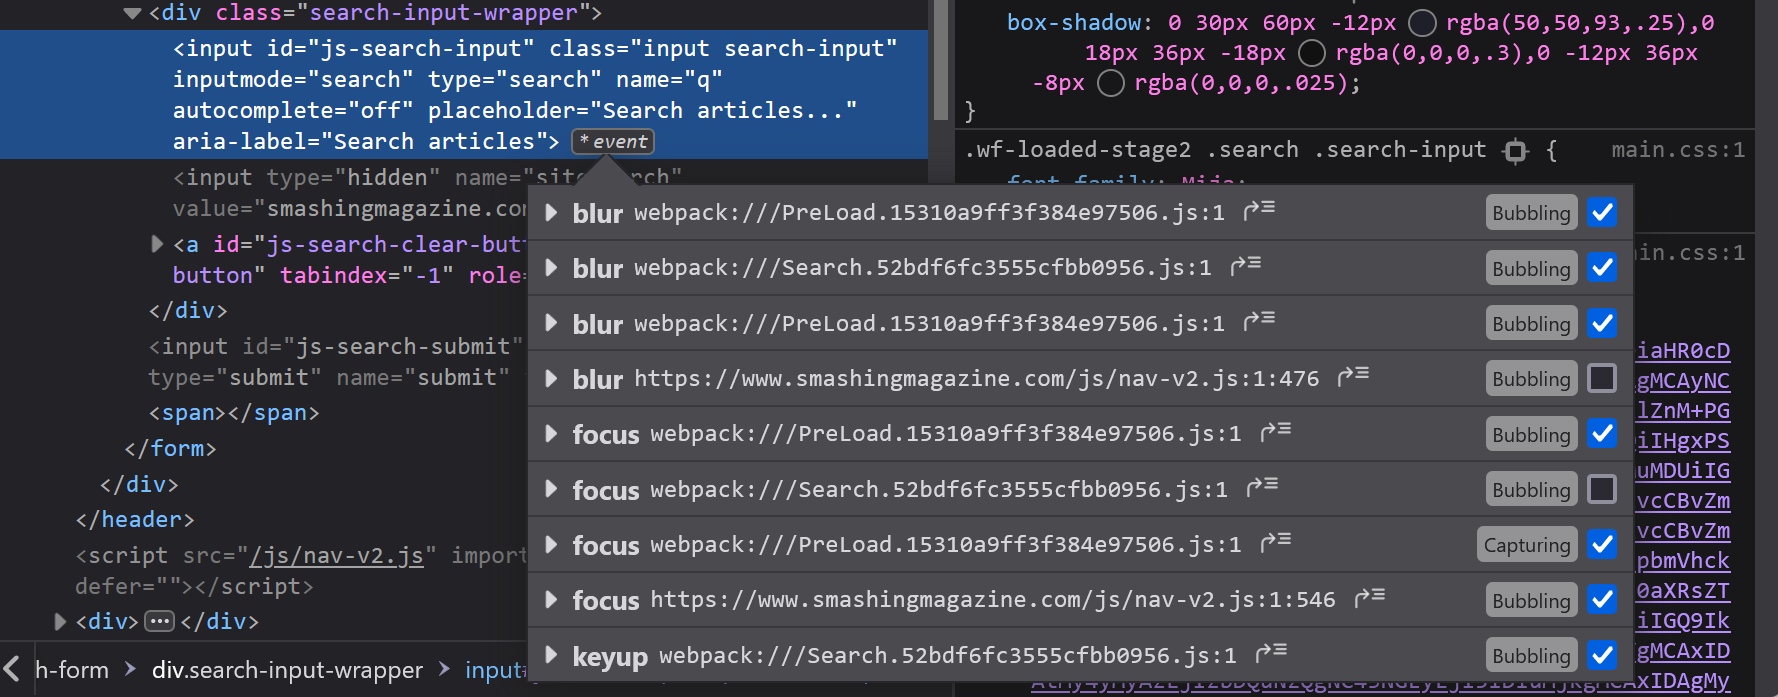
Debugging across browsers becomes easier as feature parity improves. Along those lines, Firefox has also shipped the ability to disable individual event listeners. In the Inspector, you can see listeners attached to an element by clicking the [env] badges. The resulting list now includes checkboxes, so you can toggle listeners on and off without removing them from the code.
In the Debugger, Firefox is moving beyond the existing "ignore a source file" feature, which lets you mark entire files — like framework bundles — so the debugger won't pause inside them. Now you can ignore specific ranges of lines within a file. This is helpful when a single file contains a utility function that gets called frequently; you can ignore just that function and continue debugging the rest of the file normally. It also proves useful with bundlers that put all your source code and libraries into one file.
At the time of writing, this feature is experimental. You need to set the devtools.debugger.features.blackbox-lines boolean to true on the about:config page. After enabling it, right-click on any line of code and choose Ignore line.



