
Why Classic Tracing Misses the Point at Slack
Diagnosing why a channel with hundreds of thousands of users loads slowly requires correlating client-side metrics, server-side logs, and network behavior. Slack already uses Prometheus for aggregated metrics and Elasticsearch/Presto for log queries, but neither gives granular insight into why a specific request underperformed. Logs contain the necessary context but lack visibility into what happened before or after a given event.
Distributed tracing is the standard answer for stitching requests across services, but prior experience made Slack hesitant. As Cindy Sridharan documented, the cost of building and operating a tracing solution often isn't justified by what you get from a trace UI. Existing frameworks also assume backend services written in high-level languages, making them a poor fit for client applications and shell scripts. Slack wanted more: the ability to run ad hoc SQL queries on raw trace data, mirroring the insights Twitter gained from trace analytics.
The solution Slack built models traces as causal graphs — directed acyclic graphs of a data structure called SpanEvent. This post covers the motivations and architecture behind that system.
The Standard Tracing Stack
Without tracing, triaging an incident means manually reconstructing the chain of events across services from logs and metrics. Once you have a representative request, the cause is usually obvious. Distributed tracing automates that correlation. A typical setup has three components:
- Instrumentation: An application is instrumented with a tracing library containing a sampler (deciding which requests to trace), a context propagation library (tracking requests across threads and services), and a span reporter (sending spans to an ingestion pipeline).
- Ingestion: The pipeline captures spans, optionally performs tail-sampling, and writes data to storage.
- Storage and visualization: Traces are stored for a retention period and viewed through a waterfall UI.
Zipkin and Jaeger are the most popular open source implementations of this model, and Slack's objections to them are instructive.
Where Existing Approaches Break Down
Request-Centric APIs Don't Fit All Workloads
OpenTracing and similar APIs are built around requests — operations with clear start and end points — in backend services with multithreaded execution models. That works well for gRPC calls. It breaks down for mobile apps and JavaScript frameworks where event loops invert control into application code. There's no natural request boundary, and forcing one requires complex workarounds that violate the abstractions these libraries provide.
Context Isn't Always Contained in a Request
Large parts of a build tool's dependency graph (npm, Maven), a CI/CD pipeline, or a shell script execution could benefit from trace analysis. But these don't follow the same execution model as a request-driven application. You might have multiple concurrent request flows (producer-consumer patterns over Kafka, goroutines, streaming systems) or need to track a single event across multiple flows. In either case, a single tracer scoped to one request context is a limiting abstraction.
Heavy APIs for Simple Cases
Where there's no notion of a request, a lightweight API is preferable. A minimal API that pushes context propagation responsibility to the application developer is easier to adopt incrementally in non-traditional applications.
createAndReportSpan(traceId, spanId, parentSpanId, serviceName, operationName, startTimeMicros, durationMicros, tagsDict);Span Formats Are Internal, Not Analytical
Zipkin and Jaeger each have their own span schema with deeply nested metadata intended for machine consumption, not human analysis. Producing spans directly from an application would expose developers to confusing design decisions:
- Annotations and logs in both systems are zero-duration events that would be child spans if they had duration.
- Jaeger spans don't store the service name — that lives in a separate process object.
- Trace IDs are represented as two 64-bit integers purely as a storage optimization.
- Zipkin embeds network endpoints on annotations and binary annotations, making the format network-centric by default.
Raw Data Isn't Queryable
Traces contain rich causal and contextual information, but span formats make interactive analysis difficult. Asking "Am I missing my SLA because of slow DB queries on a specific HTTP endpoint?" requires writing custom Java programs — a multi-day effort. Without a straightforward way to query raw trace data, users are limited to whatever the trace UI shows them, which drastically reduces the value of trace data for real-time triage.
Slack's experience matches the broader industry pattern: tracing systems are adopted with enthusiasm, then abandoned once the complexity of extracting insights outweighs the benefits. That's why adoption of tracing lags behind containers, centralized logging, and service meshes.
Design Goals for a Better System
Given those limitations, Slack set explicit goals for its tracing investment:
- Work beyond backend systems, including mobile and desktop clients and async services.
- Keep simple use cases simple with a lightweight API, while supporting complex request interactions across services and languages with high-level APIs.
- Make traces genuinely useful for real-time incident triage and performance regression analysis, justifying the return on investment.
- Enable direct querying of raw span data — across spans from different traces or spans within one trace.
- Provide a visual query language for trace exploration and an intuitive UI for visualization.
The Causal Graph Model
Underneath every trace is a directed acyclic graph of linked events called spans. That structure gets buried under higher-level APIs and UI abstractions. Slack's causal graph pulls that structure to the surface, making it queryable and adaptable to a wider range of use cases.
A causal graph is a DAG of SpanEvents. Each horizontal rectangle in the diagram below represents one SpanEvent. The first SpanEvent with no parent is the root. Each SpanEvent can be a child of another, optionally carry tags, and — critically — a child SpanEvent can extend beyond the duration of its parent.
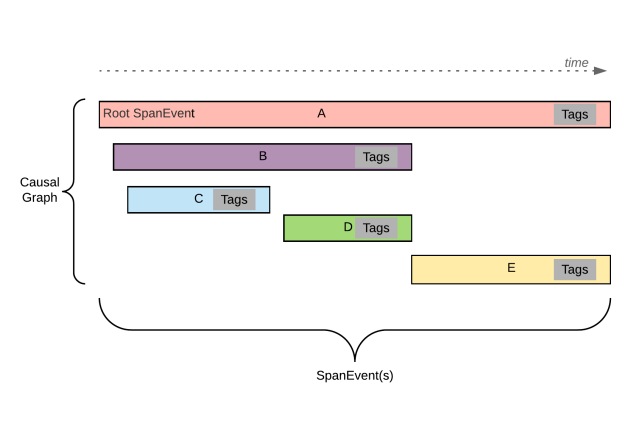
Figure 1: A sample causal graph. Each horizontal rectangle represents a SpanEvent; children can extend beyond their parent's duration.
Facebook's Canopy also defined a custom event format to represent traces. Slack sees the causal graph and SpanEvent as an evolution of that format — one that eliminates the model reconstruction phase from the ingestion pipeline entirely. By treating SpanEvents as the fundamental building blocks of trace data, Slack makes the raw data directly consumable for analytics and querying, which addresses the core problem: getting actionable insight out of complex distributed systems without building custom tooling for every question.
SpanEvents: The Building Blocks
At the core of Slack's tracing pipeline is the SpanEvent, a data structure designed to represent a single unit of work within a causal graph of related operations. Each event carries an ID, timestamp, duration, parent ID, trace ID, name, type (usually a service name), and a set of typed key-value tags. A span type field distinguishes whether the event represents a client, server, producer, consumer, annotation, or other kind of operation.
The team deliberately treats SpanEvent as a lower-level primitive than a traditional tracing span. There are no restrictions on the data it can hold; correctness is enforced by higher-level tracing APIs or by the applications that produce the events. This makes the format akin to an intermediate representation in a compiler: you can emit raw events directly, or use convenient APIs that generate them for you. The structure is meant to be readable by humans, not just machines.
A few design decisions stand out. First, SpanEvent avoids deeply nested structures. Annotation-like data is represented as child spans with a specialized span-type tag, which keeps filtering simple at query time without requiring complex SQL. Second, durations are stored directly rather than as start and end timestamps, eliminating needless subtraction when consuming events. Third, spans may have zero duration or even empty IDs, and a root span doesn't have to match the full trace duration. Encouraging single-span traces is deliberate: it allows queries on older data to remain valid when new child spans are added later, since each event is self-contained.
Every piece of metadata on an event is a tag, not an optional field. Reserved keys and typed values cover well-known attributes, while any machine-consumable reference—such as links to other spans—is expressed either as a tag or as a specialized child span. This uniform approach simplifies both production and querying.
Producing and Querying Span Data
There are several ways to create and report SpanEvents. The most basic is to build a protobuf or JSON payload from code and pass it to the backend via a createAndReportSpan call. The same can be done from a shell script with a curl command, which makes adding instrumentation as easy as writing a log line—a path Slack's mobile apps and scripts take frequently.
curl -X POST -H "X-Slack-Ses-Id: 123455678" -d '[{                                                                    "id": "bW9ja19zcGFuX2lk",
 "parent_id": "bW9ja19wYXJlbnRfaWQ=",
 "trace_id": "bW9ja190cmFjZV9pZA==",
 "name": "pizza",
 "start_timestamp_micros": 1565045962061019,
 "duration_micros": 2000,
 "tags": [
   {"key":"topping","v_type":0,"v_str":"xtra_cheese"},
   {"key":"service_name","v_type":0,"v_str":"pizza_time"}
 ]
 }]' https://internal.slack.com/traces/v1/spans/json
For Hack and JavaScript, Slack built OpenTracing-compatible tracers that emit the SpanEvent format natively. Go and Java applications rely on the Jaeger and Zipkin Brave open source instrumentation libraries, with adapters converting those spans into SpanEvent format. Once the data is in the store, the query interface is plain SQL. SQL was chosen for its ubiquity, flexibility, and broad storage backend support, and it proves well suited to both lightweight exploration and involved analytical queries.
Architecture in Practice
The pipeline is built around an internal HTTP gateway called Wallace, written in Go. It runs independently of the rest of Slack's infrastructure so that tracing can continue capturing errors even during an outage. Wallace validates incoming SpanEvents and forwards them to Kafka through Murron, Slack's in-house event bus that routes logs, metrics, and events to storage backends.
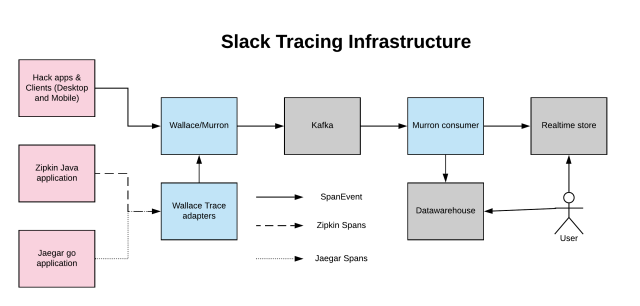
Internal Java and Go services report traces using the native Zipkin and Jaeger endpoints. Wallace exposes trace adapter endpoints that translate these spans into SpanEvent format before writing them to Kafka. Once in Kafka, a lambda architecture takes over: a Murron consumer reads the events and streams them to two destinations—a real-time store and a data warehouse.
The real-time store, visualized with Honeycomb, gives near-immediate visibility with under five seconds of end-to-end latency. It is the primary surface for triage. The data warehouse lags by roughly two hours but supports Presto, enabling deep analytical SQL queries on longer time ranges. Engineers use it to surface long-term trends and answer questions that aren't practical in real-time tooling.
Production Scale and Benefits
In production for over a year, this pipeline traces requests end to end: from Slack's clients, through backend services, and into the storage layer. Coverage is sampled at 1% of all client requests, scaling to 100% for low-volume services. The current load is about 310 million traces and 8.5 billion spans per day, generating roughly two terabytes of trace data.
Besides request tracing, the system has been pointed at novel use cases like tracking websocket states in clients, monitoring Jenkins CI/CD pipeline runs, and mapping build dependency graphs to detect slow build stages. For targeted customer troubleshooting, the desktop client has a slash command that switches the client to trace every request for the next two minutes. The client team also repurposes SpanEvents as a generic format for reporting client logs to the backend, reusing the same ingestion path the traces take.
The causal graph model's payoff is representational: one row in the database per span. That simplicity invites direct, exploratory SQL queries. The team cites Twitter's trace storage, which splits data across six tables, as a contrast in trade-offs. Slack's schema sacrifices some storage efficiency for far easier analysis, and that accessibility has driven adoption.
Operationally, the trace data already supports questions that previously lacked concrete answers:
- What effect does a specific improvement have on user-perceived latency and errors?
- Is a slow client request caused by a backend delay?
- How do cross-region queries impact perceived latency, and by how much?
- What does a representative trace for an endpoint look like?
- Which memcache keys are hot, and what endpoints are generating them?
- Which async tasks run for a given request, and how long do they take?
Traces have grown into one of Slack's core methods for triaging and fixing performance issues, and they've been used to assess the user impact of deployments and incidents. The team measures the rollout's success against initial goals and reports that all of them have been met.
Roadmap
The next iteration will focus on a more powerful query language. Sampling is also on the list: today, large services sample 1–2% of requests across the board. Slack wants the ability to sample all requests for a designated cohort of users over extended periods, and is exploring adaptive strategies that vary sampling rates for different spans within a single request.
A longer-term target is unifying the separate infrastructures now used for traces, logs, and events. These systems currently duplicate a great deal. The team views tracing as the foundation to consolidate them into a single, unified pipeline built on the same causal graph model.



