Why Meta is moving to PTP
Meta's distributed systems have long relied on Network Time Protocol (NTP) for server synchronization, but NTP's millisecond-level precision is no longer sufficient. As Meta scales toward the metaverse, AI, and other advanced computing platforms, the company is deploying Precision Time Protocol (PTP) to achieve nanosecond-level clock synchronization across its infrastructure.
The motivation for PTP extends beyond simple clock accuracy. Consider a storage system where a client writes data and then reads it back immediately. In a large distributed deployment, the write and read often land on different back-end nodes. Without guaranteed ordering, the read might hit a replica that hasn't yet received the update, violating the linearizability guarantee that lets clients treat the distributed system like a single server.
The standard workaround is issuing multiple reads and waiting for a quorum decision, but that adds latency and consumes computing resources. With precise, reliable timestamps on back ends and replicas, a client can simply wait for the replica to catch up to the read timestamp. This approach speeds up reads and dramatically reduces compute overhead.
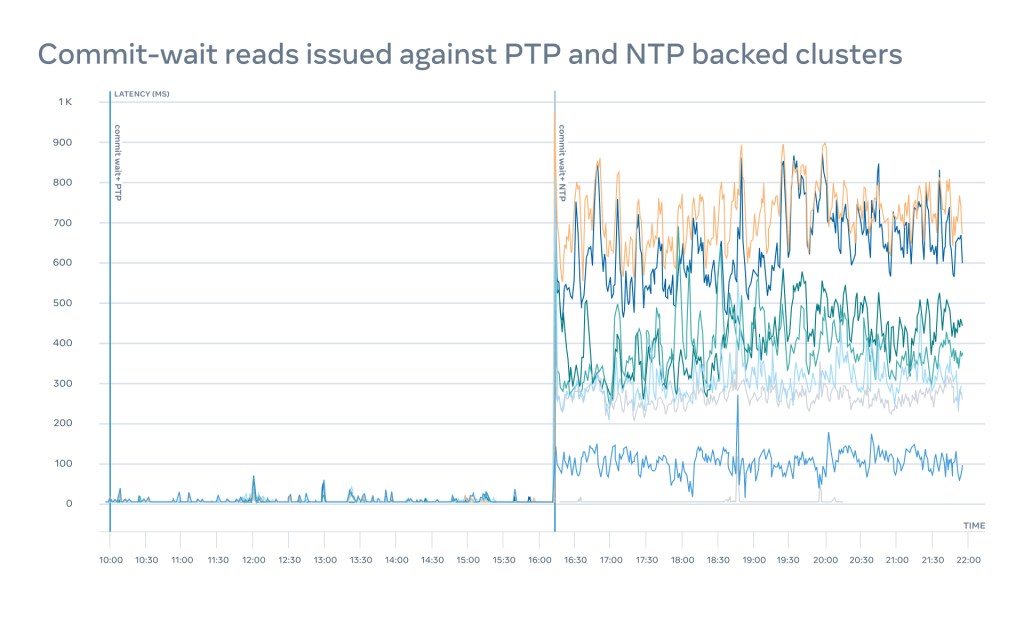
A critical requirement for this design is that all clocks stay in sync, or that the offset between any clock and the time source be known with high confidence. Because correction, drift, and temperature variations shift the offset constantly, Meta uses the notion of a Window of Uncertainty (WOU) to bound where the offset lies. A read is blocked until the read timestamp plus the WOU is satisfied.
NTP, in theory, could provide the same guarantee. But experiments comparing Meta's existing NTP implementation against an early PTP prototype showed roughly a 100x performance difference, making the case for PTP clear. Additional use cases include event tracing, cache invalidation, privacy violation detection, latency compensation in the metaverse, and simultaneous execution in AI — many of which will reduce hardware capacity requirements.
The PTP architecture at scale
Meta's PTP deployment is split into three main components: the PTP rack, the network, and the client. The PTP rack houses the hardware and software that serve time to clients.
The antenna
Time on Earth originates at the GNSS antenna, yet this component is often overlooked. Achieving nanosecond accuracy requires the GNSS receiver to determine its position precisely; a poor signal-to-noise ratio or an obstructed view of the sky results in high 3D location error. For receivers to enter time mode, they typically need a 3D error below 10 meters.
Meta tested several antenna solutions and adopted a newer GNSS-over-fiber technology. This approach has distinct advantages: it doesn't conduct electricity, being powered over optical fiber by laser, and the signal travels several kilometers without amplification. Indoors, it uses existing structured fiber and LC patch panels, simplifying distribution. Optical fiber signal delays are well defined at roughly 4.9 ns per meter, while direct RF-to-laser modulation and optical splitters add about 45 ns per box. End-to-end antenna delay is deterministic — typically a few hundred nanoseconds — and can be compensated on the Time Appliance side.
Time Appliance
The Time Appliance is the heart of the timing infrastructure — where time originates from the data center's perspective. Meta's commitment is to reliably support up to one million clients per appliance without degrading accuracy or precision. That dictated a close look at every component.
The Time Card
To guard against critical bugs or malicious attacks, Meta began diversifying at the time source itself. The Time Card design is FPGA-based, and Meta collaborated with vendors like Orolia, Meinberg, Nvidia, Intel, Broadcom, and ADVA under the Open Compute Project (OCP), all implementing time cards that match the OCP specification.
With Orolia, Meta developed oscillatord, disciplining software for different Time Card flavors. It has become the default tool for GNSS receiver configuration and monitoring — including satellite counts, GNSS quality, constellation availability, antenna status, and leap second data — as well as atomic clock configuration and monitoring, such as laser temperature and lock status. The data exported from oscillatord determines whether a Time Appliance should take traffic or be drained.
The network card
PTP packets travel over the packet network, and the NIC hardware timestamps every time-sensitive message. This means the NIC's PTP Hardware Clock (PHC) must be precisely disciplined. Simply copying clock values from the Time Card to the NIC with a tool like phc2sys is insufficient — experiments showed a loss of 1–2 microseconds traversing PCIe, CPU, and NUMA. Emerging Precision Time Measurement (PTM) technology will improve synchronization over PCIe as peripheral support develops.
In the meantime, Meta's NICs support PPS-in, so ts2phc first copies clock values, then aligns clock edges based on a pulse per second (PPS) signal. This requires a cable from the Time Card's PPS output to the NIC's PPS input.
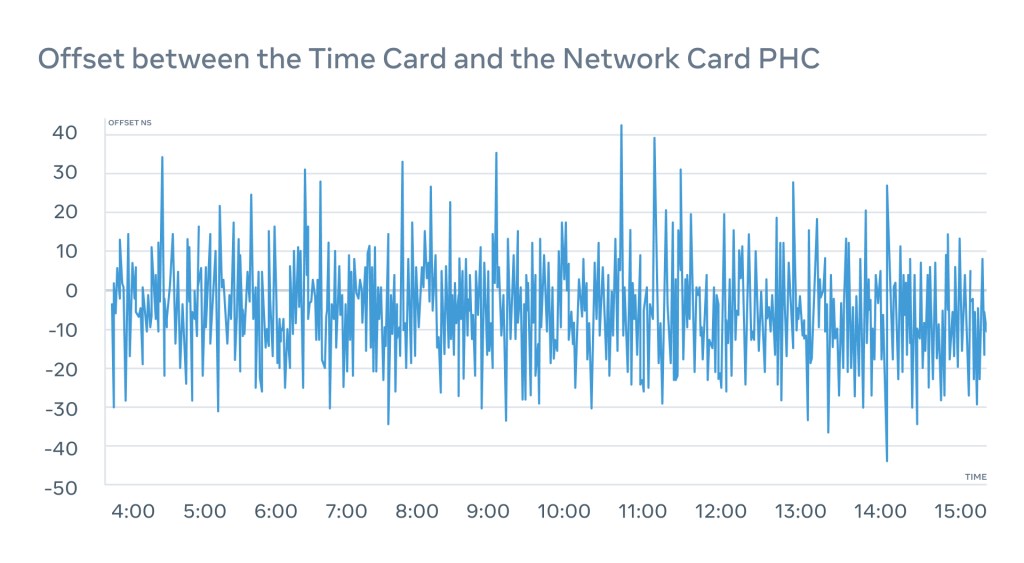
The offset between the Time Card and the NIC is constantly monitored and kept within ±50 ns. The NIC's PPS-out interface acts as a fail-safe, giving visibility into the actual PHC state.
ptp4u
When evaluating existing PTP server implementations, Meta hit scalability walls with both open-source and proprietary options — even FPGA-accelerated servers topped out around 50K clients. At Meta's scale, that meant far too many hardware racks.
Since PTP relies on hardware timestamps, the server software itself doesn't need to be a hyper-optimized C program or FPGA appliance. Meta implemented ptp4u, a scalable PTPv2 unicast server in Go, open-sourced on GitHub. With minor optimizations, it supports over one million concurrent clients per device, independently verified by an IEEE 1588v2 certified device.
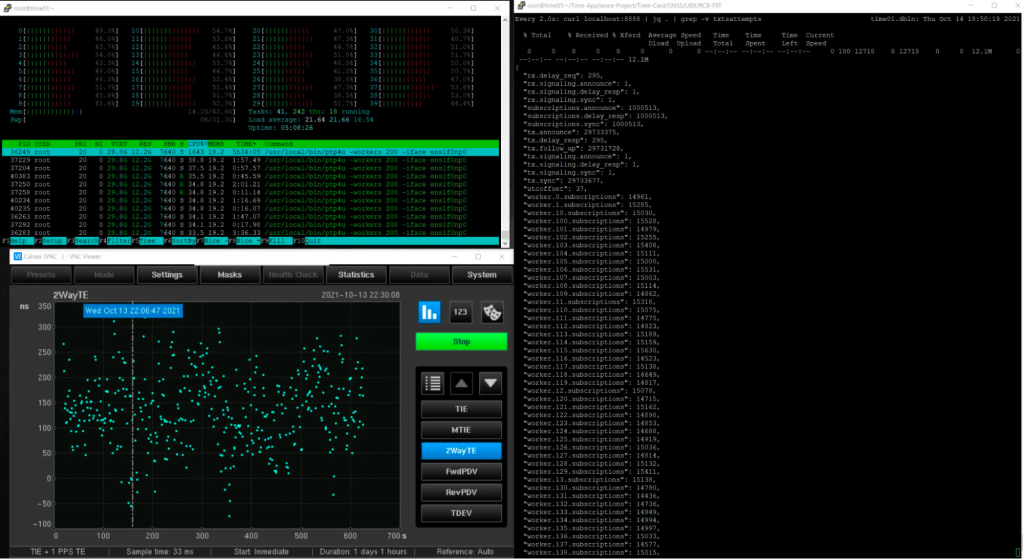
The design leverages Go channels to pass subscriptions between multiple workers. Running as a standard Linux process, ptp4u inherits IPv6, firewall, and other OS features for free.
c4u
ptp4u has many configuration options for dynamically changing parameters such as PTP Clock Accuracy, PTP Clock Class, and the UTC offset — currently 37 seconds. A separate service, c4u, monitors various data sources and compiles the active configuration for ptp4u.
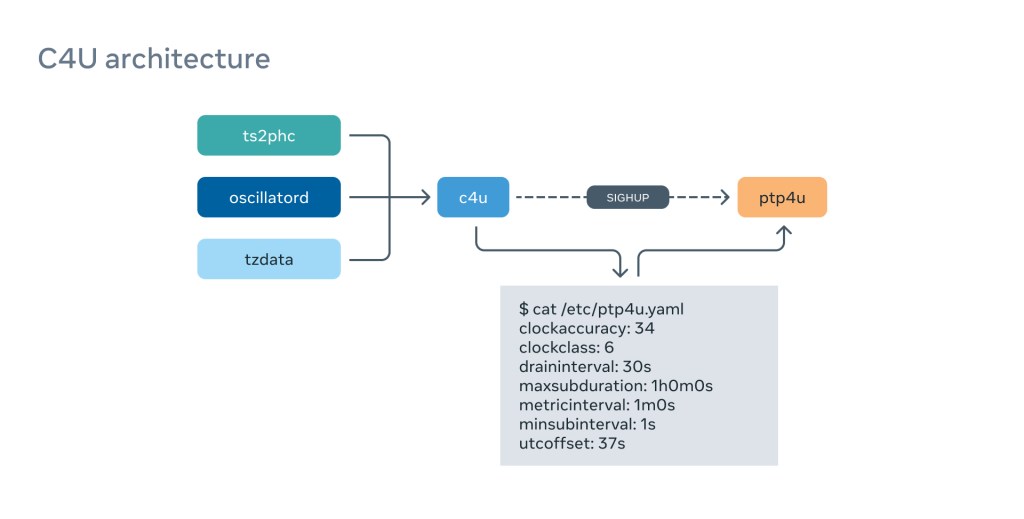
If the GNSS signal on a Time Appliance is lost, c4u switches the ClockClass to HOLDOVER and clients immediately migrate away. ClockAccuracy is computed from multiple inputs, including ts2phc synchronization quality and atomic clock status. Since Meta passes International Atomic Time (TAI) to clients, the UTC offset is calculated from the tzdata package.
Independent monitoring
Meta wanted continuous, independent assessment of its Time Appliances using a certified monitoring device. Building on earlier collaboration with Calnex in the NTP space, Meta worked with Calnex to adapt their field device for data center use: changing the physical form factor and adding IPv6 support.
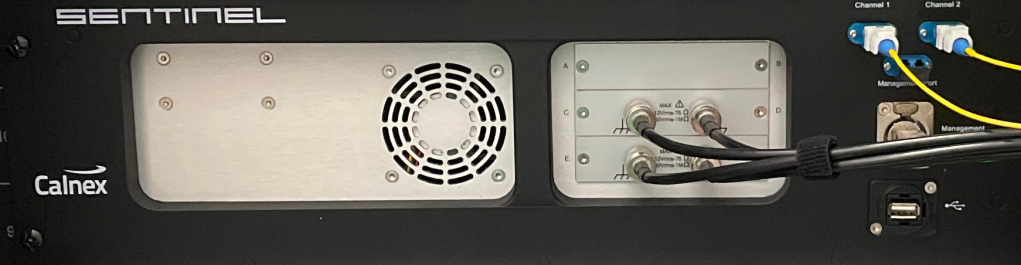
The Calnex Sentinel connects to the Time Appliance NIC's PPS-out, monitoring the PHC with nanosecond accuracy.
Running PTP over unicast
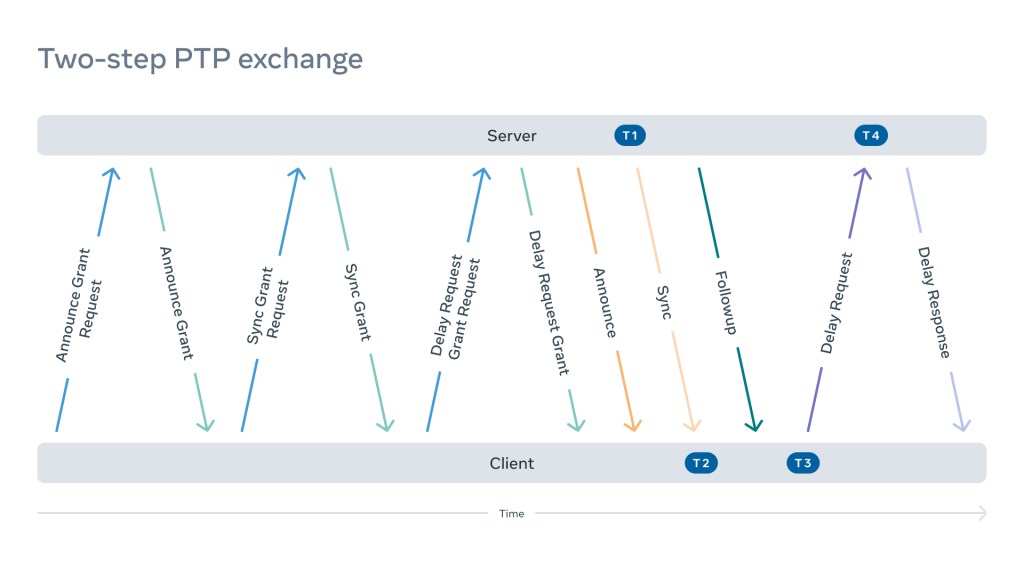
In large data center deployments, PTP is run in unicast mode rather than multicast. This design choice simplifies both the network architecture and the software required to manage it. A typical unicast session begins with a client initiating a negotiation with a time server, requesting three independent subscriptions:
- A Sync Grant Request for a specified number of Sync and Follow-Up messages per second for a set duration.
- An Announce Grant Request for periodic Announce messages carrying the server's status.
- A Delay Response Grant Request, which authorizes the client to send Delay Requests and receive corresponding Delay Response packets.
The server must grant each request, then start fulfilling the subscriptions by sending the negotiated PTP messages at the agreed intervals. Each subscription is handled independently, and it is the server's responsibility to respect the send interval and terminate the subscription upon expiry — a remnant of PTP's multicast origins. In a two-step configuration, the server must capture the TX hardware timestamp for each Sync message and send it in the subsequent Follow-Up message.
The client then sends Delay Requests within the agreed window to measure path delay. The server reads the RX hardware timestamp for each incoming request and returns it in the Delay Response. Periodically, the client refreshes the grants, and the cycle repeats.
Why transparent clocks?
Boundary clocks were considered initially, but they introduce significant complications:
- They require dedicated network equipment or special servers to function.
- Each boundary clock acts as a time server itself, demanding strong short-term stability and holdover performance.
- Special protocol support is required to propagate timing information from the grandmaster through multiple boundary clocks down to the clients.
To avoid this added complexity, the design relies entirely on PTP transparent clocks (TCs). A transparent clock running on each switch along the path measures the time a PTP packet spends in the switch and adds that residency time to the packet's Correction Field (CF). This allows clients to account for variable network latency with far greater precision.
An ordinary clock (OC) computes the mean path delay and clock offset relative to the grandmaster (GM) using four hardware timestamps and two correction field values:
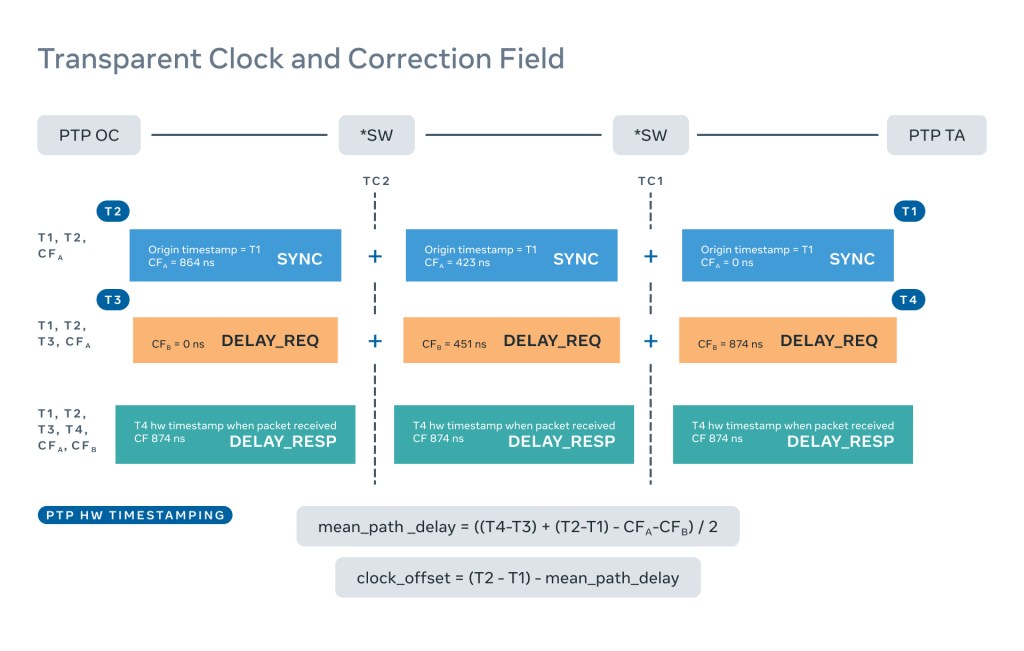
T1: Hardware timestamp when the GM sends the SYNC packet.T2: Hardware timestamp when the OC receives the SYNC packet.CFa: Sum of switch delays recorded by each TC for the SYNC packet along the path from GM to OC.T3: Hardware timestamp when the OC sends the Delay Request.T4: Hardware timestamp when the GM receives the Delay Request.CFb: Sum of switch delays recorded by each TC for the Delay Request along the path from OC to GM.
The impact of a single disabled transparent clock is severe. Logs show the path delay exploding, sometimes turning negative — a condition that should never occur under normal operation. The offset degrades from roughly ±100 nanoseconds to -400 microseconds, a swing of more than 4000x. Worse, the resulting offset is not merely large; it is also incorrect, because the mean path delay calculations themselves are corrupted.
Experiments show that modern switches with large packet buffers can delay traffic by up to a couple of milliseconds, producing hundreds of microseconds of error in path delay calculations. This manifests as dramatic offset spikes.
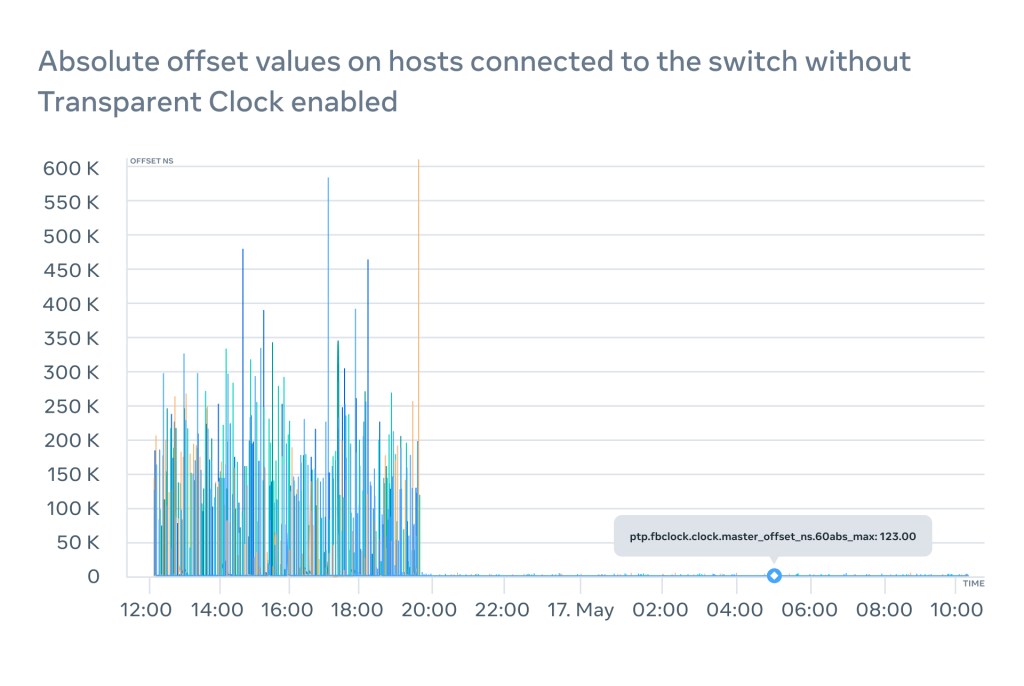
Without transparent clocks, running PTP in a data center produces unpredictable round-trip asymmetry that is difficult to detect. While 500 microseconds may sound small, it is a serious breach when service-level agreements require a window of uncertainty (WOU) on the order of microseconds.
The PTP Client
Capturing Timestamps
Timestamping incoming packets is a well-established Linux kernel feature. Software (kernel) timestamps have powered NTP daemons for years, but note that timestamps are not part of the packet payload by default — the user application must explicitly request and extract them.
Reading an RX timestamp from user space is straightforward. When a packet arrives, the NIC (or kernel) timestamps the event and attaches the timestamp to the socket control message. The application retrieves it alongside the packet by calling recvmsg with the MSG_ERRQUEUE flag.
| 128 bits | 64 bits | 64 bits | 64 bits |
| Socket control message header | Software Timestamp | Legacy Timestamp | Hardware Timestamp |
TX hardware timestamps are more involved. Executing sendto does not immediately depart the packet nor generate a TX timestamp. The user must poll the socket until the kernel places the timestamp. This wait can take several milliseconds, limiting the achievable send rate.
Hardware timestamps are the foundation of PTP precision. Most modern NICs support them, with the driver populating the relevant fields. Verify support with the ethtool command:
$ ethtool -T eth0
Time stamping parameters for eth0:
Capabilities:
	hardware-transmit
	hardware-receive
	hardware-raw-clock
PTP Hardware Clock: 0
Hardware Transmit Timestamp Modes:
	off
	on
Hardware Receive Filter Modes:
	none
	All
Software timestamps can still run PTP, but quality, precision, and accuracy are not guaranteed. We evaluated this path, including a kernel change to fake hardware timestamps with software ones where unavailable, but on busy hosts software timestamp precision degraded to hundreds of microseconds, so we abandoned the idea.
ptp4l as a Client
ptp4lThe is open source and can act as both a PTP client and server. We built a custom server for performance, but kept ptp4l for the client. Lab tests showed excellent synchronization out of the box, aligning local PHCs to tens of nanoseconds. Scaling up exposed problems.
Edge Cases
One recurring issue was sporadic offset "spikes," traced to fundamental hardware limits in a widely deployed NIC:
- The NIC has a timestamp buffer for only 128 packets.
- It cannot distinguish PTP packets from others needing hardware timestamps.
Consequently, legitimate PTP timestamps got displaced by others. Worse, the driver silently inserted software timestamps into the hardware timestamp field of the socket control message. This is an unfixable hardware limitation affecting a large part of the fleet.
We implemented an offset outliers filter that changed the PI servo to be stateful. Occasional outliers are discarded, and the mean frequency is held during micro-holdover. Without this filter, ptp4l would steer the PHC frequency too aggressively, causing seconds of oscillation and poor quality in the resulting Window of Uncertainty.
Another issue arose from BMCA design, which selects the best Time Appliance when multiple are configured. It compares attributes in Announce messages:
- Priority 1
- Clock Class
- Clock Accuracy
- Clock Variance
- Priority 2
- MAC Address
When all attributes match, MAC address is the tiebreaker. Under normal conditions, one Time Server would attract all clients. We introduced "sharding," assigning different PTP client groups to different Time Appliance subgroups.
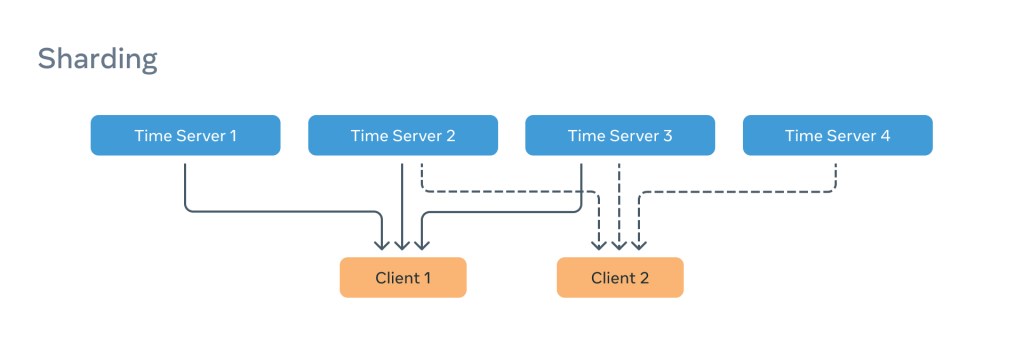
This helped but left each subgroup's load on a single server. We added Priority3 to the selection criteria, just above MAC address, letting clients express preference.
Client 1:
[unicast_master_table]
UDPv6 time_server1 1
UDPv6 time_server2 2
UDPv6 time_server3 3
Client 2:
[unicast_master_table]
UDPv6 time_server2 1
UDPv6 time_server3 2
UDPv6 time_server1 3
This distributes load evenly under normal conditions.
Multi-host NICs posed another challenge. Multiple hosts sharing one physical NIC also share a single PHC, but ptp4l is unaware and disciplines the clock as if alone. Some NIC vendors provide a "free running" mode where ptp4l disciplines a formula in the driver, leaving the actual PHC untouched. This is slightly less precise but transparent.
Other vendors support "real time clock" mode, where the first host to grab the lock disciplines the PHC. This grants more precise calibration and better holdover, but other hosts on the same NIC see their frequency adjustments ignored, yielding inaccurate offsets and frequency calculations.
PTP Profile
We developed and published a PTP profile reflecting these edge cases and the datacenter configuration.
Alternative PTP Clients
We evaluated alternatives against clear criteria:
- Support for our PTP profile
- Meets synchronization quality requirements
- Open source
After considering several, we decided to build and open source a high-performance Simple PTP (SPTP) client. Our tests show comparable performance to PTP with significant improvements in CPU, memory, and network utilization.
Continuously Incrementing Counter
In PTP, the propagated time matters less than the UTC offset conveyed to clients. We use International Atomic Time (TAI), though UTC is an option. The time we provide is effectively a continuously incrementing counter. Currently, we do not discipline the system clock — ptp4l only disciplines the NIC's PHC.
fbclock
Synchronizing PHCs across a fleet is useless without a way to read and manipulate the values on clients. We built fbclock, a lightweight API that gathers PHC and ptp4l data, exposing an easy Window of Uncertainty:
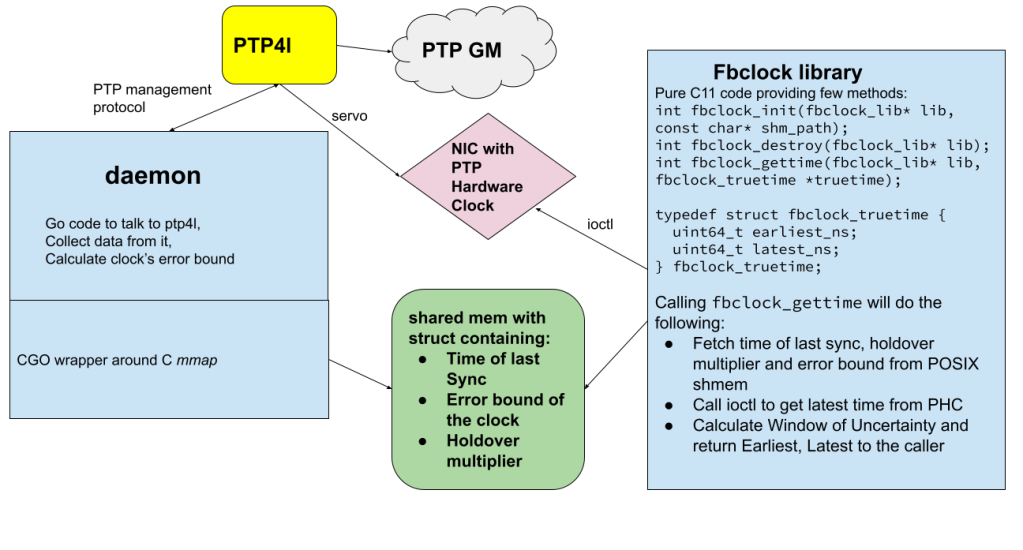
Using the efficient ioctl PTP_SYS_OFFSET_EXTENDED, fbclock fetches current PHC timestamps, retrieves recent ptp4l data, and applies a formula to compute the Window of Uncertainty:
$ ptpcheck fbclock
{"earliest_ns":1654191885711023134,"latest_ns":1654191885711023828,"wou_ns":694}
The API does not return the current time. Instead, it returns a window of time containing the actual time with high probability. In this example, the Window of Uncertainty is 694 nanoseconds, and the time falls between (TAI) Thursday June 02 2022 17:44:08:711023134 and Thursday June 02 2022 17:44:08:711023828. Clients can wait until the interval passes to guarantee exact transaction ordering.
Error Bound Measurement
Measuring precision means presenting a window around the delivered time value that includes the true time to a high certainty level.
The required certainty depends on the application. Ours demands better than 99.9999% (6-9s), translating to fewer than one error per 1,000,000 measurements.
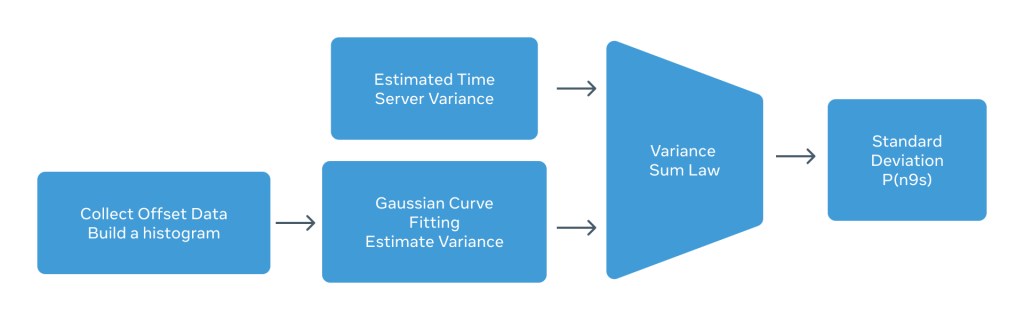
Error rate estimation uses histogram data to fit a probability distribution function. From that, variance and standard deviation are computed, and simple multiplication yields distribution-based estimates.
Below is a histogram from offset measurements of ptp4l on an ordinary clock.
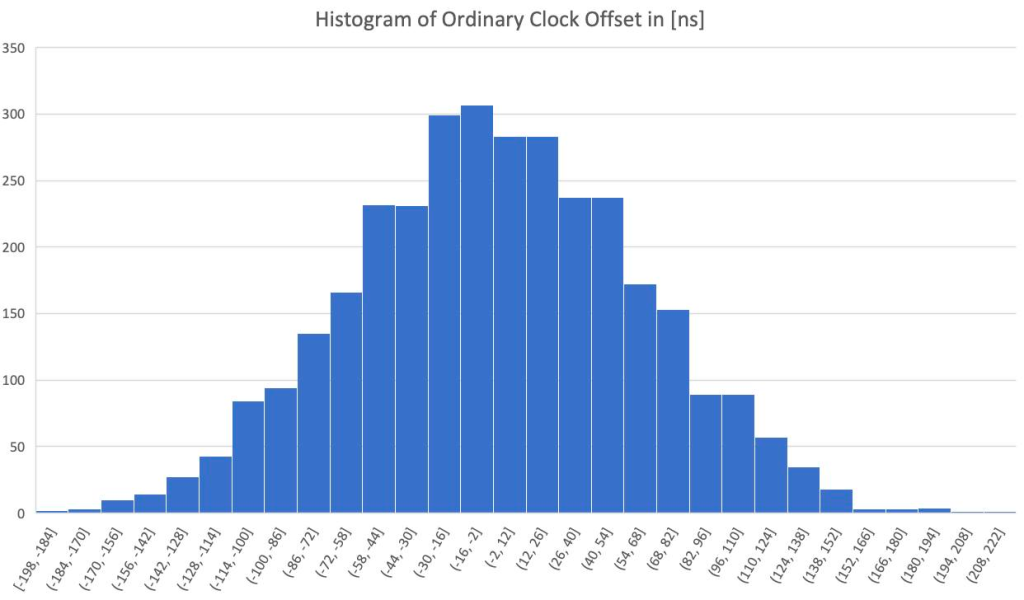
Estimating total end-to-end (E2E) variance requires the variance accumulated from the time server through to the end node NIC. This includes GNSS, atomic clock, and Time Card PHC to NIC PHC (ts2phc). The manufacturer provides GNSS error variance; for the UBX-F9T it is about 12 nanoseconds. Atomic clock variance depends on the disciplining threshold — tighter thresholds lower offset variance but degrade holdover. In this experiment, atomic clock error variance measured 43ns (standard deviation), and ts2phc added 30ns, totaling 52ns.
Observed results match the calculated variance from the "Sum of Variance Law."
Adding all variances yields the total variance. The measured E2E error (via Calnex Sentinel) was about 92ns, while our estimate derived:
Estimated E2E Variance = [GNSS Variance + MAC Variance + ts2phc Variance] + [PTP4L Offset Variance] = [Time Server Variance] + [Ordinary Clock Variance]
Plugging values:
Estimated E2E Variance = (12ns2) + (43ns2) + (52ns2) + (61ns2) = 8418, yielding 91.7ns.
These results confirm that propagating error variance down the clock tree yields accurate E2E estimates. Multiplying estimated E2E variance by 4.745 estimates the Window of Uncertainty for 6-9s confidence. For our system, that is ~92ns × 4.745 = 436ns, meaning a window of 436ns around the reported PTP time contains the true time with over 99.9999% confidence.
Holdover Compensation
This assumes normal operation with a reliable connection to the open time server (OTS). Many failures can occur: OTS outage, switch failure, malformed Sync messages, etc. During such an event, error bound calculation must enter holdover mode. Similarly, when the OTS loses GNSS, it increases its Window of Uncertainty at a compound rate based on oscillator stability (scrolling variance) observed during normal operation. At the OTS, this rate is adjusted via telemetry (temperature, vibration). Calibrating these coefficients remains an active effort.
During network synchronization, the servo continuously adjusts the client's local clock frequency. A synchronization break leaves the servo with the last frequency correction, which is a transient adjustment to reduce measured offset, not an estimate of clock precision.
Therefore, we must account for sync loss by using the best frequency correction estimate (typically the scrolling average of past corrections) and adjust the error bound upward based on the difference between the last correction and its scrolling average.
Instrumenting the time fabric
Because PTP is a foundational service, Meta has invested heavily in monitoring tooling for every layer of the stack. The goal is not just to detect failures, but to pinpoint which component—appliance, network path, or client—is responsible.
Calnex Sentinel integration
Working with Calnex, Meta helped develop the Sentinel HTTP API for managing, configuring, and exporting data from time appliances. Meta has also open-sourced a command-line tool for this API that works in both human-interactive and scripted contexts.
Using Calnex Sentinel 2.0, three metrics are monitored per time appliance: NTP, PTP, and PPS.
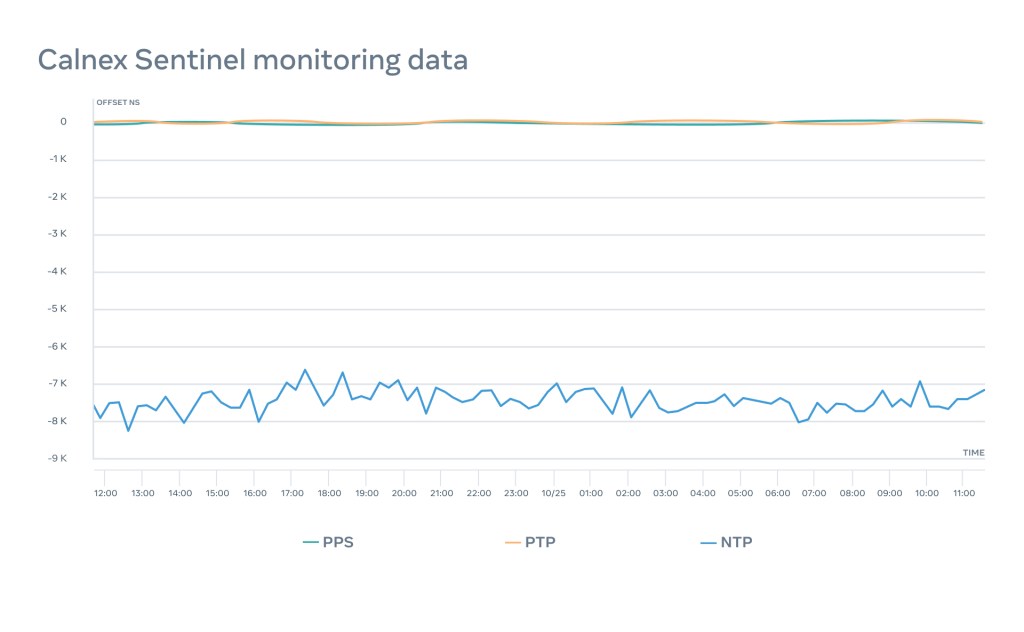
This tri-level monitoring lets engineers be notified of issues and quickly isolate the source. In a typical healthy deployment, both PTP and PPS show less than 100 nanoseconds of variation over 24 hours, while NTP holds within 8 microseconds.
The ptpcheck toolkit
Meta open-sourced ptpcheck to provide granular visibility into the time system. Among its many subcommands, several stand out for operational use:
diag
A client-side subcommand that reports overall health, including the receipt time of the last Sync message, clock offset relative to the selected time server, mean path delay, and other diagnostics:
$ ptpcheck diag
[ OK ] GM is present
[ OK ] Period since last ingress is 972.752664ms, we expect it to be within 1s
[ OK ] GM offset is 67ns, we expect it to be within 250µs
[ OK ] GM mean path delay is 3.495µs, we expect it to be within 100ms
[ OK ] Sync timeout count is 1, we expect it to be within 100
[ OK ] Announce timeout count is 0, we expect it to be within 100
[ OK ] Sync mismatch count is 0, we expect it to be within 100
[ OK ] FollowUp mismatch count is 0, we expect it to be within 100
fbclock
Queries the fbclock API to return the current Window of Uncertainty:
$ ptpcheck fbclock
{"earliest_ns":1654191885711023134,"latest_ns":1654191885711023828,"wou_ns":694}
sources
Provides chrony-style monitoring of all time servers in the client configuration, showing their status and time quality:
$ ptpcheck sources
+----------+----------------------+--------------------------+-----------+--------+----------+---------+------------+-----------+--------------+
| SELECTED |       IDENTITY       |         ADDRESS          |   STATE   | CLOCK  | VARIANCE |  P1:P2  | OFFSET(NS) | DELAY(NS) |  LAST SYNC   |
+----------+----------------------+--------------------------+-----------+--------+----------+---------+------------+-----------+--------------+
| true     | abcdef.fffe.111111-1 | time01.example.com.      | HAVE_SYDY | 6:0x22 | 0x59e0   | 128:128 |         27 |      3341 | 868.729197ms |
| false    | abcdef.fffe.222222-1 | time02.example.com.      | HAVE_ANN  | 6:0x22 | 0x59e0   | 128:128 |            |           |              |
| false    | abcdef.fffe.333333-1 | time03.example.com.      | HAVE_ANN  | 6:0x22 | 0x59e0   | 128:128 |            |           |              |
+----------+----------------------+--------------------------+-----------+--------+----------+---------+------------+-----------+--------------+
oscillatord
A server-side subcommand that reads a summary from the Time Card:
$ ptpcheck oscillatord
Oscillator:
	model: sa5x
	fine_ctrl: 328
	coarse_ctrl: 10000
	lock: true
	temperature: 45.33C
GNSS:
	fix: Time (3)
	fixOk: true
	antenna_power: ON (1)
	antenna_status: OK (2)
	leap_second_change: NO WARNING (0)
	leap_seconds: 18
	satellites_count: 28
	survey_in_position_error: 1
Clock:
	class: Lock (6)
	offset: 1
This output, for example, reveals that the last correction applied on the Time Card was just 1 nanosecond.
phcdiff
Measures the offset between any two PHCs:
$ ptpcheck phcdiff -a /dev/ptp0 -b /dev/ptp2
PHC offset: -15ns
Delay for PHC1: 358ns
Delay for PHC2: 2.588µs
Here, the difference between the Time Card and a server NIC is -15 nanoseconds.
Client-side observation and safety checks
Periodic and on-demand monitoring is useful, but Meta wanted to understand what clients experience in real time. To that end, the fbclock API now embeds buckets based on atomic counters, which increment on every API call from the client:
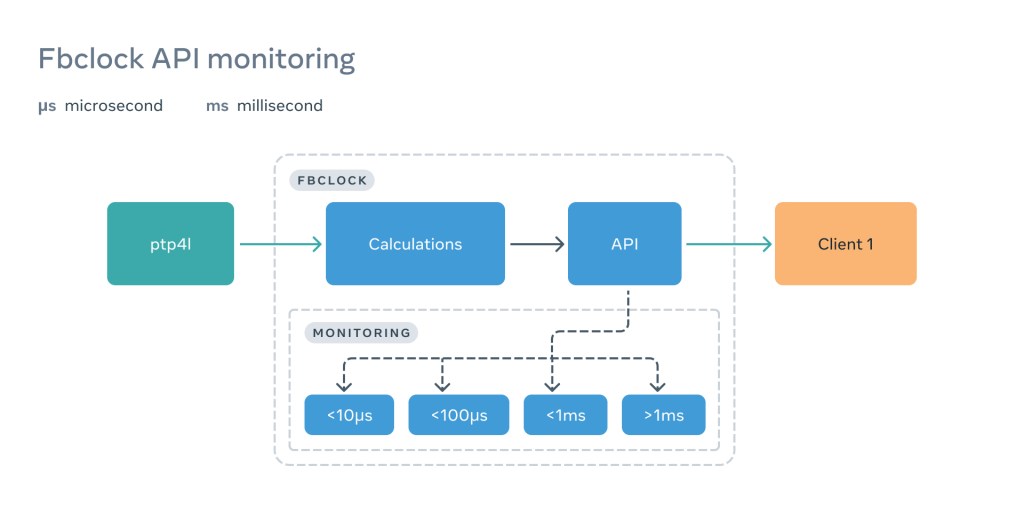
This design surfaces client-side issues as they occur, often before the application itself is affected.
Linearizability as a last line of defense
Unlike NTP and chrony, PTP (and ptp4l in particular) lacks a quorum selection process. A client chooses and trusts a single time server based on Announce messages—even if that server is faulty.
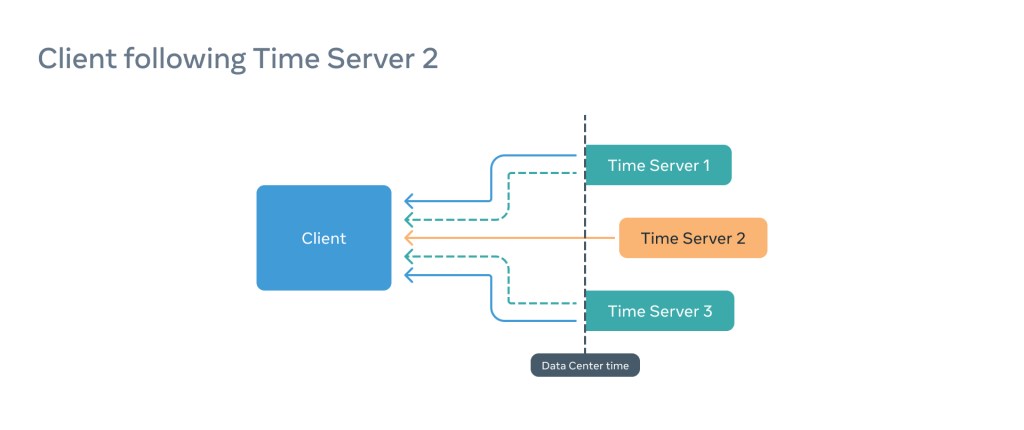
Consider a client configured with three time servers, where the client is syncing to a failing server (Time Server 2):
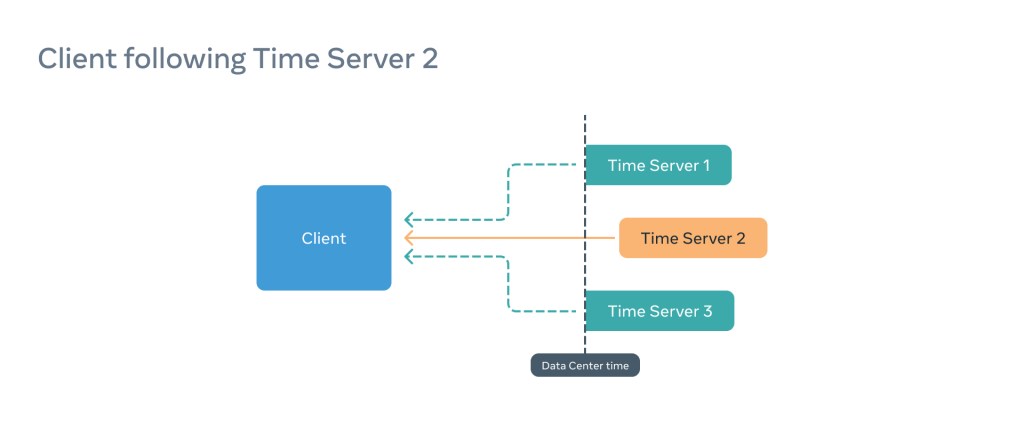
From the client's perspective, synchronization appears healthy. But the Window of Uncertainty it reports to downstream applications is shifted and inaccurate.
To catch this, fbclock runs a parallel linearizability check. It maintains communication with the remaining time servers and compares their offsets. If the majority show high offsets relative to the followed server, the client's chosen server is an outlier. In that case, the client is flagged as non-linearizable—even when the sync between the client and its preferred server is technically perfect.
PTP as a long-term standard
Meta sees PTP as the future of timekeeping in computer networks and is deploying it at unprecedented scale. The rollout has required reexamining the entire infrastructure stack, from GNSS antennas down to client APIs, with many components rebuilt from the ground up.
The company has open-sourced much of the work—software and hardware—and hopes network equipment vendors will build on it to bring PTP-capable gear to market. The effort aims to improve the performance and reliability of existing systems while enabling new products and services built on precise time. Meta credits its internal teams, external vendors, and Andrei Lukovenko for connecting the time community.
In Meta's own assessment, the journey is only one percent finished.



