
What is sound, actually?
Sound isn't a physical object like a ball or a rock. It's a behavior of particles — specifically, a pressure wave traveling through a medium. Pluck a guitar string and it vibrates, transferring energy into the guitar body, which amplifies it and pushes it into the air. That wave travels to your ear, gets funneled through the canal to the eardrum, where three tiny bones amplify it further before hair cells in the inner ear translate it into electrical signals. For those with hearing loss who use cochlear implants, the mechanical parts of that path are bypassed; microphones and speech processors feed the brain enough data to recognize speech and environmental sounds.
But for all of us, the underlying phenomenon the ear is detecting is an extremely small change in air pressure, on top of the roughly one hundred thousand pascals of atmospheric pressure we're always under. There is no dedicated "audio" pressure; the loudest sounds you'd ever want near your ears are a few pascals of fluctuation.
That huge dynamic range — from a whisper's micropascals to dangerous levels thousands of times higher — is why audio people don't use pascals directly. They use sound pressure level (SPL):
Lp = 20 log10(p / p0) dB SPL
This is a logarithmic ratio between the measured pressure p and a reference pressure p₀, which for air is taken as 20 micropascals — right around the quietest sound a healthy human ear can detect. The result collapses a linear scale that spans eight orders of magnitude into a far friendlier numbering from 0 dB (the threshold of hearing) to 194 dB, the point where pressure swings reach one full atmosphere. Beyond that, you don't get sound waves at all; you get shock waves, because the trough would require negative absolute pressure — a vacuum is as far as you can go.
What the amp is telling you
The decibels on your amplifier's volume knob are not SPL. They're decibels relative to full scale, dBFS. Here the formula is identical, but instead of comparing against an acoustic reference, you're comparing an input signal x₁ to an output signal x₂:
L = 20 log10(x₂ / x₁) dB
If a system receives an input with amplitude 1 and produces an output with amplitude 0.2, its gain is about -14 dB. Zero dBFS means the signal is at the absolute peak power the system, analog or digital, can handle.
Decibels make sense for a volume control because hearing itself is roughly logarithmic. A control that moves linearly in dB feels linear to the ear. Without that, you get a slider where the top 80 percent of the travel is unbearable, and the setting you actually want is squeezed onto the lowest ticks.
dBFS is the metric engineers actually watch inside the signal chain, because the moment levels exceed zero, things break. In analog gear that's distortion — sometimes deliberately for style. In digital systems it's clipping, a much harsher and almost always undesirable effect you've probably heard from a public-address system at a train station. To avoid that, you watch your levels. Over the past century, many meter designs have emerged for that purpose, each with its own shortcomings.
In the 1930s, the BBC developed what we now call quasi-peak programme meters (PPMs). Germany independently produced its own scaled meters, nicknamed Lichtzeigerinstrumente (light-pointer instruments). They're "quasi" because they don't really report accurate peaks. A Type II PPM, for instance, has an integration time of 10 ms, so any transient shorter than that is under-reported. A series of notes with identical amplitude but increasing duration will show the meter gradually catching up:
I don't own one, so the best I can do is show you a plug-in that simulates it!
Root-mean-square and what it means
PPMs attempt to catch the true peak of the waveform. But the sound doesn't behave that way in terms of perceived loudness. The ear integrates energy over time, and the signal's average output is often a better match for experience.
From Peaks to Averages: RMS and VU Meters
Quasi-PPMs are decent at revealing peaks, but they’re still far from capturing what we perceive as “loudness.” That’s where VU (Volume Unit) meters, invented in the US in the 1940s, come into play. VU meters measure something similar to the Root Mean Square (RMS), which provides the average signal level over a given time:
A standard VU meter integrates over 300ms — much longer than the 10ms of a Type II PPM — which means it under-reports peaks even more severely:
That’s by design. A VU meter isn’t meant to catch short transients; it’s there so a radio operator can gauge the rough loudness of a song and adjust the volume accordingly, sparing the listener the effort. Since the 1940s, though, our understanding of human hearing and our technology have both evolved considerably.
Sample Peak vs. True Peak
Most audio processing today happens in the digital domain, which brings its own quirks. In a DAW like Ableton, you can zoom into a waveform until you see individual samples:


Modern PPMs are no longer “quasi” — a sample peak monitor simply scans a window of samples (say, a thousand) and reports the one furthest from zero. But that value is your sample peak, not your true peak.
Because a continuous sound wave is reconstructed from discrete samples, it’s possible for every individual sample to sit below a maximum allowable level while the reconstructed waveform still exceeds it. To find the true peak, you must upsample the signal with a sinc filter, effectively filling in the gaps between samples to reveal how high the wave actually travels.
The Loudness Wars and the Rise of LKFS
While peak measurement improved, the industry initially marched backward on loudness. Compression reduces dynamic range by attenuating everything above a threshold:
A demonstration of compression in DaVinci Resolve 20 using the very text for this article.
After compression, you can apply “make-up” gain to the whole signal without clipping, pushing it louder overall. During the 2000s, engineers leaned heavily on this technique under the assumption that louder automatically meant better, sparking the infamous “loudness wars”:

The song "Super Trouper" as shown on the major issues of the album, the 1980 Super Trouper LP, 2001 Jon Astley remaster, 2005 The Complete Studio Recordings box set disc 7, and 2011 Super Trouper Deluxe Edition remaster disc 1.
KosmosiThe music industry didn’t formally address this until the mid-2010s, when it adopted a proper loudness unit: LKFS. One key innovation of LKFS is that it takes multichannel audio and downmixes it into a single value to account for all channels:

Simplified block diagram of multichannel loudness algorithm
The BBC, with its own PPMs, had to solve the stereo problem when it began experimenting with two AM transmitters in the late '50s. Alongside two separate PPMs, they also used variants displaying the sum and difference of both channels — models M3 and M6:

Screenshot of BBC-type Peak programme meter in AB (left/right) mode
Harumphy
Screenshot of BBC-type Peak programme meter in M3 (sum/difference) mode
Harumphy
Screenshot of BBC-type Peak programme meter in M6 (sum/difference) mode
HarumphySum-and-difference metering matters because two waves of opposite phase can cancel each other out entirely:

The LKFS computation starts with a filtering stage that mimics human perception. The first filter boosts everything above 1000Hz:
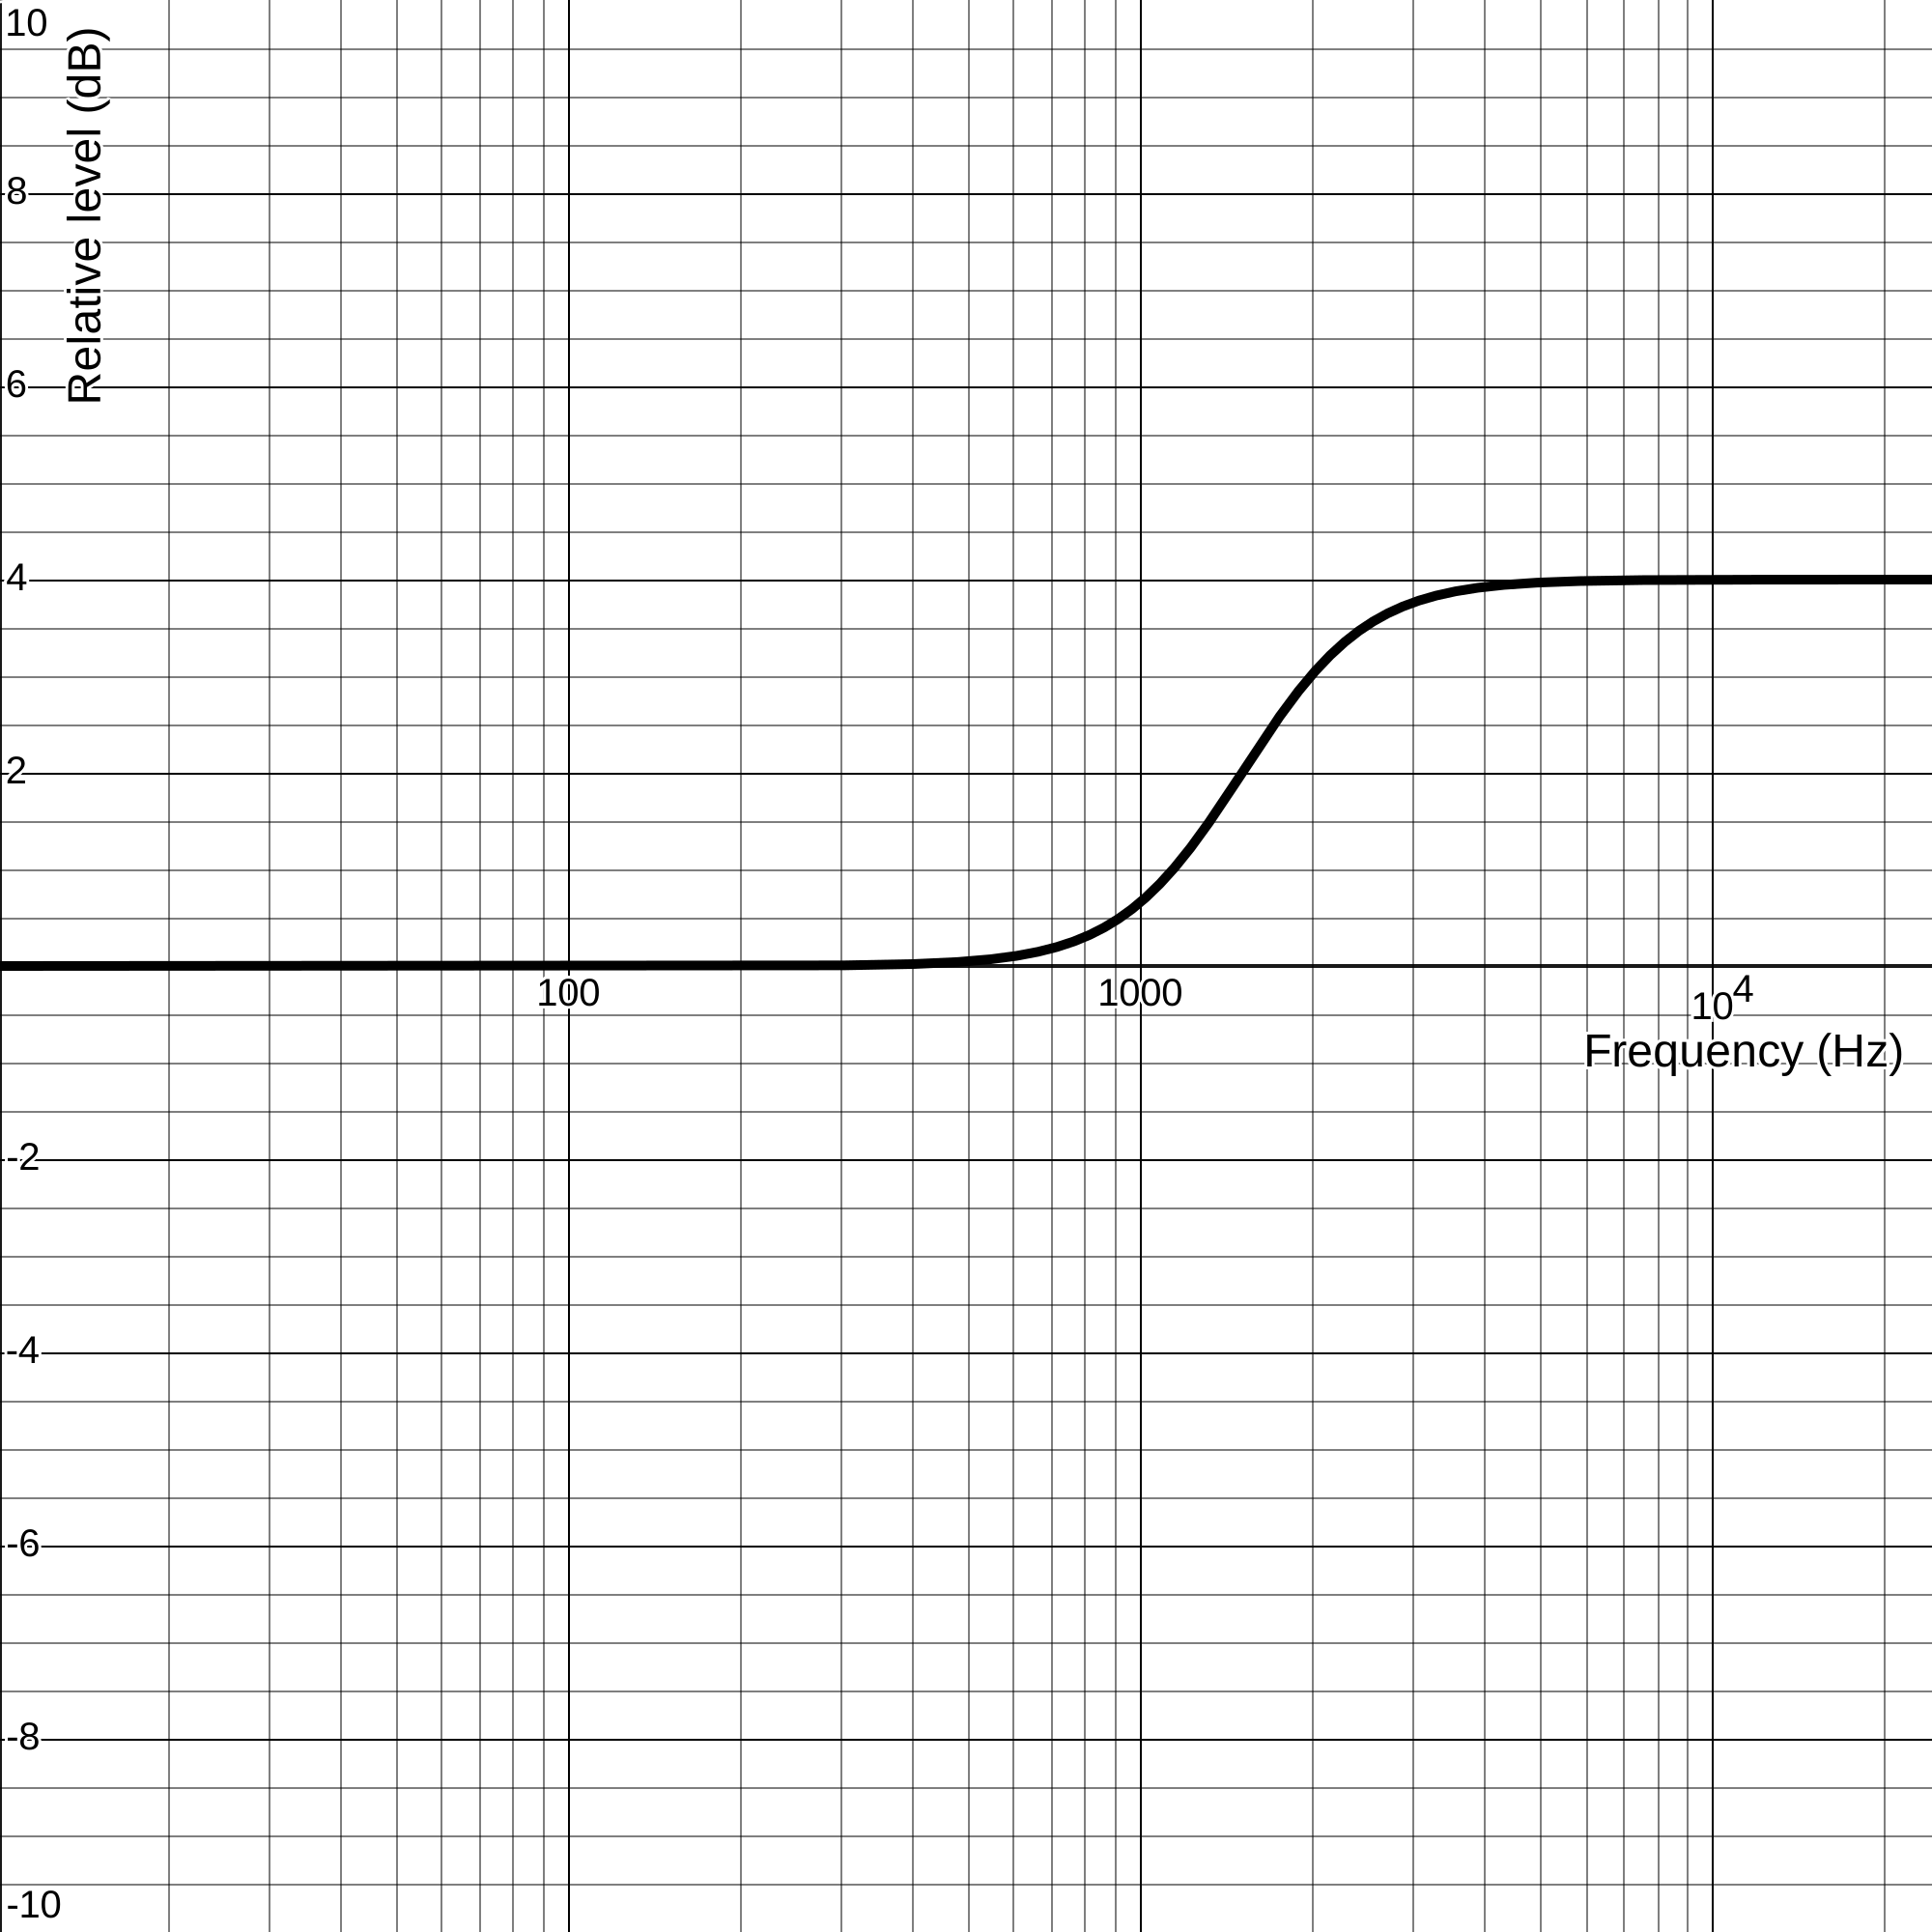
Response of stage 1 of the pre-filter used to account for the acoustic effects of the head
Graphed with DesmosThe second is a high-pass filter that attenuates content below 100Hz:
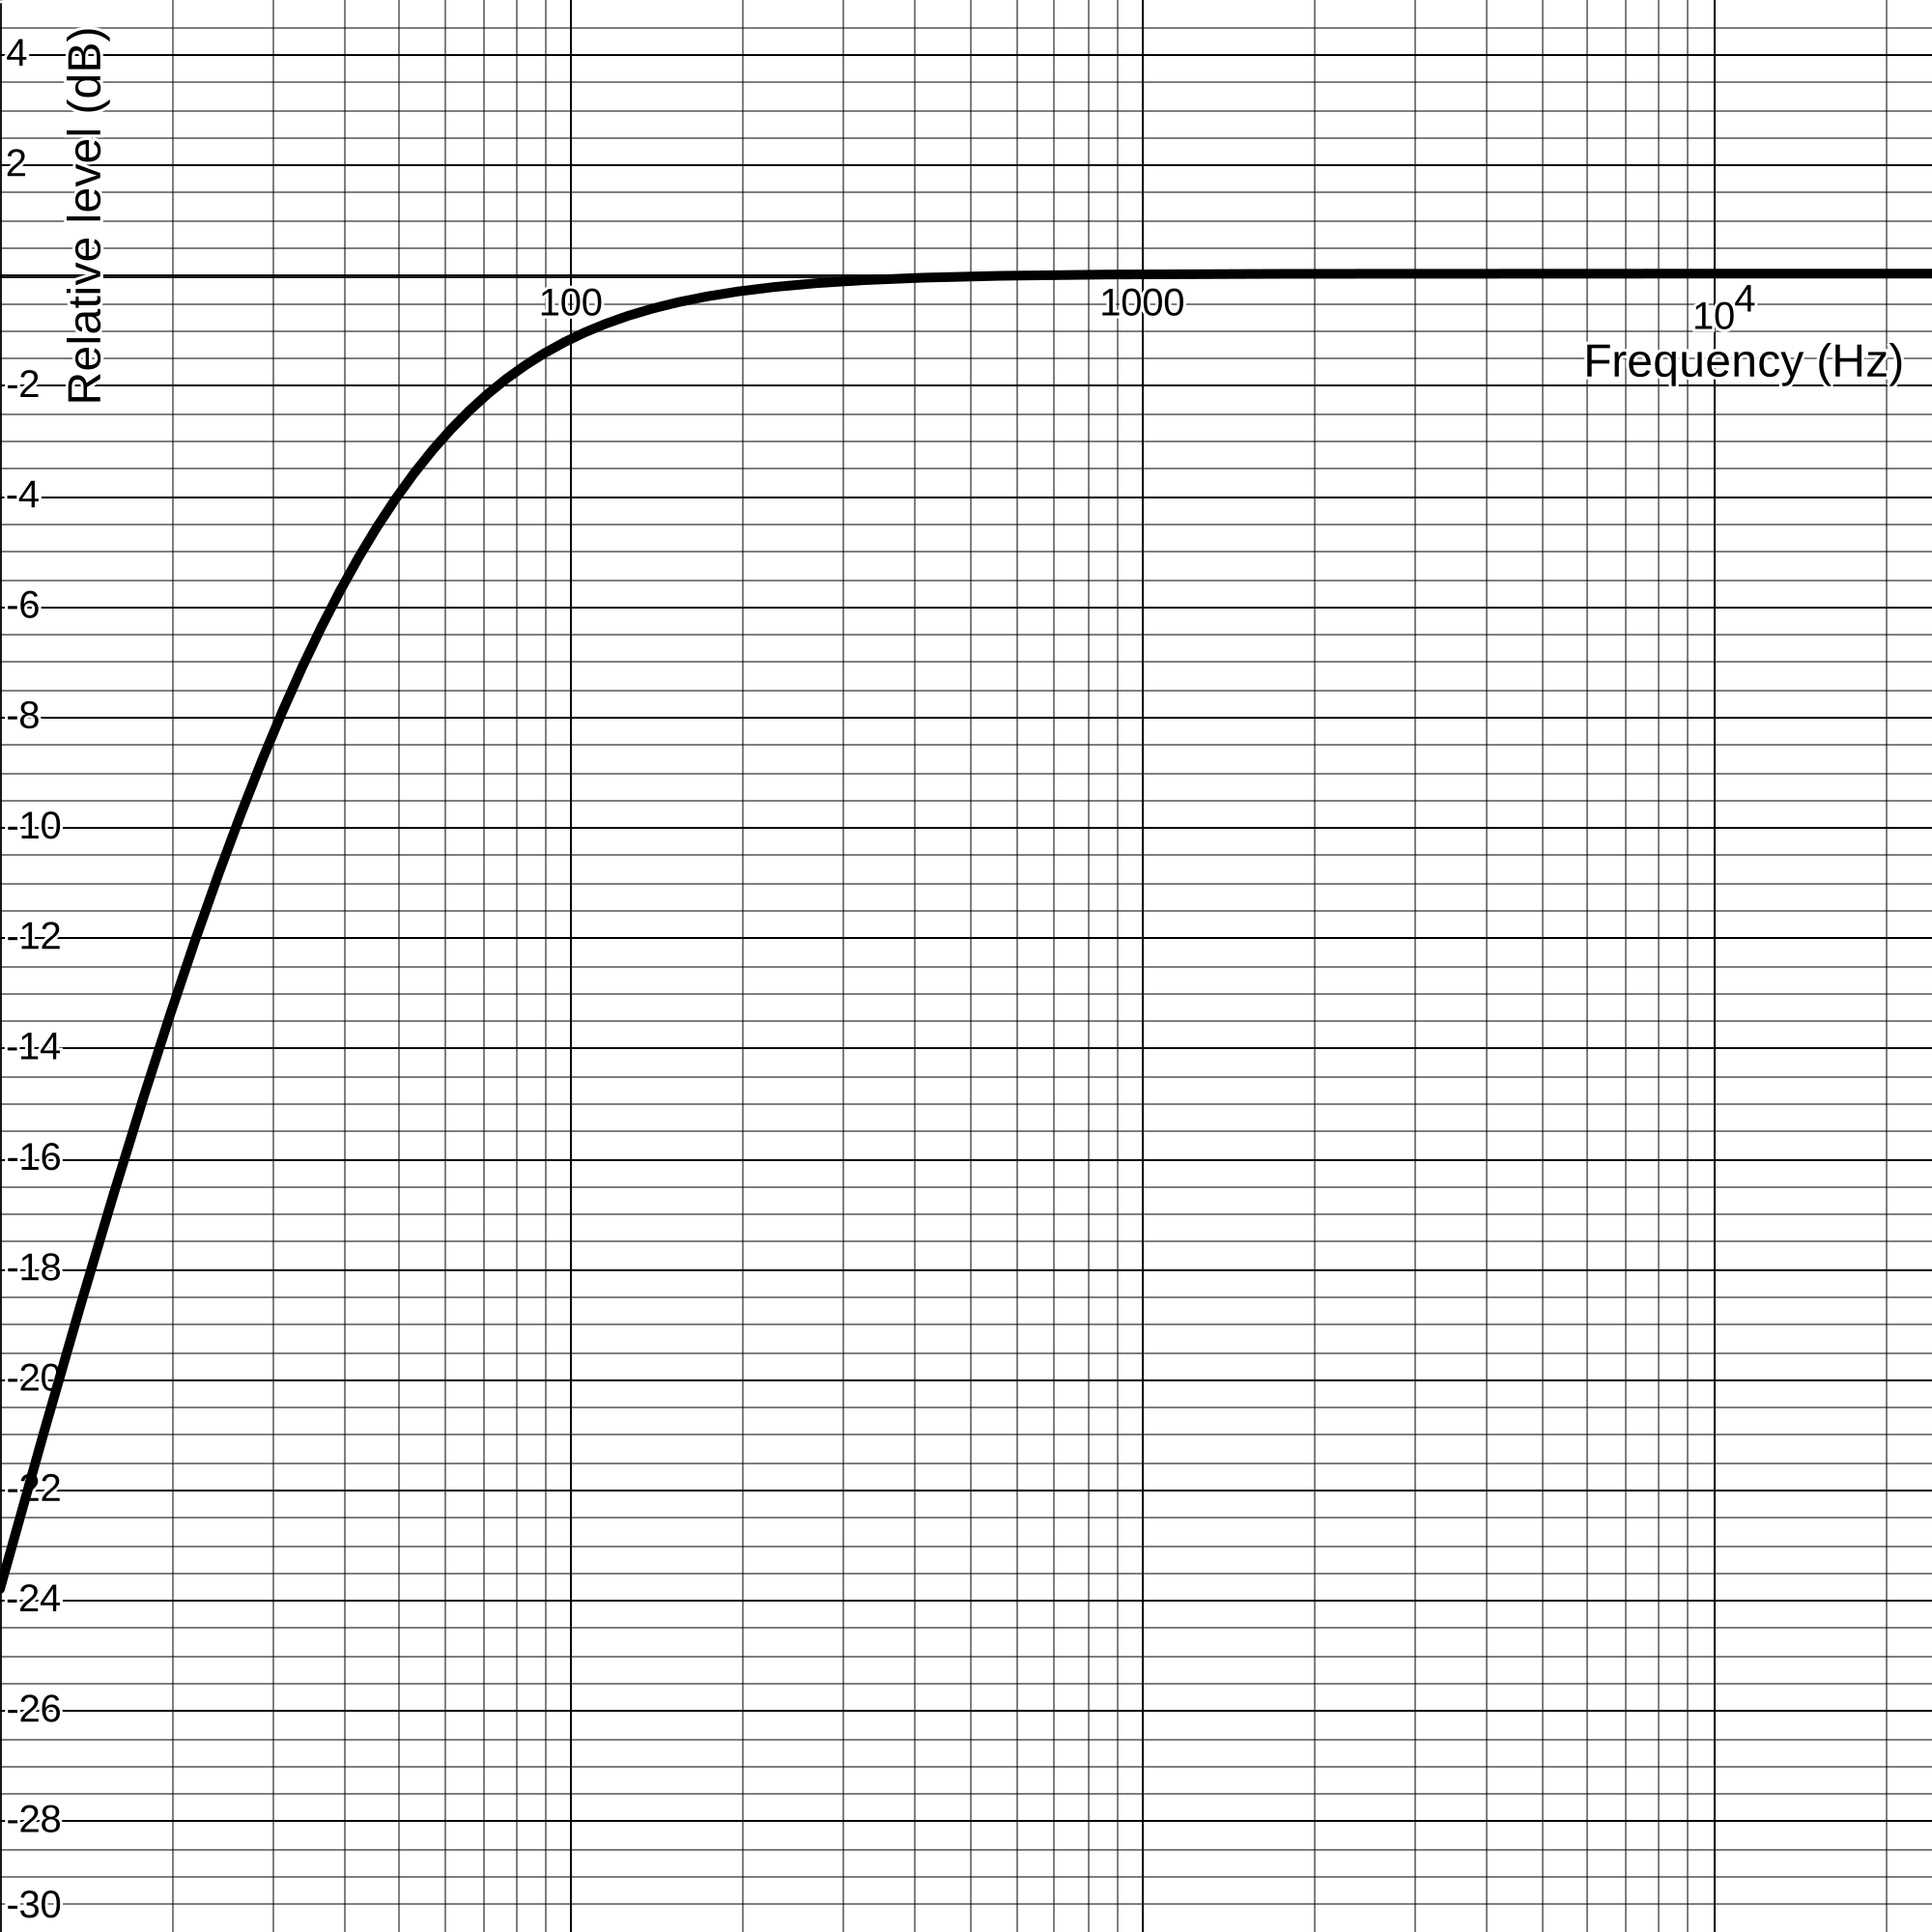
Second stage weighting curve
Graphed with DesmosNext, the power of the filtered signal is integrated over an interval . This leads to the final formula, which closely resembles the standard dB equation — except that because we’re measuring power rather than amplitude, the factor is 10 instead of 20:
The channel weighting coefficients come from table 3 of BS.1770-5: the left, right, and center channels each get a weight of 1.0 (0 dB), while the left and right surround channels are weighted at 1.41 (approximately +1.5 dB).
Depending on the integration interval, the result is labeled differently: for momentary (400 ms), for short-term (3 seconds), and for integrated — the latter spanning an entire piece of media, with quiet parts excluded through a standard gating mechanism. This gating prevents engineers from gaming the system, because we finally have one number that reasonably predicts perceived loudness.
Loudness in Practice: YouTube and Streaming
When mastering for YouTube, the target integrated loudness is . YouTube’s “Stats for nerds” overlay shows a content loudness section:

George Michael’s “Careless Whisper” on YouTube, for example, leaves headroom with an integrated loudness of . Checking with ffmpeg’s -af ebur128 filter confirms this:
~/Downloads
❯ ffmpeg -i careless-whisper.webm -af ebur128 -f null -
ffmpeg version 7.1 Copyright (c) 2000-2024 the FFmpeg developers
✂️
[Parsed_ebur128_0 @ 0x6000002640b0] t: 0.106979   TARGET:-23 LUFS    M:-120.7 S:-120.7     I: -70.0 LUFS       LRA:   0.0 LU
[Parsed_ebur128_0 @ 0x6000002640b0] t: 0.206979   TARGET:-23 LUFS    M:-120.7 S:-120.7     I: -70.0 LUFS       LRA:   0.0 LU
[Parsed_ebur128_0 @ 0x6000002640b0] t: 0.306979   TARGET:-23 LUFS    M:-120.7 S:-120.7     I: -70.0 LUFS       LRA:   0.0 LU
[Parsed_ebur128_0 @ 0x6000002640b0] t: 0.406979   TARGET:-23 LUFS    M: -20.6 S:-120.7     I: -20.6 LUFS       LRA:   0.0 LU
[Parsed_ebur128_0 @ 0x6000002640b0] t: 0.506979   TARGET:-23 LUFS    M: -20.5 S:-120.7     I: -20.6 LUFS       LRA:   0.0 LU
[Parsed_ebur128_0 @ 0x6000002640b0] t: 0.606979   TARGET:-23 LUFS    M: -21.4 S:-120.7     I: -20.8 LUFS       LRA:   0.0 LU
[Parsed_ebur128_0 @ 0x6000002640b0] t: 0.706979   TARGET:-23 LUFS    M: -25.0 S:-120.7     I: -21.6 LUFS       LRA:   0.0 LU
[Parsed_ebur128_0 @ 0x6000002640b0] t: 0.806979   TARGET:-23 LUFS    M: -33.5 S:-120.7     I: -21.6 LUFS       LRA:   0.0 LU
✂️
[Parsed_ebur128_0 @ 0x6000002640b0] t: 300.606979 TARGET:-23 LUFS    M: -60.3 S: -60.3     I: -16.9 LUFS       LRA:   8.2 LU
[Parsed_ebur128_0 @ 0x6000002640b0] Summary:

  Integrated loudness:
    I:         -16.9 LUFS
    Threshold: -27.1 LUFS

  Loudness range:
    LRA:         8.2 LU
    Threshold: -37.1 LUFS
    LRA low:   -22.0 LUFS
    LRA high:  -13.8 LUFS
✂️
Since −16.9 is below the −14 target, YouTube doesn’t alter the video. In contrast, Rihanna’s “Umbrella” is mastered to , prompting YouTube to lower the volume:

Dropping from 100% to 55% is a change of approximately:
That matches the overlay’s displayed value of roughly 5.2–5.3 dB above the target. It’s slightly odd that YouTube reports this difference in decibels rather than in loudness units (LU) — or simply showing the target of alongside the track’s actual loudness in LUFS. After all, this is stats for nerds.
YouTube has also introduced dynamic range compression (DRC), branded for users as “Stable Volume.” It’s generally not meant to engage for music, since it ruins the dynamics:


A-Weighting and Psychoacoustic Filtering
LKFS and its equivalent LUFS aren’t the only units that factor in psychoacoustics. The Apple Watch’s Noise app, for example, applies its own filtering. The quest to quantify perceived loudness dates back to 1927:

Note: "T.U." stands for telephone units, and "cycle" for Hertz.
A few years later, Fletcher and Munson published their equal-loudness contour graph:

An equal-contour loudness from Fletcher & Munson, 1933
Loudness, Its Definition, Measurement and CalculationThe graph takes some deciphering. Each line represents a matched-loudness level; subjects reported that a 1000Hz tone at 40 dB felt equally loud as a 100Hz tone at 62 dB. We are far more sensitive to sounds around 1000Hz than at 100Hz, and the dip at roughly 3–4 kHz marks our peak sensitivity — the reason smoke detectors beep and babies cry in that range.
From this work came an ISO standard specifying the A-weighting curve, which predates LKFS’s K-weighting by nearly half a century:
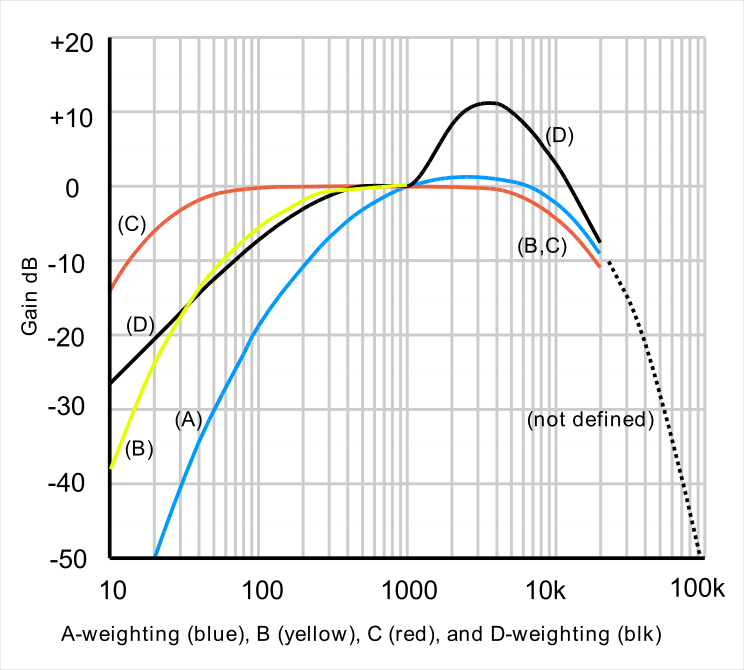
Though simpler and dated, A-weighting remains widely used. French law mandates sound level meters like these at every music venue:


As of 2023, French venue levels must stay below and LEQ — the average sound energy over 15 minutes. American workplace safety bodies have their own exposure guidelines, using (OSHA and NIOSH), and so does the Apple Watch Noise app:
| Duration per day | Sound level (dBA) |
| 8 hours | 90 |
| 4 hours | 95 |
| 2 hours | 100 |
| 1 hour | 105 |
| 30 minutes | 110 |
| 15 minutes | 115 |
| Duration per day | Sound level (dBA) |
| 8 hours | 85 |
| 4 hours | 88 |
| 2 hours | 91 |
| 1 hour | 94 |
| 30 minutes | 97 |
| 15 minutes | 100 |
| 7.5 minutes | 103 |
| 3.75 minutes | 106 |
| 1.88 minutes | 109 |
| 0.94 minutes | 112 |
Once you see how sample peaks, true peaks, RMS, VU, LKFS, and A-weighting all fit together, you’ll never listen to a live stream — or a smoke alarm — the same way again.



.png
)


