

Contact tracing based on mobile phone location data has become one of the more visible applications of spatial databases during COVID-19. PostGIS offers the primitives needed to compare the trajectories of an infected person and a healthy one and to decide whether those paths crossed in space and time. The example below works on data in Vienna, Austria, and therefore uses MGI/Austria 34, defined as EPSG:31286, as its projection. The focus is on the range of functions rather than on query tuning.
Two tables, one projection
The data model is intentionally small. A helper table mobile_tracks holds artificial tracks of individuals that were digitized in QGIS. A second table, mobile_points, stores the points that result from segmenting those tracks; each point carries a timestamp so that temporal intersections can be evaluated on top of purely spatial ones.
PgSQL
|
1 2 3 4 5 6 7 8 9 10 11 12 13 14 15 |
create table if not exists mobile_tracks ( gid serial not null constraint mobile_tracks_ok primary key, customer_id integer, geom geometry(LineString,31286), infected boolean default false ); create index if not exists mobile_tracks_geom_idx on mobile_tracks using gist (geom); create unique index if not exists mobile_tracks_customer_id_uindex on mobile_tracks (customer_id); |
PgSQL
|
1 2 3 4 5 6 7 8 9 10 11 12 13 |
create table if not exists mobile_points ( gid serial not null constraint mobile_points_ok primary key, customer_id integer, geom geometry(Point,31286), infected boolean, recorded timestamp ); create index if not exists mobile_points_geom_idx on mobile_points using gist (geom); |
From tracks to timestamped points
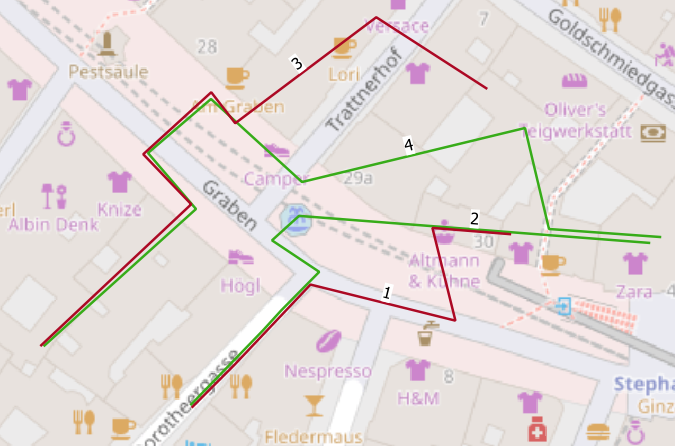
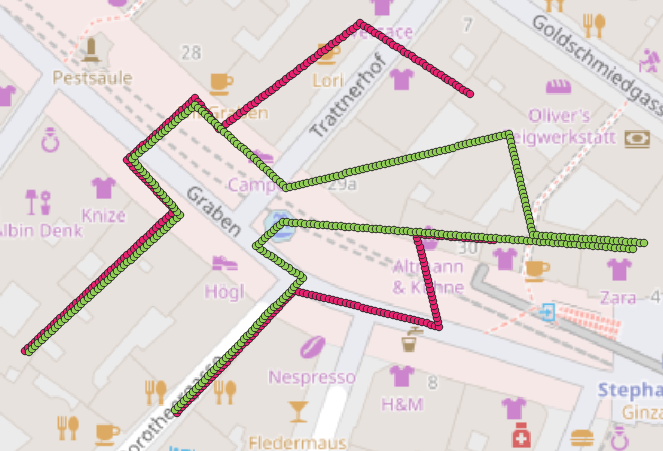
Because the sample tracks were drawn by hand rather than recorded, the points are generated from the tracks. In the visualization, tracks of infected individuals appear in red, while healthy individuals are represented as green linestrings.
Two simplifying assumptions underlie the example:
- All individuals move at the same speed.
- Tracks of all individuals start at the same time.
Individual points are extracted with PostGIS's ST_Segmentize:
PgSQL
|
1 2 3 4 5 6 7 8 9 10 11 12 13 14 |
with dumpedPoints as ( select (st_dumppoints(st_segmentize(geom, 1))).geom, ((st_dumppoints(st_segmentize(geom, 1))).path[1]) as path, customer_id, infected, gid from mobile_tracks), aggreg as ( select *, now() + interval '1 second' * row_number() over (partition by customer_id order by path) as tstamp from dumpedPoints) insert into mobile_points(geom, customer_id, infected, recorded) select geom, customer_id, infected, tstamp from aggreg; |
That query places a point every meter and increments the timestamp by 1000 milliseconds per point.
Finding candidate contacts
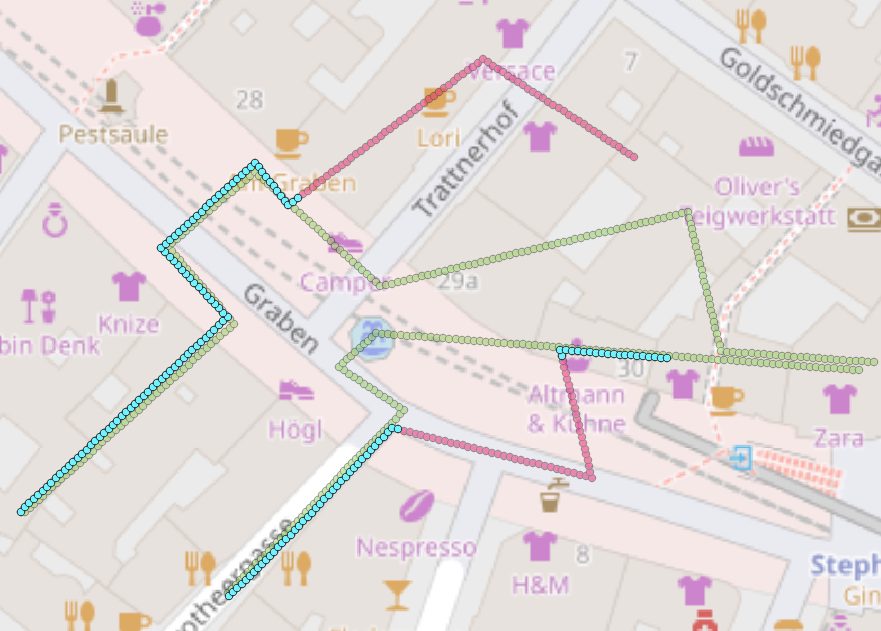
The first analysis answers the question of whether an infected individual met anybody at all. A straightforward query selects points of healthy individuals that lie within 2 meters of an infected individual's points while also respecting a 2 second time interval.
PgSQL
|
1 2 3 4 5 6 7 8 9 10 11 12 13 14 |
SELECT distinct on (m1.gid) m1.customer_id infectionSourceCust, m2.customer_id infectionTargetCust, m1.gid, m1.recorded, m2.gid, m2.recorded FROM mobile_points m1 inner join mobile_points m2 on st_dwithin(m1.geom, m2.geom, 2) where m1.infected = true and m2.infected = false and m1.gid < m2.gid AND (m2.recorded >= m1.recorded - interval '1seconds' and m2.recorded <= m1.recorded + interval '1seconds') order by m1.gid, st_dwithin(m1.geom, m2.geom, 2) asc |
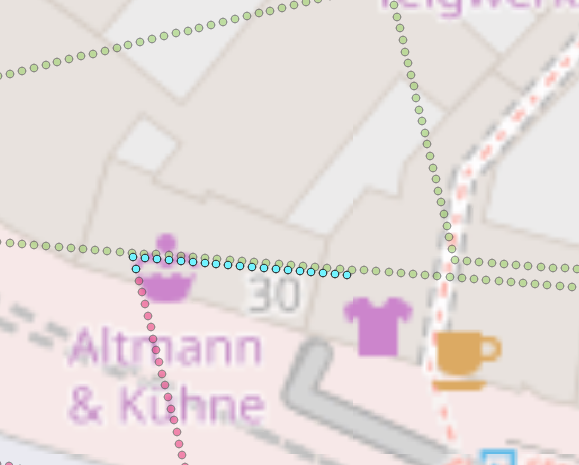
Contact points identified this way are highlighted in blue. This is the most basic form of the query. PostGIS's ST_CPAWithin and ST_ClosestPointOfApproach can solve the same problem in a similar manner, provided the points are first modelled as trajectories.
From point contacts to passage intervals
A more refined answer identifies temporally coherent segments of spatial proximity together with the time each pair spent near each other — which matters if the duration of contact is to inform how likely an infection was passed on. The full query is included with the original post. The refinement proceeds in four steps.
Step 1 – aggregStep1
For every point in the initial result, the time interval to its predecessor is computed. Given the initial assumptions, a gap greater than 1 second indicates a non-coherent temporal segment.
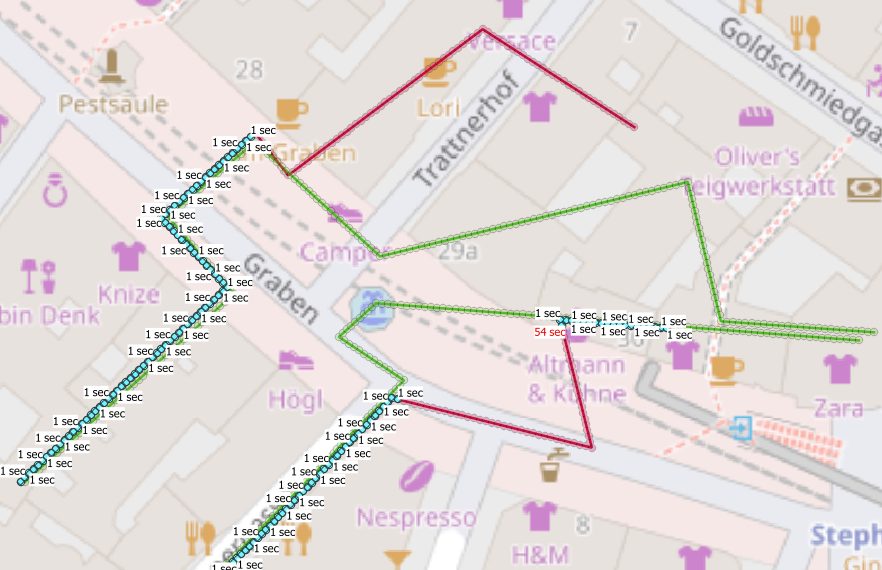
Step 2 – aggregStep2
The new column describing the temporal gap between a point and its predecessor is used to cluster the segments.
Step 3 – aggregStep3
Within each cluster, the minimum timestamp is subtracted from the maximum to derive a passage interval.
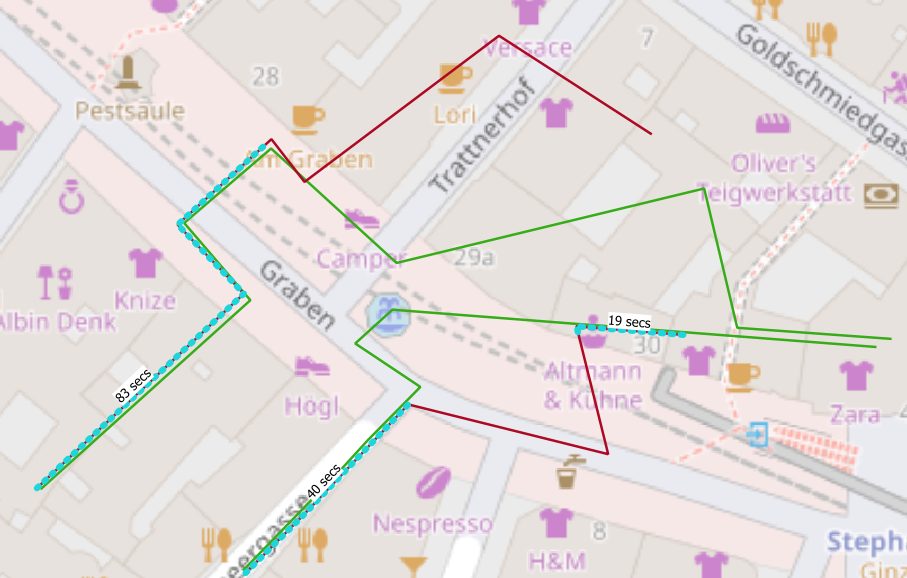
Step 4
For each combination of infected and healthy individual, the segment with the longest passage time is extracted and turned into a linestring with st_makeline.
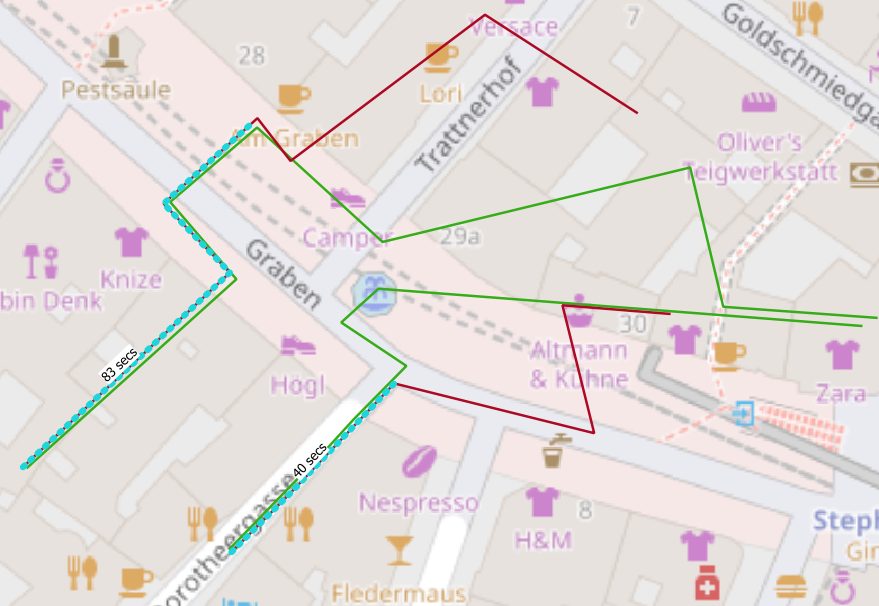
Although the results can serve as a foundation for further analysis, the approach remains bounded by the assumptions made at the start.
MobilityDB, a recently published PostgreSQL extension, offers a much broader set of functions for spatio-temporal problems of this kind.
PgSQL
|
1 2 3 4 5 6 7 8 9 10 11 12 13 14 15 16 17 18 19 20 21 22 23 24 25 26 27 28 29 30 31 32 33 34 |
with points as ( SELECT distinct on (m1.gid) m1.customer_id infectionSourceCust, m2.customer_id infectionTargetCust, m1.gid, m1.geom, m1.recorded m1rec, m2.gid, m2.recorded FROM mobile_points m1 inner join mobile_points m2 on st_dwithin(m1.geom, m2.geom, 2) where m1.infected = true and m2.infected = false and m1.gid < m2.gid AND (m2.recorded >= m1.recorded - interval '1seconds' and m2.recorded <= m1.recorded + interval '1seconds') order by m1.gid, m1.recorded), aggregStep1 as ( SELECT *, (m1rec - lag(m1rec, 1) OVER (partition by infectionSourceCust,infectionTargetCust ORDER by m1rec ASC)) as lag from points), aggregStep2 as (SELECT *, SUM(CASE WHEN extract('epoch' from lag) > 1 THEN 1 ELSE 0 END) OVER (partition by infectionSourceCust,infectionTargetCust ORDER BY m1rec ASC) AS legSegment from aggregStep1), aggregStep3 as ( select *, min(m1rec) OVER w minRec, max(m1rec) OVER w maxRec, (max(m1rec) over w) - (min(m1rec) OVER w) recDiff from aggregStep2 window w as (partition by infectionSourceCust,infectionTargetCust,legSegment) ) select distinct on (infectionsourcecust, infectiontargetcust) infectionsourcecust, infectiontargetcust, (extract('epoch' from (recdiff))) passageTime, st_makeline(geom) OVER (partition by infectionSourceCust,infectionTargetCust,legSegment) from aggregStep3 order by infectionsourcecust, infectiontargetcust, passageTime desc |


