Kafka at Slack: Automating a Mission-Critical Pub-Sub Layer
Slack’s asynchronous Job Queue touches nearly every user action, from link unfurling and notifications to search indexing and security checks. Kafka underpins this queue and acts as the nervous system for other mission-critical data, powering logging pipelines, trace data, billing, and enterprise analytics. Given its central role, a small team took on the challenge of operating Kafka at scale — and over four years, built a system that is largely self-driving.
From Fragmentation to Standardization
Before 2018, multiple teams at Slack ran their own Kafka clusters for different use cases. This led to version fragmentation and duplicated operational effort. The team launched a project to standardize all clusters under a single version managed by one group. Today, Slack runs 10 Kafka clusters across hundreds of nodes, handling roughly 0.7 petabytes of data. The system processes millions of messages per second across hundreds of topics, peaking at an aggregate throughput of 6.5 Gbps.
The push for automation wasn't just about efficiency; it was a necessity for a small team. The goal was to remove the routine operational overhead that frequently led to pages for slow or downed brokers, capacity management issues, and customer support requests regarding consumer lag.
The core operational tasks identified for automation included:
- Routine admin tasks like topic creation, partition count changes, and partition reassignment
- Capacity planning, such as adding or removing brokers
- Replacing brokers and deploying new software versions
- Diagnosing cluster issues during on-call shifts
- Answering questions about whether Kafka consumers are keeping up
Building the Automated Foundation
The unified effort, known internally as Kafka 2, was built on Kafka version 2.0.1 and involved rethinking every layer of deployment and management.
Provisioning with Terraform and Chef
Host management uses Chef to configure the base OS and deploy the Kafka software, with each cluster running under a specific role with custom configs but sharing the same core recipe. Terraform modules create Auto Scaling Groups (ASGs) for each Chef role in AWS, automating node provisioning and deprovisioning.
A major shift was moving from pre-built Debian packages to an internal fork of the Kafka repository. A CI/CD pipeline now builds and releases static binaries to S3, which Chef recipes pull for deployment. This change made provisioning far more reproducible and reliable than the earlier package-based approach.
Zookeeper was a particular pain point. The old Zookeeper 3.4 clusters had to be manually provisioned because unique node IDs were assigned by hand, and you couldn't add new nodes without a cluster-wide restart. Manual provisioning was tedious and error-prone — nodes were sometimes launched in the same AWS availability zone, increasing the blast radius of failures. Upgrading to Zookeeper 3.6 eliminated the need for cluster-wide restarts when replacing brokers. The team then automated unique ID assignment via Consul KV, which assigns IDs when nodes are provisioned but before they join the cluster. This enabled Zookeeper clusters to be fully managed through ASGs via Terraform.
Tuning for Stability
Automating infrastructure alone didn't solve operational instability. Cluster management actions like migrating partitions or re-balancing brokers were disruptive enough to cause pages and missed SLOs. The root cause was hot spotting, driven by several factors.
First, topics had wildly varying partition counts based on load. To smooth out write hot spots, all partition counts were changed to be a multiple of the broker count. Read hot spots were addressed by ensuring consumer counts were evenly distributed across all nodes. As brokers or consumers scaled, partition counts were updated to maintain the multiple-of-broker-count rule, keeping utilization even.
Second, partition rebalance events consumed massive replication bandwidth, starving producers and consumers during peak hours. The team limited the replication bandwidth available to the cluster and altered operations to move only a small number of partitions at a time, enabling many small continuous changes instead of large disruptive bursts. Slower operations were the trade-off, but stability improved.
Despite these tunings, partial failures still caused imbalances over time. To automate recovery, the team adopted Cruise Control, LinkedIn's automation suite, to continuously rebalance the cluster and maintain even node utilization.
Validating via Chaos Engineering
Before cutting over from existing clusters, the team ran chaos experiments on the new cluster in production using dark traffic. Tests saturated various resources under load and terminated brokers under controlled conditions to understand failure modes and their impact on producers and consumers.
These tests revealed that recovery operations were often bottlenecked by packets per second at the host level. Enabling jumbo frames on Kafka instances — which have some of the highest packets-per-second utilization in Slack's fleet — significantly sped up recoveries.
Chaos testing also uncovered edge-case bugs in consumers using the Go Sarama library. While some consumers were migrated to the Confluent Go consumer (which also helped standardize client configurations), others that couldn't be upgraded received workarounds and targeted alerting.
Another key finding was that Zookeeper issues quickly escalated into larger Kafka problems. To limit blast radius, each Kafka cluster now has its own dedicated Zookeeper cluster, even though it's slightly more expensive.
Self-Service Operations
To reduce the operational burden of routine questions from consumer teams, Slack deployed a suite of self-service tools. This reduced the need for teams to understand the state of their pipelines or wait for the Kafka team to check capacity or health.
The team deployed kafka manager to provide visibility into cluster metadata like broker and topic lists, simplifying routine operations such as creating topics and increasing partition counts. For consumer health, they forked kafka offset exporter to export consumer offset information as Prometheus metrics, then built dashboards on top showing per-topic, per-consumer, and aggregated consumption metrics in real time.
To eliminate islands of knowledge, multiple runbooks were consolidated into a single one-page runbook, and various dashboards were merged into one global Kafka dashboard. These tools not only cut operational overhead but also improved security posture by minimizing SSH access to Kafka brokers.
The Cut-Over Upgrade Strategy
The team deliberately avoided in-place cluster upgrades. Confidence was low in guaranteeing zero downtime during upgrades, particularly when jumping multiple versions at once. They also lacked a way to validate a new cluster's behavior — especially when changing underlying hardware types — without risking production.
The solution is a standard cut-over procedure to a fresh cluster:
- Start a new cluster
- Run validation tests using dark traffic
- Stop producing data to the old cluster
- Start producing data to the new cluster
- Turn off the old cluster after the retention window expires
The main downside is coordinating consumer cut-overs, but the strategy is proven and reusable. It also applies to other scenarios like moving topics across clusters or trialing new EC2 instance types, making it a versatile operational standard beyond just software upgrades.
Traffic overload and the split
By early 2021, Slack's single 90-broker Kafka cluster was running out of headroom. Network throughput had hit a ceiling of 40,000 pps, which caused the broker to struggle keeping up with consumers during regular workloads and made spikes even harder to absorb. Downstream pipelines fell behind, and daily consumer offset lag on the logging pipeline pushed the team out of its freshness SLA whenever lag exceeded 500 million messages.
To shed load, the team split the largest topics onto separate, dedicated clusters. These ran on newer nitro-enabled d3en instances instead of the older d2 generation. A comparable workload that needed 90 brokers on the old hardware could run on just 20 brokers of the new type — roughly a 2.5x efficiency gain.
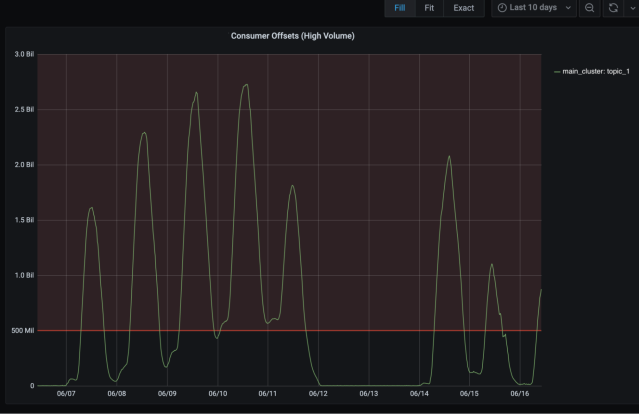
This caused frequent, pronounced spikes in consumer offset lag on the logging cluster. In the worst cases, log latency stretched to about 1.5 hours. After migrating the three biggest topics off the main cluster, the lag collapsed to a worst case of 3–4 minutes.
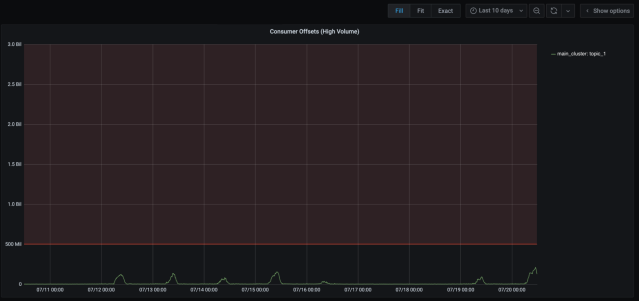
The operational strain eased too. On-call alerts for the logging pipeline dropped from 71 in one month to 9 in the next, and the smaller dedicated clusters made management simpler — cluster-wide operations complete faster and noisy-neighbor interference largely disappears.
Keep the control plane open
Slack's approach to running Kafka has relied entirely on open source tooling: Cruise Control for rebalancing, Kafka Manager for operational visibility, plus Chef and Terraform for provisioning. Standard SRE practices and monitoring with Kafka offset exporter fill in the rest, producing a cluster that is both self-healing and self-service.
The team has shared its Kafka configuration for others building similar setups. Slack has run this architecture for several years and is now extending Kafka's role with Change Data Capture (CDC) to support the Permission Service's caching layers and push near-real-time updates to the Data Warehouse. A dedicated Data Streaming team has been formed to maintain clusters and standardize Kafka libraries and tooling across the company.