A common model for a complex path
Notifications touch nearly every system Slack runs. A single request passes through the webapp monorepo, job queue, push service, and several third-party services before landing on iOS, Android, Desktop, or web clients. The decision logic for when and where to send adds another layer of complexity, and features like Huddles and Canvas have only made the workflow more intricate since 2017.
That complexity made debugging painful. Each system had its own logging pipeline and data format, so investigating a dropped notification meant manually correlating data from different backends and contexts. The process required deep expertise across the entire stack and often took days. Customer tickets about notifications reflected this: they had the lowest NPS scores and the longest resolution times of any category.
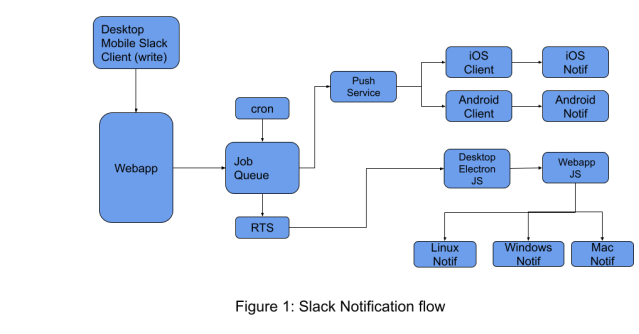
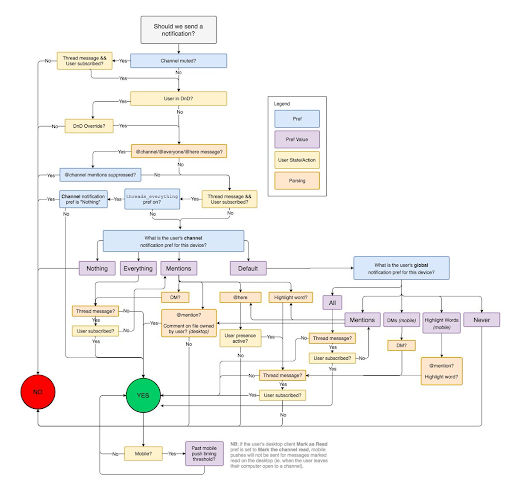
The fix was to trace notifications as a first-class flow, standardizing the format and semantics of events across all systems. The goal was to answer basic questions for any notification: was it sent, where was it sent, was it viewed, and did the user open it?
Defining the notification flow
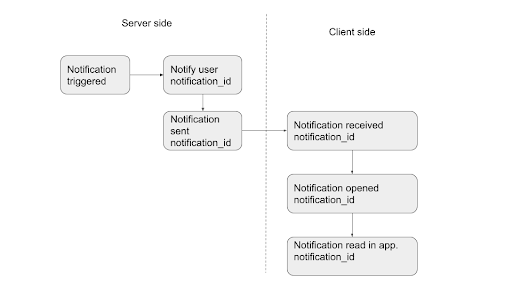
The first step was modeling the notification process consistently across every client. Slack created a notification spec that identified all events in a trace, defined an idealized funnel, and set the context in which each event would be logged. The semantics of a span and event names had to be agreed upon across platforms, which proved challenging.
Mapping the flow to a trace
Slack chose SlackTrace to represent the flow because a trace naturally maps to a sequence of events, and all systems can already emit span event data. But the existing tracing model presented two problems.
- Sampling. Backend requests were sampled at 1%, but the customer experience team needed 100% fidelity for notification flows. Scenarios like
@hereand@channelcan push to hundreds of thousands of users across multiple devices, generating billions of spans per message — impossible to ingest at full fidelity using the old model. - Context coupling. OpenTelemetry instrumentation tightly couples tracing to a request context. A notification executes in multiple contexts and does not map cleanly to a single request, breaking that assumption.
The solution was to model each notification sent as its own trace. Each notification got a notification_id used as the trace_id for its flow. The sender's trace was causally linked to each notification trace via span links.
This approach had several advantages:
- It decouples trace context propagation from request context propagation, simplifying instrumentation.
- Each notification trace is smaller and easier to store and query than one massive trace per message.
- Notification traces can be sampled at 100% while sender traces stay at 1%.
- Span links preserve causality across the separate traces.
The teams mapped each step of the flow to a span, producing a shared table of definitions.
| Span name | Description | Trace id | Parent span id | Span tags |
| notification:trigger | Determine if the notification should be sent or not. | Trace_id is the request id. Span links have a list of notification_id’s sent. | trigger_type (DM, @here, @channel), user_id, team_id channel_id message_ts notification_id | |
| notification:notify | Notify the user on all of their clients. | Trace_id is notification_id. | Id of notification:trigger span. | user_id, team_id channel_id message_ts |
| notification:sent | Notification is sent to a slack client to all the multiple slack clients on the user’s device. | Trace_id is notification_id | ID of notification:notify | channel_id platform specific notification tags. |
| notification:received | Notification is received on the user’s slack client. | Trace_id is notification_id | ID of notification:sent span. | Service name is client name and client tags. |
| notification:opened | User opened a notification on the device. | Trace_id is notification_id | ID of notification:received span. | Service name is client name and client tags. |
| notification:read in app | User clicked on the notification to view the notification in the app.The start of the span is right after opening. The end of the span is when the message is rendered in the channel. | Trace_id is notification_id | ID of notification:opened span. | Service name is client name and client tags. |
Why a trace works better
- Consistent format: Every service reports the same span event format, eliminating per-system data schemas.
- Source identification: The service name field (Desktop, iOS, Android) identifies which client generated an event.
- Standard event names: Span name and service name together give each event a unique identifier, such as notification:received for iOS, Android, and Web, so queries work uniformly.
- Uniform timestamps: Timestamps and durations are recorded in a consistent resolution and time zone, with a default duration value of 1 for one-off events.
- Built-in sessionization: Using the notification ID as the trace ID means the entire flow is already grouped. Events that lack a notification ID, like notification read triggers, can still be joined via the trace ID.
- Simpler instrumentation: Tags are added once per trace, localizing changes and making them unit-testable.
- Flexibility: Clients can add tags to existing spans or add new spans without altering queries on existing data.
- No duplicate events: Unique SpanIDs prevent the double reporting that previously required backend de-duplication jobs.
- Preserved causality: Span links connect related traces without ad hoc data modeling.
Using trace data at Slack
After rolling out end-to-end tracing across all clients, the traces flow into both a real-time store and the data warehouse through the existing trace ingestion pipeline.
Developers use the traces to triage issues. Previously, investigating a dropped notification meant combing through logs from multiple systems for hours. Now, anyone can open a trace and see exactly where in the flow a notification failed.
The customer experience team also resolves tickets faster. Because traces are readable, CE engineers can answer customer questions directly without escalating to development. This reduced time-to-triage for notification tickets by 30%.
Analytics beyond debugging
Notification trace data is ingested into both ElasticSearch/Grafana and the data warehouse. iOS and Android engineers, who typically do not use dashboarding tools, have built effective Grafana dashboards and alerts to monitor client performance.
Data scientists query the warehouse data for long-term performance regressions. They have also used it to build funnel analytics on notification open rates — data that previously would have required separate instrumentation and a separate pipeline. The trace data proved sufficient.
The most surprising outcome: data scientists mined trace data to identify bugs in both the applications and the instrumentation itself. Over the two years since rollout, notification traces have been used for many purposes beyond the initial debugging use case, a strong argument for trace data acting as a single source of truth throughout the organization.
What Notification Traces Taught Slack About Flow Modeling
Slack’s customer experience (CE) team now resolves notification issues 30% faster after moving from ad-hoc debugging to a trace-based model. The same model also cut escalations to the development team. What started as a debugging tool, however, has grown into a shared data source with a wider set of use cases across the company.
Why Decoupling Context Matters
The core enabler was Slack’s SlackTrace framework, which separates trace context propagation from a request context. Without this separation, instrumentation would have been tightly coupled to the synchronous request lifecycle. That decoupling made it straightforward to instrument several backend services for notification flows without the usual side effects: cluttered instrumentation code and excessively large traces.
Reusing Trace Data for Analytics
An unintended but significant benefit emerged: notification trace data proved useful beyond debugging. Slack has repurposed the same traces to run funnel analytics in production. Modeling product analytics as traces yields consistent, high-quality data across a complex stack, and the built-in sessionization removes the need for separate jobs to de-duplicate and sessionize raw trace data.
Over the past two years, backend and frontend engineers plus data scientists have treated this trace data as a single source of truth for varied needs. That broad adoption has pushed Slack to model several other flows as traces. At present, at least a dozen tracers run concurrently in the production Slack app, with more flows using the same strategy.
The Takeaway
The transition from request-centric observability to flow-centric traces required careful modeling of how notifications propagate across services. Done well, that effort pays off not only in faster incident response but in a reusable data foundation for analytics across an entire engineering and data organization.


