
Conversion rates and user experience tend to move together, which means lifting conversions usually starts with fixing the experience. Understanding your users is a prerequisite for that work, but interviewing customers one at a time doesn't scale. The tools below are aimed at collecting user behavior data quickly enough to act on.
Why visitors don't convert
Five common failure modes account for most missed conversions:
- Confusing navigation. If reaching the checkout is harder than navigating a cornfield maze, users will hit roadblocks and abandon the flow.
- Guessing instead of knowing. People who built the product struggle to see it through a visitor's eyes; without voice of customer data, changes rest on guesswork.
- Distraction. Unimportant page elements pull attention away from the CTA, and users who lose the flow may frustrate out and leave, possibly for a competitor.
- Invisible roadblocks. Familiarity with your own site makes it hard to spot the issues that block users.
- Low trust. Poor design, spelling errors, and low-quality imagery all turn potential customers away.
A clunky site irritates users and they won't convert. Knowing what visitors want, and why, is what makes an experience they like possible.
Four tools for improving UX and conversions

Heatmaps
Heatmaps render your analytics visually so you can spot popular and unpopular regions of a page. Three types are available:
Scroll maps
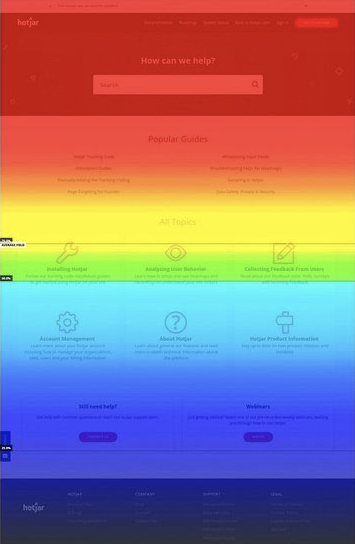
Scroll maps show how far users scroll down a page. Red areas indicate more visitors reached that point; blue areas indicate low activity. They reveal whether key information is actually seen.
Click maps
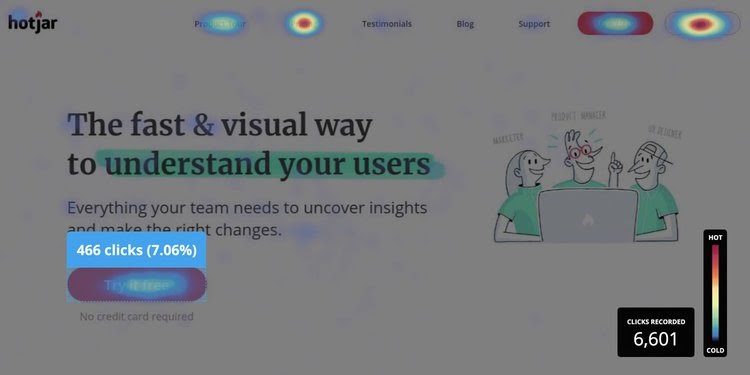
Click maps aggregate where users click or tap across desktop and mobile. They show whether CTAs sit in the right place, whether people are clicking clickable items, and whether users are rage clicking.
Move maps

Move maps track mouse movement across the page. Research indicates mouse movement correlates with eye movement, so these maps suggest what people look at.
Uses for heatmaps:
- Check whether important information falls in the "hottest" areas or goes unseen in regions visitors don't scroll to
- Reposition essential information based on where attention actually lands
- Spot where attention drops off
- A/B test to observe how behavior shifts
- Confirm clicks and taps land on clickable elements
- Compare behavior across desktop, tablet, and mobile
Recordings
Recordings are live playbacks of individual users, showing exactly how visitors navigate, where they hit roadblocks, and providing context for web analytics. They capture mouse movement, scrolling, clicks, and keyboard strokes across multiple pages.
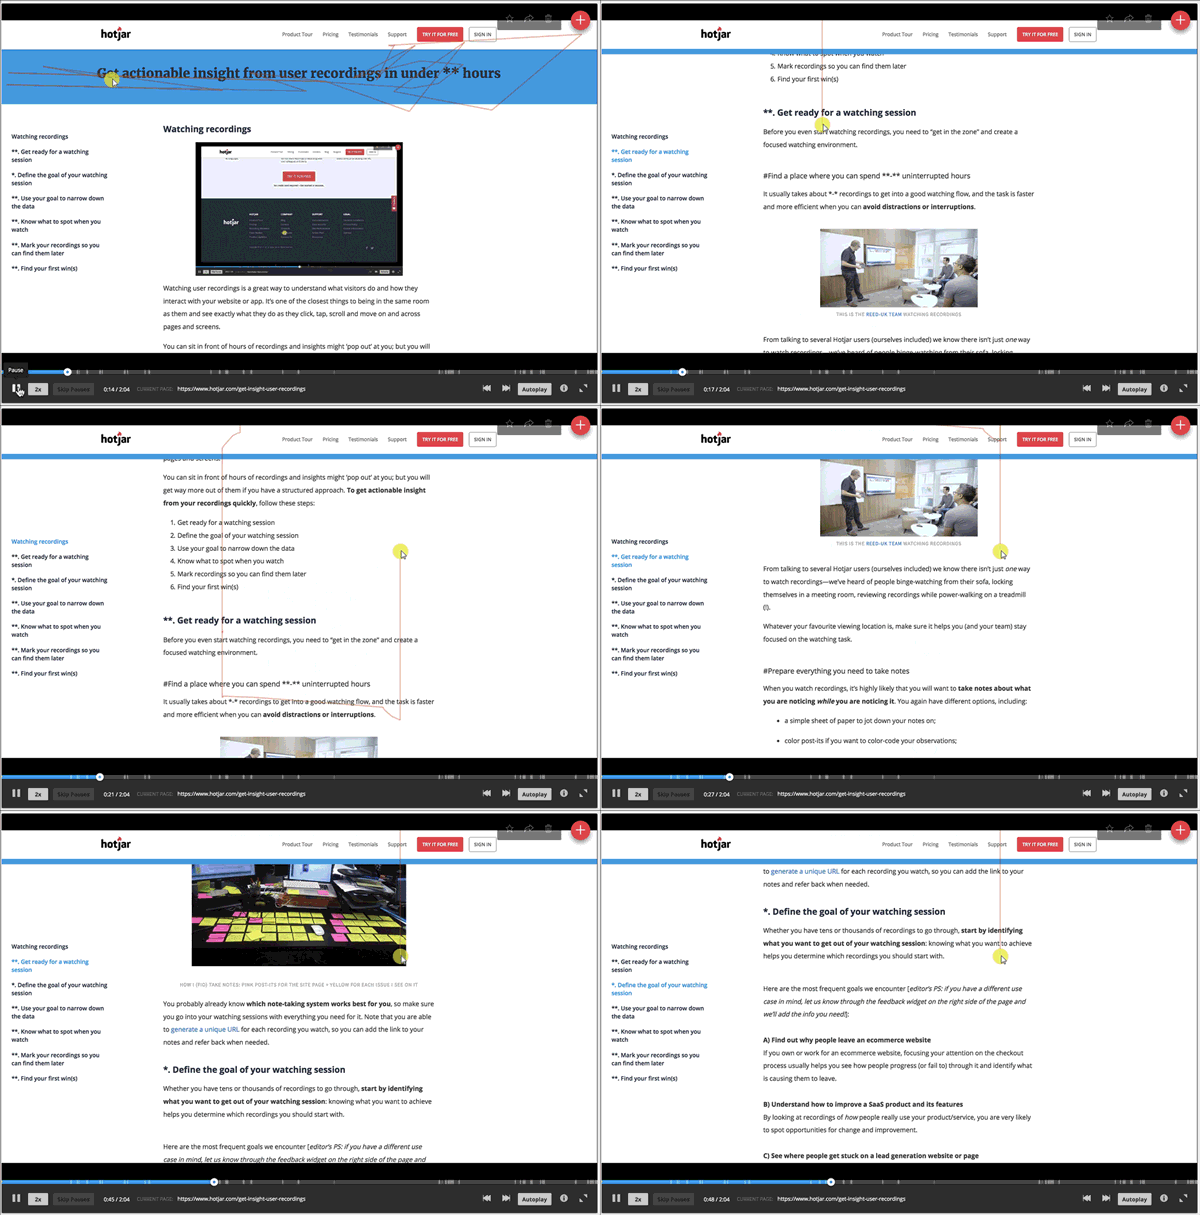
Uses for recordings:
- Explain bounce rate by analyzing why visitors leave a page
- Empathize with visitors by understanding their roadblocks and frustrations
- Uncover what stops visitors from converting
- Find bugs and catch behavior that diverges from plan, such as pages that load differently on mobile versus desktop
- Measure how long conversion really takes and identify what delays it
Incoming Feedback
Incoming Feedback places feedback widgets directly on your site, so visitors can say what they like and dislike without guesswork on your side. Users can also highlight specific elements, which removes ambiguity about what they're referring to.
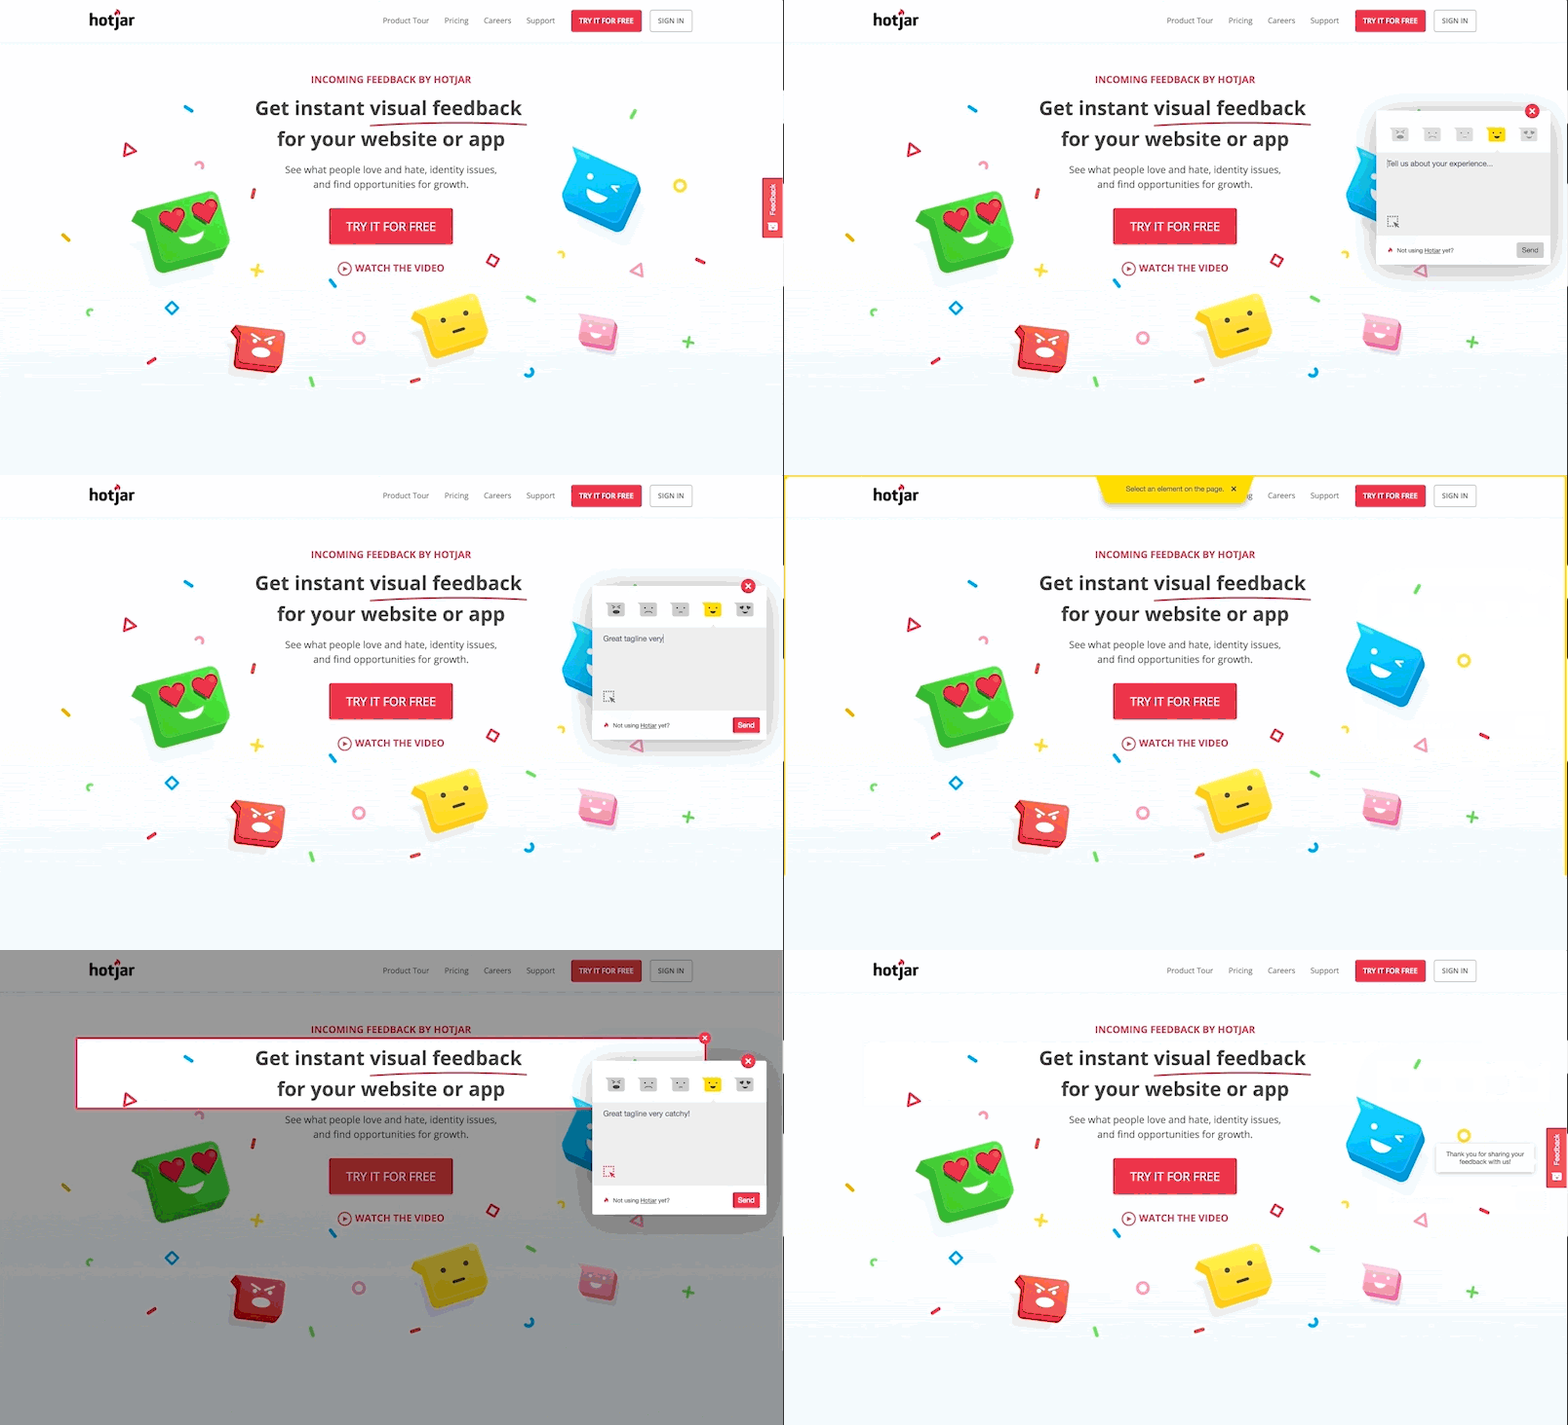
Uses for incoming feedback:
- Collect feedback on specific elements and learn why users like or dislike them
- Gather the emotions of your website visitors
- Pinpoint exactly which areas are causing trouble
- Track changes over time to see whether UX is improving
Surveys
Surveys collect voice of customer (VOC) data in two forms: on-site and off-site.
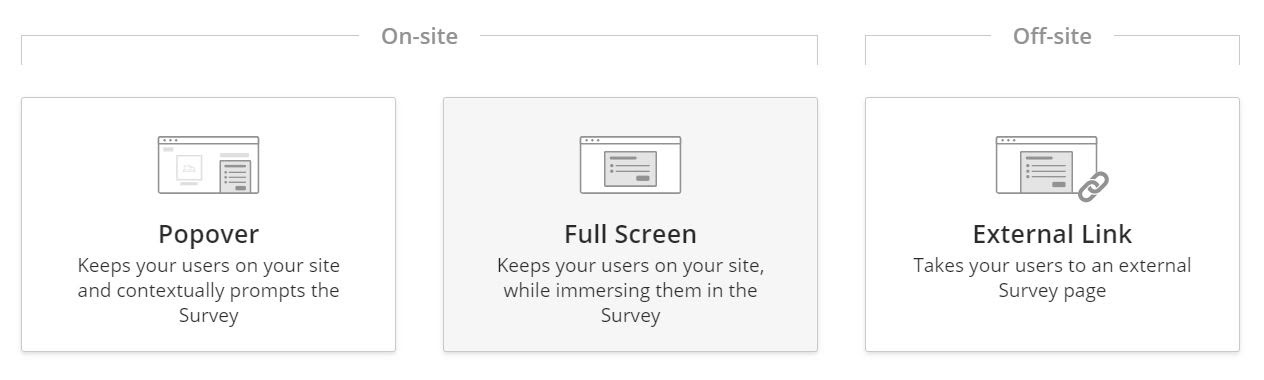
On-site surveys ask users questions on specific pages. Open-ended or closed-ended questions, or a mix of both, get you inside the visitor's head and yield feedback for improving the site and lifting conversions.
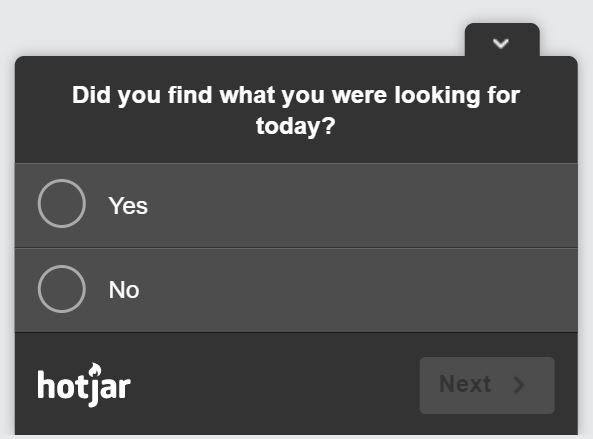
On-site surveys can also follow up on answers. If you ask "did you find what you were looking for today?" and someone clicks "no," a follow-up question can ask them to explain why.
Uses for surveys:
- Validate new product ideas
- Understand why visitors like or dislike aspects of the site
- Find areas that need fixing, for example by placing an on-site survey on high-bounce pages to learn why users leave
- Gather insight from users
- Improve conversions through post-purchase surveys
- Show customers you care about their input
All four tools produce data in formats the whole team can read, but the value comes from letting that data drive decisions.