

Tracking What Users Actually Do
Most developers touch Google Analytics only once, when pasting the pageview snippet into a site’s templates. The standard gtag.js or analytics.js implementation does nothing more than record page loads, leaving a mountain of behavioral data untapped. Worse, design decisions get made without that data — features get removed even though regular users depend on them daily.
Five Google Analytics features close that gap, letting developers and designers measure real interactions rather than guessing at them.
Events: Measuring Clicks and Other Interactions
Out of the box, Google Analytics tracks pageviews only. To capture button clicks, form submissions, or any other specific action, you need to fire a separate event. That requires adding code with the appropriate Event Category, Action, and Label fields. A shorthand version is also available.
Once fired, events appear in the UI under Behavior > Events > Top Events. A sensible convention: use Event Category for function groups (e.g., Page Engagement, Ecommerce), Event Action for the exact user action (Click, Scroll, Form Submission), and Event Label for the URL where the event occurred.
Google Tag Manager offers an alternative to hard-coding events. After installing the GTM snippet, create a new tag, pick Google Analytics under Tag Configuration, and choose Event as the tag type. Then attach a trigger — GTM includes built-in click triggers — and test in preview mode before publishing.
Whichever route you pick, stick with it sitewide. Mixing hard-coded event tags with Google Tag Manager tags will double-track the same action and pollute your data with duplicates.
Events are also mandatory for Ecommerce and Enhanced Ecommerce tracking. Even after enabling those settings in the interface, you must add separate ecommerce event tags to transmit the full product and transaction data.
Scroll Depth: How Far Users Really Go
Scroll tracking is a special case of event tracking, useful for learning what content users actually reach. You can fire a scroll event when a specific element enters the viewport or after the user scrolls a set percentage of the page.
Google Tag Manager simplifies this with its Scroll Depth trigger — create a new trigger, select Scroll Depth, and fill in the parameters.
The resulting data shows how far down the page users are willing to go. You can then slice it by device, browser, time of day, or location to decide where a widget belongs for a given audience. This eliminates the need for separate scroll tracking software.
Timing Hits: More Accurate Session Durations
Avg. Session Duration looks straightforward but comes with a caveat: Google Analytics computes it from timestamp gaps between hits. That’s why most bounces — single-pageview sessions — report a duration of 00:00:00, even if the visitor lingered for minutes.
Timing hits fix that. They measure time on page without adding another pageview or event, firing at set intervals via dedicated code. Results appear under Behavior > Site Speed > User Timings in Google Analytics. As an alternative, since timing hits are capped at 10,000 per day, you can fire custom events at intervals instead and read them in the Top Events report.
One warning: build in a timeout so timing hits don’t keep firing if someone leaves the page open in a background tab.
Behavior Flow: Seeing the Whole Journey
Events and timing hits create scattered data points. The Behavior Flow report solves that by visualizing the path from landing page through subsequent pageviews and actions until users drop off.
By default, the report keys off landing pages and destination pages. You can switch focus to events through the dropdown beneath the report header, choosing “Events” or “Pages and Events.” This makes it easier to spot where users get stuck or abandon a funnel.
Large sites present a problem: Behavior Flow may sample data when traffic is heavy. Shrink the date range to reduce the sample, or use the “Show fewer connections” option under the “Level of Detail” dropdown to simplify the visualization.
Custom Reports: Tailoring Data for Design Research
When Behavior Flow isn’t enough, Custom Reports offer more flexibility. Head to Customization > Custom Reports and hit “New Custom Report.” Three formats are available:
- Explorer, mirroring the standard Google Analytics layout.
- Flat Table.
- Map, suited for geographic overlays.
Filters support exact match or regular expressions. Be careful when combining dimensions and metrics, though — mismatched scopes produce odd results. If one metric is recorded per user and another per session, mixing them in one report can mislead. Google’s Help Center details scope behavior in its Processing section.
Goal Tracking Reveals What Actually Drives Conversions
Most websites exist to achieve a measurable business objective — selling products, collecting leads, or building awareness. Google Analytics shines here because it lets you move beyond raw pageview counts and tie specific user actions to those outcomes.
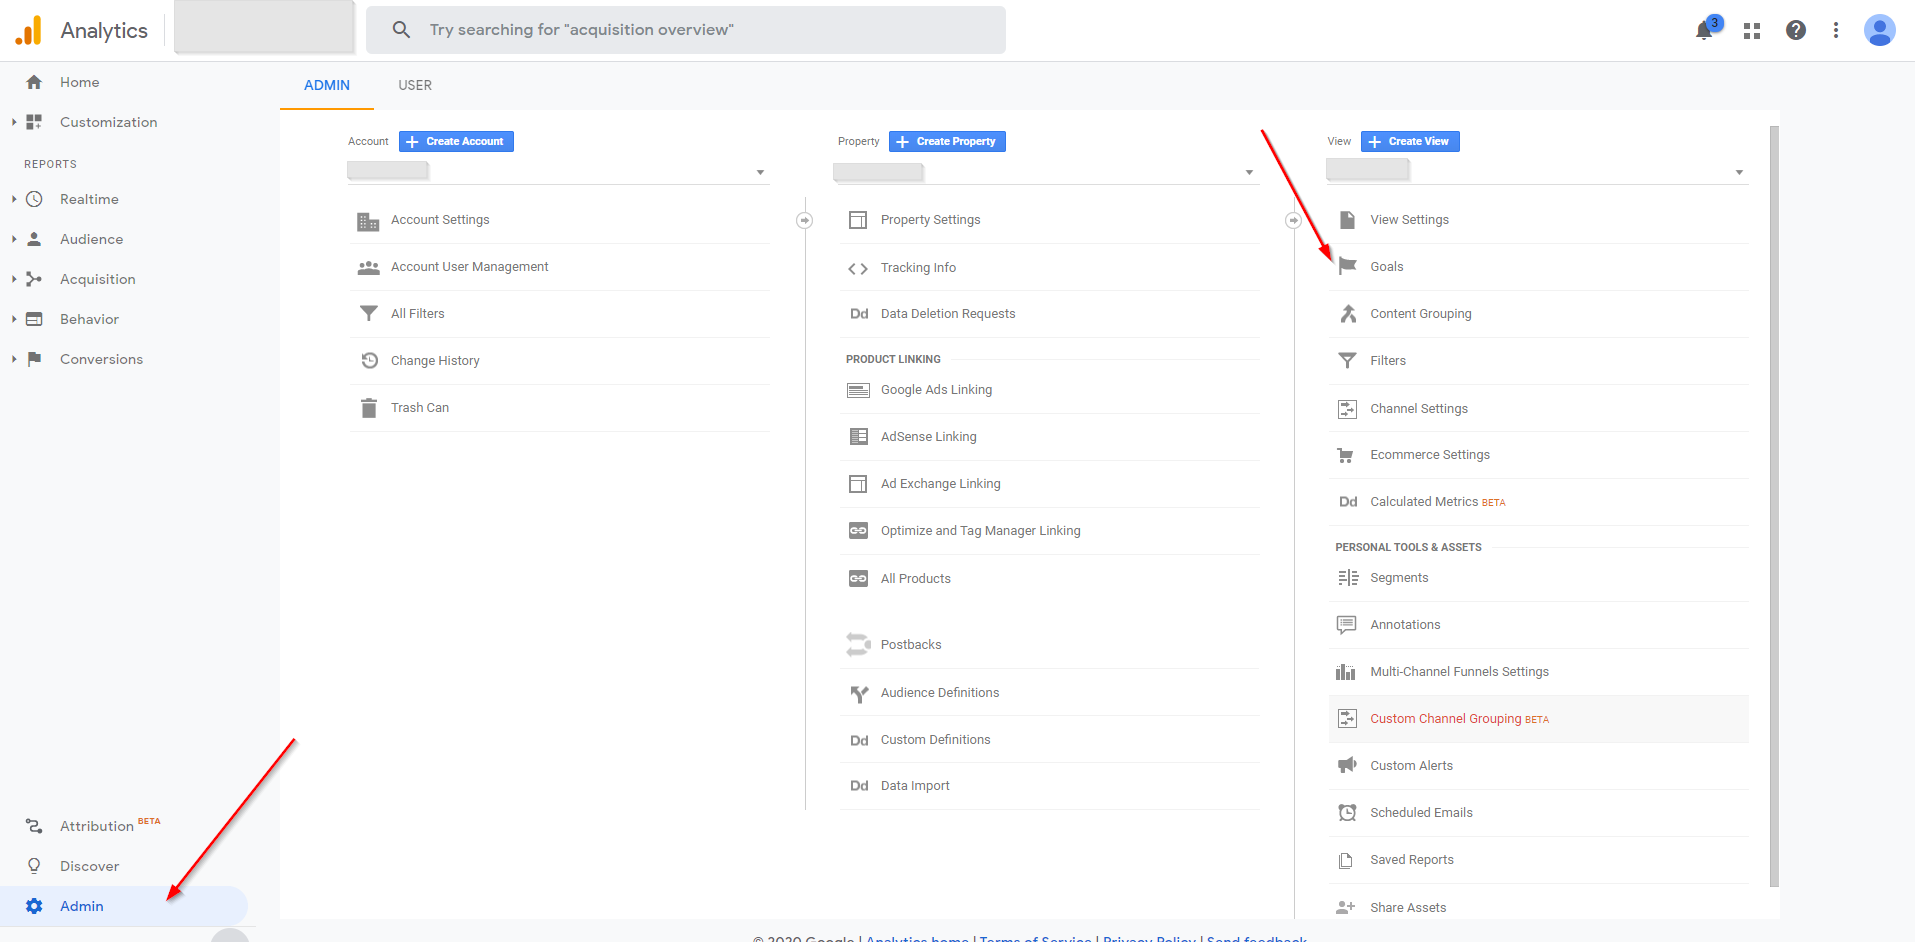
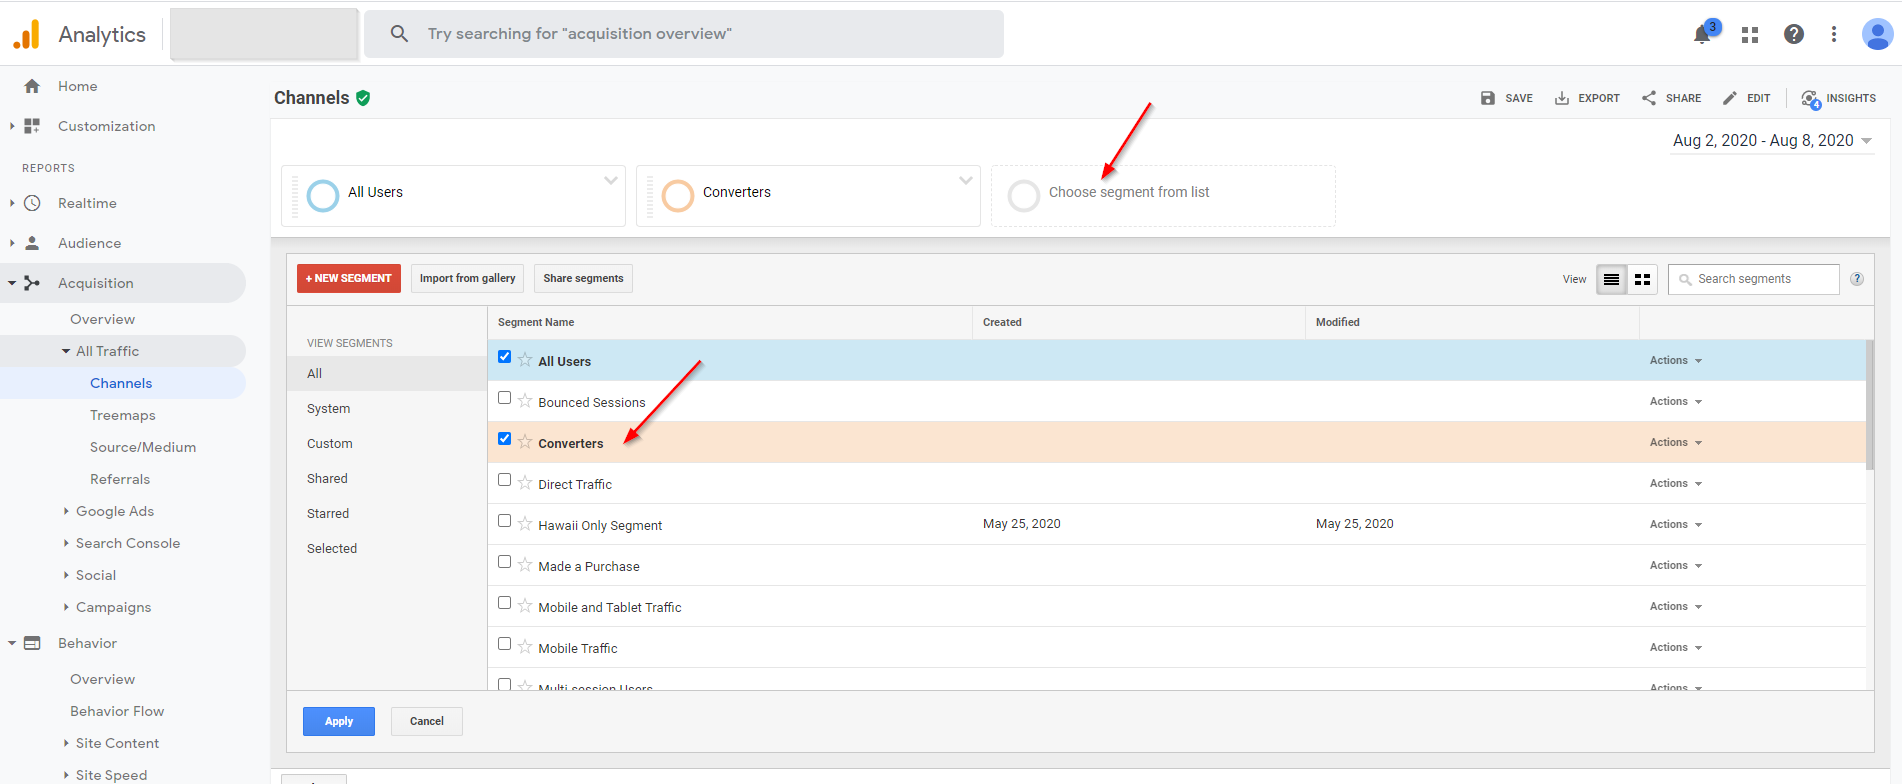
You can define these key actions as goals via Admin > Goals > New Goal. Goals can be built from a template or created custom, based on destination pageviews, events, session duration, or pages-per-session thresholds. Once goals are active, Google Analytics provides default Converters and Non-Converters segments, letting you compare behavior between the two groups directly in your reports.
For deeper insight, you can customize these segments. The Actions option lets you duplicate an existing segment and add criteria such as demographics, language, or traffic source. Under Advanced > Sequences, you can even define segments based on the exact chain of actions users took before converting. Alternatively, you can build segments from scratch through the Segments dropdown and the New Segment button.

Beyond the Basics
The features described here are just a starting point. Google Analytics also offers the Measurement Protocol, which lets you send data from non-browser sources like IoT devices. For further learning, Google provides official documentation for developers, a support help center, and the Google Analytics Academy for structured courses.
- Google Developers — Google Analytics Documentation
- Analytics Help — Google Support
- Google Analytics Academy
Before deploying analytics on any site, verify that your implementation complies with local data privacy regulations. Google provides a support article on compliance that is worth reviewing. When the need for actionable data is balanced against user privacy rights, Google Analytics remains one of the most capable free tools available to web developers and designers.


