The Anatomy of a Queue Meltdown
A production queue backs up to 10,000 jobs in under an hour. Workers are healthy, processing jobs promptly. Nothing else looks wrong. The culprit turns out to be a long-running transaction opened by another team on a database follower. Kill that transaction, and the backlog clears almost instantly. How does one idle transaction torpedo a table's throughput?
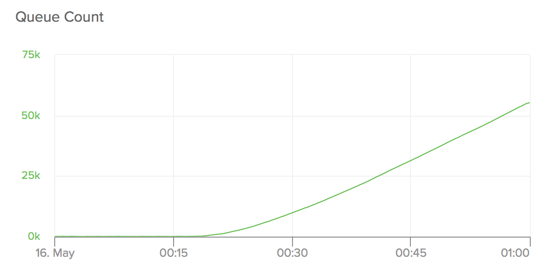
With a sustained churn of about 50 jobs per second through a jobs table, the effect reproduces quickly and, once started, degrades to the point of no recovery in about 15 minutes. The question is why.
Why Bother With a Database-Backed Queue?
Using Postgres as a job queue seems backwards — databases aren't optimized for this workload — but it buys one crucial property: transactional consistency. When an operation fails and rolls back, any job it enqueued rolls back with it. Workers can't see a job until its transaction commits. Without that isolation, a worker can pick up a job before the request that created it is fully committed, a failure mode documented in the Sidekiq FAQ. There are good reasons not to go this route, but a few best practices can take this pattern surprisingly far.
A Controlled Explosion
Fixing a problem requires reproducing it. The que-degradation-test tool does exactly that with three processes: a job producer, a worker, and a "longrunner" that opens a transaction and sits idle. All charts in this article come from data it generated.
Lock Times Climb First
Under stable conditions, a worker's exclusive lock on a job takes under 0.01 seconds. As the oldest transaction ages, that number escalates to 0.1 seconds or more — a 15x jump. Slower locking means fewer jobs worked per unit time. If production outpaces processing long enough, the queue runs away.
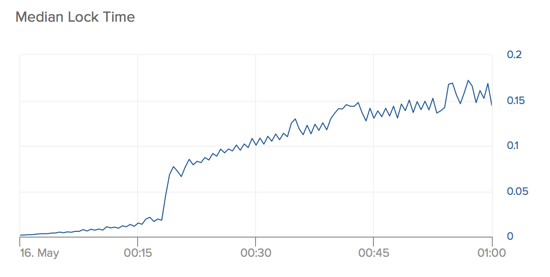
The initial suspicion fell on the locking mechanism. The original implementation used Queue Classic, which has a relatively inefficient locking strategy. Migrating to Que(pronounced "kay"), known for better performance, delayed the failure but didn't eliminate it. Both libraries suffer the same root cause.
How Job Locking Actually Works
Que's locking algorithm relies on a recursive Postgres CTE. A recursive CTE follows the pattern <non-recursive term> UNION [ALL] <recursive term> and executes by: first evaluating the non-recursive term into a temporary working table; then, while that table is non-empty, evaluating the recursive term with the working table's contents substituted for the recursive reference. The recursive term's results replace the working table in an intermediate step, and iteration repeats.
WITH RECURSIVE jobs AS (
  SELECT (j).*, pg_try_advisory_lock((j).job_id) AS locked
  FROM (
    SELECT j
    FROM que_jobs AS j
    WHERE queue = $1::text
    AND run_at <= now()
    ORDER BY priority, run_at, job_id
    LIMIT 1
  ) AS t1
  UNION ALL (
    SELECT (j).*, pg_try_advisory_lock((j).job_id) AS locked
    FROM (
      SELECT (
        SELECT j
        FROM que_jobs AS j
        WHERE queue = $1::text
        AND run_at <= now()
        AND (priority, run_at, job_id) > (jobs.priority, jobs.run_at, jobs.job_id)
        ORDER BY priority, run_at, job_id
        LIMIT 1
      ) AS j
      FROM jobs
      WHERE jobs.job_id IS NOT NULL
      LIMIT 1
    ) AS t1
  )
)
SELECT queue, priority, run_at, job_id, job_class, args, error_count
FROM jobs
WHERE locked
LIMIT 1
The non-recursive term finds the highest-priority eligible job, where priority is determined by run_at < now() and priority. It attempts to claim it via pg_try_advisory_lock, which is atomic and fast. On success, the clause WHERE locked LIMIT 1 truncates the search. On failure, the recursion continues.
Each recursive pass adds a predicate — AND (priority, run_at, job_id) > (job.priority, job.run_at, job.job_id) — that confines the scan to lower-priority jobs resembling an ordered crawl through the table. The recursion ends in one of two ways: either a job gets locked and LIMIT halts the iteration, or the jobs table has no remaining rows and the select returns empty, terminating the expression.
The jobs table's primary key on (priority, run_at, job_id) normally keeps this efficient. Adding randomness to reduce lock contention might help, but it can't explain a multi-order-of-magnitude slowdown.
The cost of invisible rows
Peeking further into the test data reveals a second, stronger correlation: as the oldest transaction ages, dead tuple counts in the jobs table climb steadily. By the end of the experiment, that figure approaches 100,000 dead rows.
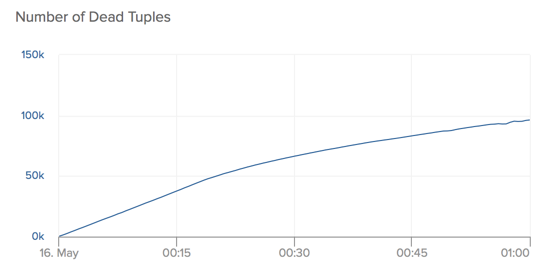
Postgres's automated VACUUM is supposed to reclaim those rows, but a manual run shows they cannot be removed:
=> vacuum verbose que_jobs;
INFO:  vacuuming "public.que_jobs"
INFO:  index "que_jobs_pkey" now contains 247793 row versions in 4724 pages
DETAIL:  0 index row versions were removed.
3492 index pages have been deleted, 1355 are currently reusable.
CPU 0.00s/0.02u sec elapsed 0.05 sec.
INFO:  "que_jobs": found 0 removable, 247459 nonremovable row versions in 2387 out of 4303 pages
DETAIL:  247311 dead row versions cannot be removed yet.
...
The final line — “247311 dead row versions cannot be removed yet” — is the key. Those rows are still potentially visible to some open snapshot in the system, which brings us into the mechanics of Postgres MVCC.
How MVCC flags rows
Postgres implements MVCC (Multiversion Concurrency Control) to deliver transaction isolation — the “I” in ACID. The model guarantees that every in-flight SQL statement sees a consistent snapshot, regardless of concurrent writes. Consequently, a DELETE does not physically remove a row; it merely marks it as deleted so that any snapshot that began before the delete can still read it. Once no snapshot can possibly need the row, a VACUUM pass can safely purge it.
The mechanism relies on two hidden columns, xmin and xmax, present on every Postgres table. Each write transaction receives a transaction ID (xid). xmin records the xid at which a row version was created — the minimum transaction for which it becomes visible. xmax holds the upper bound: the xid at which the row was deleted or updated. For a row that remains available to all new transactions, xmax is 0.
term-A-# select xmin, xmax, job_id from que_jobs limit 5;
 xmin  | xmax | job_id
-------+------+--------
 89912 |    0 |  25865
 89913 |    0 |  25866
 89914 |    0 |  25867
 89915 |    0 |  25868
 89916 |    0 |  25869
(5 rows)
Consider a second console opening a new transaction:
term-B-# start transaction isolation level serializable;
START TRANSACTION
Now a delete issued from outside that transaction:
term-A-# delete from que_jobs where job_id = 25865;
DELETE 1
The deleted row — still visible to the second transaction — now carries a non-zero xmax:
term-B-# select xmin, xmax, job_id from que_jobs limit 5;
 xmin  | xmax  | job_id
-------+-------+--------
 89912 | 90505 |  25865
 89913 |     0 |  25866
 89914 |     0 |  25867
 89915 |     0 |  25868
 89916 |     0 |  25869
(5 rows)
Any new operation with an xid of 90506 or higher will no longer see job_id 25865.
Index scans fight through dead tuples
Postgres's default index is a B-tree whose leaves store TIDs (tuple identifiers). A TID points to the physical location of a row in the heap, from which Postgres reconstructs the full tuple. Critically, the index itself holds no visibility information1. To decide whether a tuple is visible to the current transaction, Postgres must fetch the tuple from the heap and check it against the active snapshot.
That check lives in the code path driven by index_getnext, which generically scans any index type. The routine loops: index_getnext_tid descends the B-tree to fetch a candidate TID, then index_fetch_heap pulls the full tuple and validates visibility against the snapshot carried in the IndexScanDesc2.
/* ----------------
 *		index_getnext - get the next heap tuple from a scan
 *
 * The result is the next heap tuple satisfying the scan keys and the
 * snapshot, or NULL if no more matching tuples exist.
 *
 * On success, the buffer containing the heap tup is pinned (the pin will be
 * dropped in a future index_getnext_tid, index_fetch_heap or index_endscan
 * call).
 *
 * Note: caller must check scan->xs_recheck, and perform rechecking of the
 * scan keys if required.  We do not do that here because we don't have
 * enough information to do it efficiently in the general case.
 * ----------------
 */
HeapTuple
index_getnext(IndexScanDesc scan, ScanDirection direction)
{
	HeapTuple	heapTuple;
	ItemPointer tid;

	for (;;)
	{
		if (scan->xs_continue_hot)
		{
			/*
			 * We are resuming scan of a HOT chain after having returned an
			 * earlier member.  Must still hold pin on current heap page.
			 */
			Assert(BufferIsValid(scan->xs_cbuf));
			Assert(ItemPointerGetBlockNumber(&scan->xs_ctup.t_self) ==
				   BufferGetBlockNumber(scan->xs_cbuf));
		}
		else
		{
			/* Time to fetch the next TID from the index */
			tid = index_getnext_tid(scan, direction);

			/* If we're out of index entries, we're done */
			if (tid == NULL)
				break;
		}

		/*
		 * Fetch the next (or only) visible heap tuple for this index entry.
		 * If we don't find anything, loop around and grab the next TID from
		 * the index.
		 */
		heapTuple = index_fetch_heap(scan);
		if (heapTuple != NULL)
			return heapTuple;
	}

	return NULL;				/* failure exit */
}
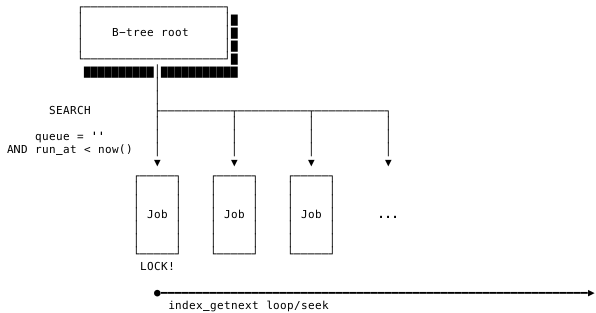
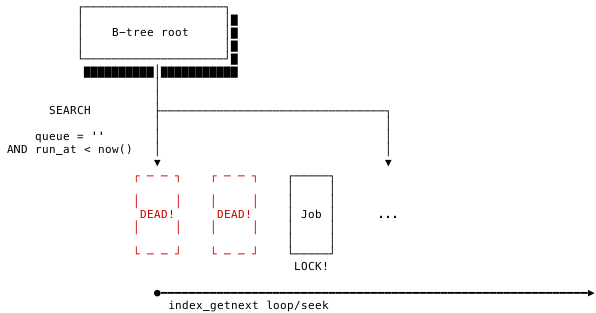
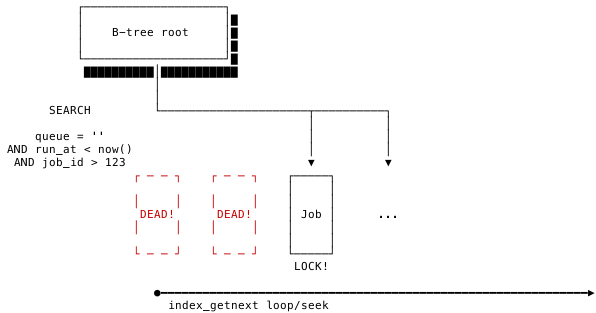
This explains the performance collapse. As dead tuples accumulate in the index, every lock attempt enters a hot loop: descend the B-tree, retrieve an invisible tuple, discard it, repeat. By the end of the experiment, each worker cycled through roughly 100,000 such iterations before finding a live job — and every successfully worked job deposited a new dead tuple, making the next lock progressively worse.
Under ideal conditions, a lock search finds a live job immediately:
Degraded, the search must wade through a trail of dead tuples:
Job queues are especially prone to this failure mode because they tend to lock one job at a time, keeping individual waits short when healthy but amplifying the pathology when the index fills with garbage.
Improving lock specificity
The core problem is that the index on the jobs table has become nearly useless — searching it is little better than a sequential scan. Even after matching the queue name and run_at predicates, Postgres must sift through thousands of dead rows before reaching a usable one.
WHERE queue = $1::text
AND run_at <= now()
Que's primary key on the jobs table includes job_id as its third column. If the locking query could also constrain on job_id — using a reasonably recent value — the B-tree search would skip past the bulk of dead tuples and land near a live job directly:
Because Que processes jobs in arrival order, a worker can reuse the ID of its last completed job as a lower bound. The modified work loop looks like this in pseudocode:
last_job_id = nil

loop do
  # if last_job_id is nil, the extra constraint on job_id is left out of the
  # lock query
  job = lock_job(last_job_id)
  work_job(job)
  last_job_id = job.id
end
Applying an equivalent patch to Que changes the picture. Oldest transaction time versus queue count after the patch:
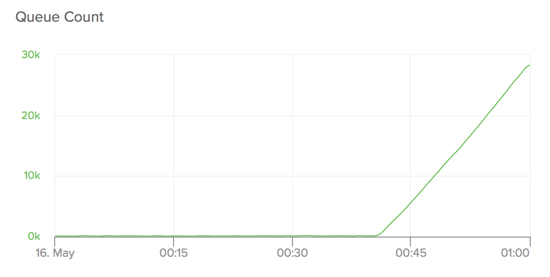
And before for comparison:
The patched version holds stable for roughly twice as long under degraded conditions, eventually degrading but only after a considerable delay3. Database size also matters: on a heroku-postgresql:standard-7, the patched version maintained near-zero queue for the entire run, while the unpatched version degraded about the same as it did on the smaller heroku-postgresql:standard-2.
Managing lock jitter
The revised algorithm introduces a subtle risk. If a worker dies or a transaction commits a job ID out of sequence, all workers may hold last_job_id values higher than an unworked job left behind — stranding that low-ID job indefinitely.
The Que patch counters this with time-based jitter. Periodically, a worker forgets its last_job_id and picks any available job, accepting a more expensive lock query (in the presence of long-lived transactions) in exchange for guaranteeing forward progress. The amended loop:
last_job_id = nil
start = now()

loop do
  # lock jitter
  if now() > start + 60.seconds
    last_job_id = nil
    start = now()
  end

  job = lock_job(last_job_id)
  work_job(job)
  last_job_id = job.id
end
Batch locks and Redis offloads
Locking multiple jobs per worker distributes the lock cost across a batch, but risks delaying jobs stuck behind a long-running one from the same batch. A different route is to abandon Postgres queues entirely: persist jobs to a pending_jobs table, then have a background process bulk-select from it and feed a Redis-backed queue such as Sidekiq. That preserves transactional consistency while making the system far more tolerant of long transactions, at the cost of an extra hop that may be slower than a healthy Postgres queue.
Operational takeaways
The tempting conclusion — that Postgres is unfit for job queues — is only partially true. The same degradation can hit any sufficiently hot table. A supervisor process that watches for long-lived transactions on leader and followers and calls pg_terminate_backend on offenders is worthwhile. Postgres's built-in statement_timeout setting helps but is not sufficient on its own, since it can be overridden.
The broader lesson is architectural: databases should not be shared across component or team boundaries. When they are, one team's long-running transaction can silently cripple another's hot path. Well-defined, safe-by-default APIs between components would have prevented this problem from appearing for far longer.
Long-lived transactions degrade hot Postgres tables — job queues most visibly. Lock queries can be tuned to reduce the damage using knowledge of the B-tree and visibility model, but cannot eliminate it. For robust operation, monitor transaction ages actively and keep databases within single-component boundaries.
What the Benchmarks Missed
Initial stress tests of Queue Classic (QC) and Que looked reasonable, but a finer-grained reproduction told a different story. Once multiple workers began polling the same queue, lock times exploded from single-digit milliseconds to over a second within minutes. The failures weren’t caused by transaction contention or trigger overhead, but by a far more subtle interaction between Postgres’ MVCC model and the way B-tree indexes are traversed.
Three factors combined to create the bottleneck. First, workers don’t checkpoint often, so deleted jobs remain as dead tuples in the index. Second, queues tend to be indexed in descending order on id, so the hottest part of the index is always the leftmost leaf page. Third, all workers descend the B-tree in identical fashion, each one pulling the same lock and paying the same visibility-check cost.
The visible symptoms — slow lock times and queue build-up — look like a capacity problem. They’re not. They’re the result of every worker repeatedly reacquiring the locks needed to scan the same dead-tuple-heavy region of the index.
Why Dead Tuples Accumulate in a Queue
Every DELETE in Postgres leaves a dead tuple behind until a checkpoint or VACUUM cleans it up. In a busy queue, that’s the steady state: workers are deleting jobs as fast as they can, and each deletion adds a dead tuple to the B-tree leaf page at the “high” end of the index. With a single worker processing jobs sequentially, the queue stays ahead of the checkpointer and the leftover tuples are cleared before they matter.
With multiple concurrent workers, however, completion rates exceed the checkpoint interval. The dead tuples pile up in the same leaf page that everyone now needs to traverse. That page bloats and eventually splits when it runs out of tuple slots, pushing the frontier of activity further down the index. The result is that the region a worker must scan through is far larger than the actual queue depth, because half of it or more is invisible to the transaction.
A B-tree Walk With Visibility Checks
An index-only scan can sometimes avoid heap fetches altogether via the visibility map, but only on pages whose tuples are visible to all transactions; the moment the page contains even one masked or dead tuple, the visibility map forces the scan to round-trip to the heap. And critically, an index structure itself carries no visibility information, so the scanner can’t know whether a given id is doomed until after it traverses the tree.
The traversal works like this: a worker locks the first leaf page on the left edge (where the newest jobs live due to the descending index), then scans forward through index entries until it finds one whose heap tuple is actually visible. Under normal locking this is fine. Under heavy load, the checker and the checkpointer race, and the entry the worker locks may correspond to a tuple that another process has already deleted. Every entry becomes a gamble: the lock is taken, the tuple is checked, and if invisible, the page is unlocked and the next one locked, until a visible row is found. One queue operation was observed to require 30 such cycles, each with a full lock acquisition and heap visibility check.
This repeated locking grows linearly worse as the shared fill factor fills and pages split. Each new page split doubles the number of pages workers may need to scan before finding a live job, so the lock time graph doesn’t rise gradually — it curves sharply upward in a hockey stick as page fragmentation increases.
Narrowing the Lock Target
The few indexed columns make this scan strategy worse. The more selective the predicate, the fewer pages the planner expects to visit, and the more precise each lock is. Querying WHERE lock_id = ? ORDER BY id DESC LIMIT 1 on a lock_id/id composite index does not just narrow the result; it confines each worker’s B-tree descent to a particular section of the tree, so that multiple workers touching distinct lock_id values are operating on disjoint pages and don’t fight for the same lock.
But this holds only while workers share a lock_id. The moment two or more workers target the same lock identifier, there is again only one left edge of the index section and they all contend for it — which is precisely what causes the most aggressive lock jitter seen in the measurement runs.
Locking Multiple Jobs at Once
Single-row locking is the root cost: a worker must hold an UPDATE lock on one job to claim it, and the cost per job does not drop as concurrency increases. One direct mitigation is to lock several jobs in one statement. Claiming a set of jobs via UPDATE ... WHERE ctid = ANY (...) RETURNING * distributes the lock overhead across more work per transaction. Que’s early adopter strategy at the time of the write-up was to adopt a hybrid scheme: poll for one, then use larger claim batching as queue depth grew.
Batching Through an External Broker
Redis offers a pragmatic way to absorb that poll overhead outside of Postgres. Instead of workers hitting Postgres on every empty queue poll, a producer daemon periodically accumulates new job IDs into a Redis list. Workers RPOP from that list; only when it’s empty do they fall back to Postgres to refresh it with the next range of job IDs, possibly guarded by filters for visibility or priority. Existing systems with a Redis broker already in the stack can switch to this pattern with modest plumbing.
The Redis batch helps only when it is allowed to define the workload shape. A steady trickle of new jobs at short intervals — one per second, say → will exhaust the Redis list quickly and land the workers back on Postgres polling anyway. The meaningful win is for the pathological case of high-volume deletes with low concurrency, not a universal one.
The deeper lesson isn’t about queue libraries at all. SQL-level debugging in Postgres showed that lock times often appeared to be in the tens of milliseconds even while real latencies reached seconds, because pg_stat_activity samples can miss the worker’s true bottleneck: the repeated loop of index descending and heap checking masking behind hot page splits.