Monitoring managed PostgreSQL: pgwatch2 against Google Cloud SQL
The recurring question about pgwatch2 is whether it can monitor PostgreSQL instances running on managed cloud services such as Google Cloud SQL. The short answer is yes, but getting there requires understanding what a managed database actually gives you—and what it deliberately holds back.
What you lose with a managed database
A managed PostgreSQL instance is, in most respects, the same engine you would get from a local install. Standard DDL and DML behave identically. What changes is the layer around the database: cloud providers strip away security-sensitive and advanced configuration features, and the differences fall into a few broad categories.
No OS access
There is no way to execute arbitrary commands at the operating system level. Features like COPY PROGRAM or archive_command are disabled, as are filesystem inspection functions such as pg_ls_dir(). The reasoning is straightforward: these expose implementation details that could help an attacker break out of the sandbox.
Restricted server configuration
You can only modify a subset of PostgreSQL parameters, with constraints on value ranges that align with your booked hardware. Some limitations have a more strategic edge: Google Cloud, like other providers, disables PostgreSQL's built-in logical replication, which is otherwise the clean path for near-zero-downtime migration to another provider or to a self-managed instance.
Controlled access security
The pg_hba.conf infrastructure is managed for you: SSL is typically mandatory, and access can be restricted to your cloud account's network. The pseudo-superuser accounts you get are also limited—by default they cannot see other users' running queries.
A short extension whitelist
Only a pre-approved set of extensions can be activated, mostly from the official contrib package. Providers have to review code for stability and security, so this is understandable. It is also the most limiting aspect of the managed experience, given that PostgreSQL's extensibility is a major reason for its adoption.
None of this makes managed databases a bad choice. They hide real complexity: high availability and failover, backups, server configuration, and basic metrics. For many teams, that trade-off is worth it.
Why bring your own monitoring tool
Google Cloud SQL ships with a built-in metrics and diagnostics feature called "Query insights," which is reasonably polished. There are still good reasons to run an external collector.
- Familiarity: If your team already monitors self-managed PostgreSQL with pgwatch2 or similar, moving to a different dashboard for one cloud database means learning a new vocabulary and a new interface for the same underlying data.
- Unification: Organizations with multiple cloud providers plus self-managed instances need a single view. Cloud providers have not agreed on a common set of metric names or terminology, and switching between provider consoles is a constant context switch.
- Controlled metrics access: You may need to expose metrics to a subset of your team—freelancers or a segregated development group—without granting access to the provider's full observability console.
- Advanced configuration: Provider consoles are deliberately simple, which suits casual users but not database professionals who want finer control over metric collection intervals, specific visualizations, or access to all available PostgreSQL statistics.
- Alerting: Setting up flexible, easy-to-configure alerts is still not a strong point for most cloud providers. A tool like Grafana gives you that flexibility out of the box.
The major trade-off of external monitoring on managed services is the lack of OS-level metrics. You cannot read host-level counters directly from the database. That data is usually accessible through the provider's API, but you need custom code to pull it. Tools like Grafana can fetch it on the fly with mixed data sources, though you may deal with added latency and retention limits on historical data.
Standing up a Google Cloud SQL PostgreSQL instance
The Google Cloud console is mostly self-explanatory, but there are a few spots worth attention. Note that this assumes you already have an account and billing set up.
- Navigate to the SQL section and choose PostgreSQL as the engine, since Google also offers MySQL and SQL Server.
- Give the instance an identifiable name.
- Select the PostgreSQL version, region, high-availability class, and hardware.
- In the "Connections" section, specify the network ranges that may access the instance. By default, even machines inside the same account or VPC have no access. You can also use Google-specific tooling like the Cloud Proxy.
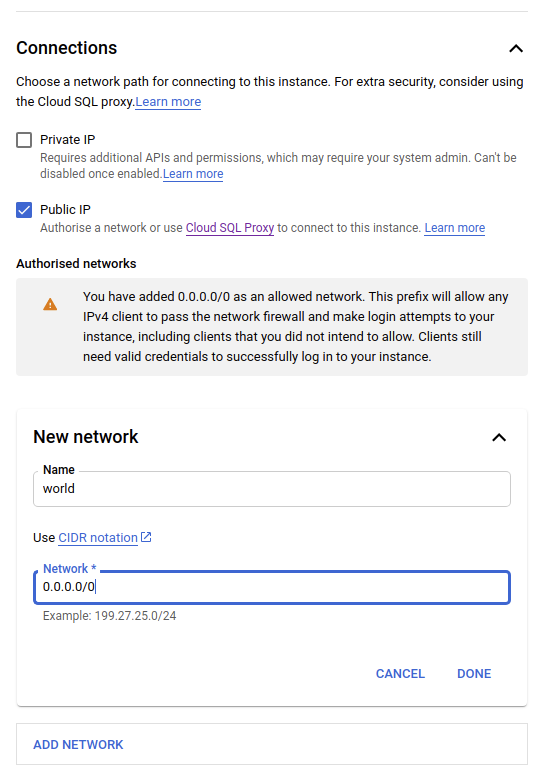
- If you don't plan to use external monitoring, or want a fallback, enable the "Query insights" feature under advanced options ("Customize your instance").
- Click "Create instance." Once it is up, create a normal non-admin user for DDL and DML operations; from there it is business as usual.
Creating a dedicated monitoring role
Monitoring over a remote connection with the default admin or superuser account is not a good practice. PostgreSQL has addressed this with a dedicated system grant: pg_monitor, available since version 10. It grants just enough privilege to read the relevant statistics and activity views without allowing changes.
|
1 2 3 4 |
CREATE USER pgwatch2 WITH PASSWORD 'secret'; GRANT pg_monitor TO pgwatch2; -- pg_monitor is a special system role for metrics access |
Pointing pgwatch2 at Google Cloud SQL
Assuming pgwatch2 is already installed with its metrics agent and storage database (PostgreSQL with TimescaleDB is the recommended setup), configuration is a matter of a YAML file. pgwatch2 ships with preset configurations for various managed services, and the one for Google Cloud is named gce. For a file-based installation, the entry looks like this:
|
1 2 3 4 5 6 7 8 9 10 11 12 |
- unique_name: gce_mon dbtype: postgres # use postgres-continuous-discovery here if want to monitor all Dbs, # optionally according to a regex pattern host: 1.2.3.4 # paste your real IP/hostname here port: 5432 dbname: postgres # monitoring a single DB only here user: pgwatch2 password: # actual password is in the .pgpass file stmt_timeout: 5 # seconds preset_metrics: gce is_enabled: true sslmode: require |
Starting the metrics collector against a fresh instance will likely report errors at first:
|
1 2 3 4 5 6 7 8 |
$ pgwatch-daemon -c /etc/pgwatch2/config/instances.yaml --datastore=postgres –pg-metric-store- conn-str=”postgresql://pgwatch2@localhost:5432/pgwatch2_metrics” 2021/05/06 14:10:05 WARN main: --metrics-folder path not specified, using /etc/pgwatch2/metrics 2021/05/06 14:10:06 ERRO MetricGathererLoop: Failed to fetch metric data for [gce_mon:stat_statements_calls]: pq: relation 'pg_stat_statements' does not exist 2021/05/06 14:10:06 ERRO MetricGathererLoop: Failed to fetch metric data for [gce_mon:stat_statements]: pq: function get_stat_statements() does not exist |
This is expected behavior for a pristine, out-of-the-box PostgreSQL instance. PostgreSQL is not fully pre-configured for exhaustive monitoring, so a small amount of initial setup is needed for the preset to run cleanly. If you want to see exactly what pgwatch2 is attempting, raise the --verbosity setting to info. The debug level exists as well, but it produces a large amount of output intended primarily for development and bug tracking.
Preparing Cloud SQL for useful metrics
Two configuration steps matter before you can get the full monitoring picture from pgwatch2. The first is essential for any database where you may need to troubleshoot performance or see what queries users are actually running. The second is optional but recommended on modern hardware—skip it and things still work, just some Grafana dashboards will show less data.
Enable pg_stat_statements
The pg_stat_statements extension ships with PostgreSQL and is the single most valuable tool for performance diagnostics. On most managed services it is already loaded via shared_preload_libraries; if not, you can typically enable it. Run the following for every database you plan to monitor:
|
1 |
CREATE EXTENSION pg_stat_statements; |
Configure tracking for I/O and functions
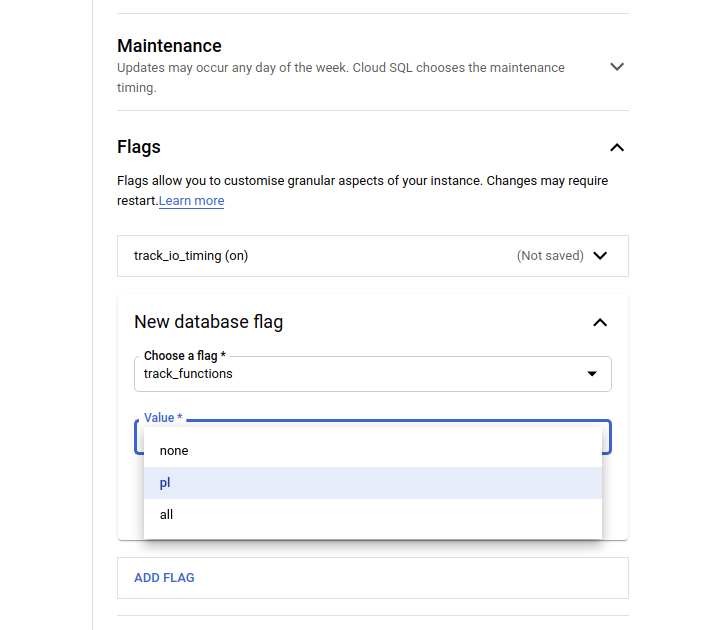
Set track_io_timing to enabled and track_functions to at least pl. Only set track_functions to all if you intend to profile C functions from extensions, which is rarely necessary. On Google Cloud SQL these settings are exposed as "flags":
Connecting Grafana and pgwatch2 users
Once the metrics daemon has been collecting data for a while, you can open Grafana and start exploring. The ready-made dashboards are a major reason pgwatch2 is popular—they give you immediate insight without much setup, and customizing the visuals takes only a few clicks. This level of flexibility is something the cloud provider's own monitoring tools don't offer.
For a fresh setup, you need to import the pgwatch2 dashboards into Grafana. You can do this one at a time or use the "import all" script described in the documentation.
Most dashboards work the same as with a local PostgreSQL instance. The "Systems Stats" dashboard, however, will remain empty because pgwatch2 cannot install PL/Python helpers on the managed server to gather CPU load and similar host-level data.
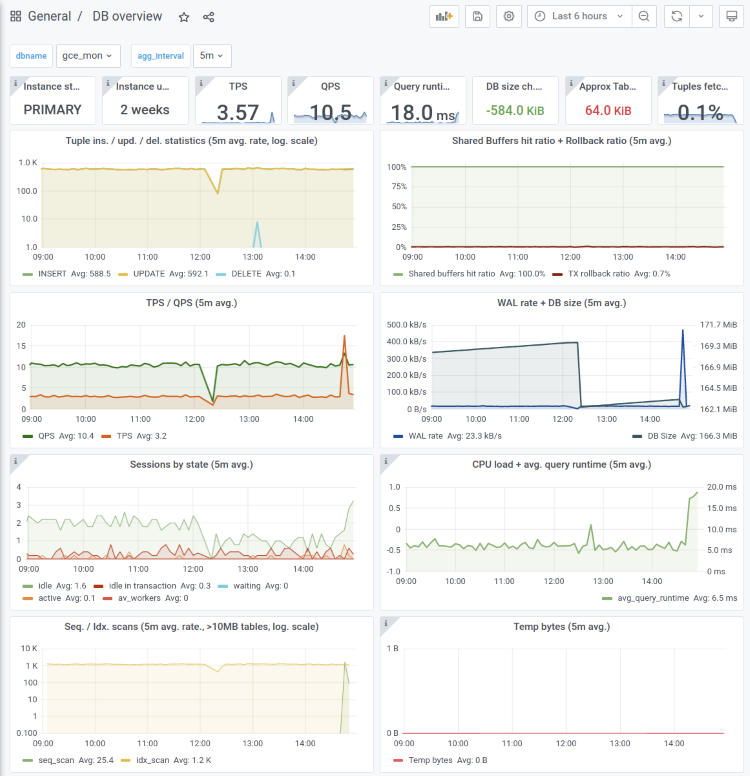
Instead of the standard "DB overview" dashboard, consider the "DB overview unprivileged" variant. It is designed for exactly this scenario, where the monitoring agent lacks full privileges. It only shows metrics available to users who have just the CONNECT privilege:
Bottom line
Running pgwatch2 against Google Cloud SQL requires only minor adjustments and works just as easily with other PostgreSQL-compatible managed services. The payoff compared to the provider's own instrumentation is substantial: roughly 30 dashboards covering typical problem areas, plus the ability to define custom metrics as SQL queries. That means you can track business-level counters—say, sales numbers—right alongside critical database health metrics.
For more specifics on running pgwatch2 against popular managed cloud services, the documentation has a dedicated section with additional tips.