
Why tail utilization decides fleet efficiency
Meta’s ads delivery relies on inference platforms that serve sophisticated ML models across a large footprint of CPUs, GPUs, storage, networking, and databases. The utilization level of the top 5% of servers—tail utilization—determines how much headroom must be reserved to keep service level agreements intact. When those constrained servers become overloaded as request volume rises, they fail, mostly with timeout errors, and the extra capacity needed to absorb that stress is added uniformly across the cluster. That means the fleet is often underutilized on average yet still requires more capacity than the actual demand would suggest, because the most loaded servers dictate the buffer.
This nonlinear relationship between traffic growth and utilization on constrained hosts makes the problem worse: tail utilization climbs faster than lower-percentile utilization. Tightening the utilization distribution across the fleet lets the system move work away from the hottest servers and absorb more demand without adding hardware. At Meta, that work delivered measurable results: the compute footprint now handles 35% more work with the same resources, timeout error rates fell by two-thirds, and p99 latency dropped by half.
How ads inference requests flow
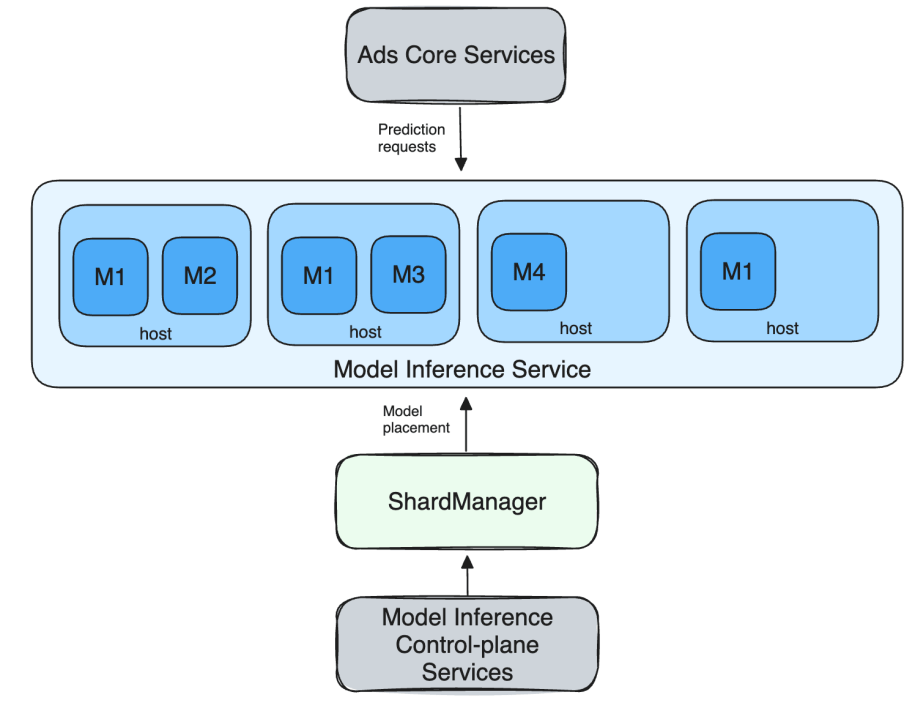
A client request for an ad placement triggers multiple model inferences, depending on the page type, ad attributes, and experiment setup. These requests go from the ads core services to a model inference service that is organized as a sharded deployment. Each model is a shard, and multiple models share a single host within a job that spans many hosts. Service discovery, load balancing, and reliability come from ServiceRouter, while Shard Manager handles the sharding, including load balancing and scaling shards across heterogeneous hardware.
Two kinds of load balancing
Load balancing in this environment splits into two categories. Routing load balancing spreads requests across replicas of a single model using ServiceRouter. Placement load balancing moves replicas of a model between hosts to balance the load on each machine. Three production realities make this complex:
- Replica estimation: When a new model version is introduced, the required number of replicas is estimated from the historical usage data of that model.
- Snapshot transition: Ads models are refreshed continuously; each refresh gets a new snapshot ID and traffic is migrated from the old model to the new one in a controlled transition.
- Multi-service deployment: Models run across several service tiers to exploit hardware differences and elastic capacity.
Optimizing routing: the power of two choices
ServiceRouter provides detailed instrumentation that exposed a key problem: load staleness was causing suboptimal routing decisions. The fix used the power of two choices in a randomized load balancing mechanism, which requires current load data from servers. That telemetry can be gathered either by polling, where the server load is queried before dispatch, or by piggybacking on the response via a load header. Polling gives fresh load information but adds a hop; the load-header approach reads stale data, which for large services with many clients degenerates into effectively random load balancing. Because an inference request is computationally expensive, the extra polling hop was negligible, and the fresher data noticeably improved tail utilization. Heavily loaded hosts were actively avoided, which worked particularly well for inference requests that take more than tens of milliseconds.
Other ServiceRouter tuning options—varying the number of server selection choices, backup request settings, and hardware-specific routing weights—produced only marginal gains. CPU utilization as a load counter was especially misleading: it aggregates over a time window rather than reflecting instant load, and it fails to account for tasks that are active but waiting on I/O.
Placement balancing and the spiky tail
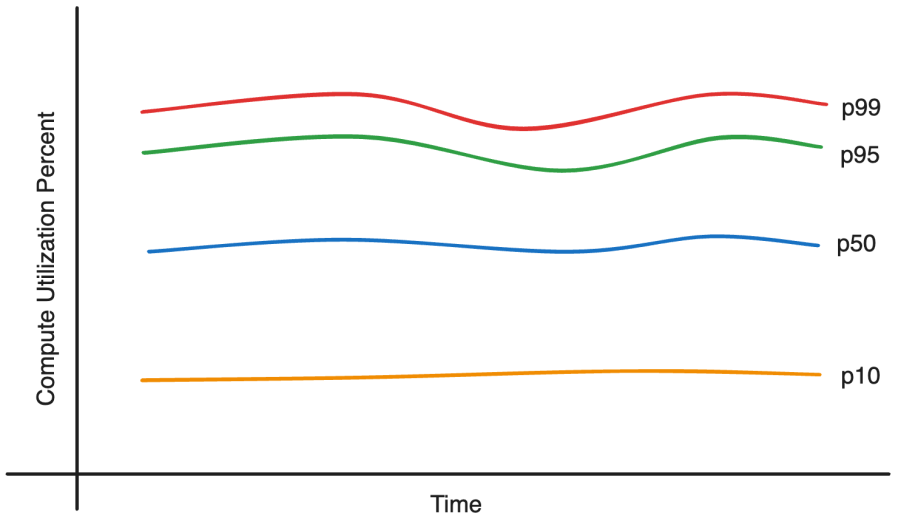
Placement load balancing delivered the larger improvement. Model resource demands and machine resource supplies vary widely, which creates significant variance in server utilization. Tuning Shard Manager’s configuration—load bands, thresholds, and balancing frequency—made the utilization distribution tighter and provided large gains. That tuning also exposed a deeper problem: a spiky tail utilization pattern that had been hidden behind the high average tail. Once identified, that spiky behavior was addressed directly.
System-level changes in model productionisation
The complete solution had two parts: tuning the load balancing mechanisms described above, and making system-level changes in how models are produced and deployed. The second part required considerably more trial, testing, and execution effort. The combined effect of both was a tighter utilization distribution, which allowed the service to move work from constrained servers to underutilized ones and to take on more demand without adding capacity.
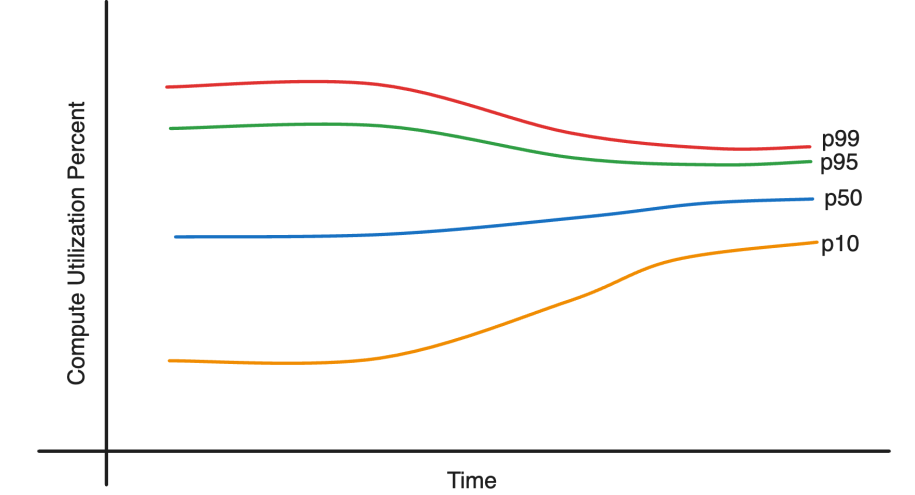
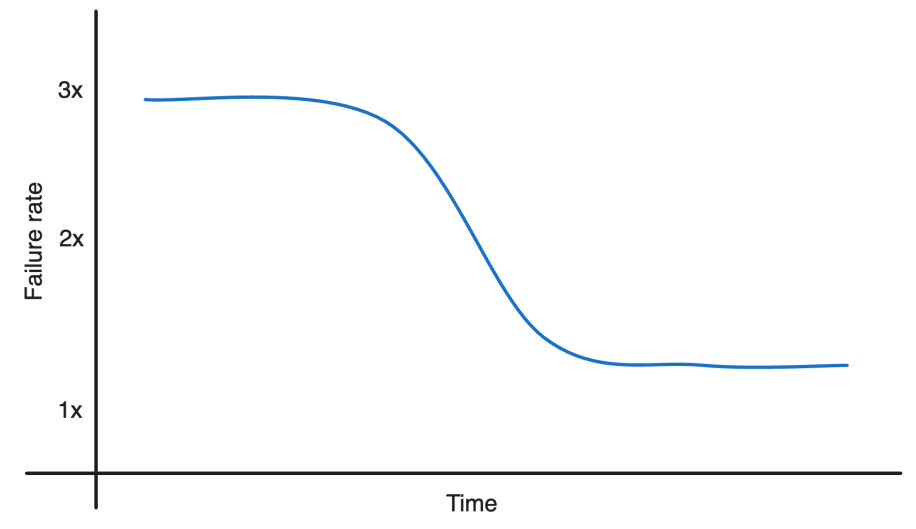
Reliability followed the same trend. With the load distribution under control, timeout errors fell by two-thirds and p99 latency was cut in half.
Where the variance was coming from
Rather than a single root cause, the utilization imbalance emerged from several interacting issues. CPU spikes appeared when new replicas were placed on hosts already serving other models — unlikely if Shard Manager had placed them correctly. Tracing the spikes with dynolog perf instrumentations showed rising stall cycles and memory latency. Memory latency grows exponentially once a host is 65–70% utilized, so what looked like CPU pressure was actually the CPU waiting on memory. The fix was to treat memory bandwidth itself as a placement resource in Shard Manager.
Load counter mismatch
ReplicaEstimator, the control-plane component that sizes replica counts for a model, assumes each replica receives roughly equal traffic. Shard Manager’s host balancing and its fallback to sibling-replica load information rely on the same expectation. ServiceRouter, however, uses a consolidated host-level load counter that includes both active and queued outstanding requests. That is a fine proxy when each host runs a single replica of the model, but multi-tenancy breaks it: two hosts serving the same model can report wildly different load counters because they are also serving different other models, and balancing decisions go wrong.
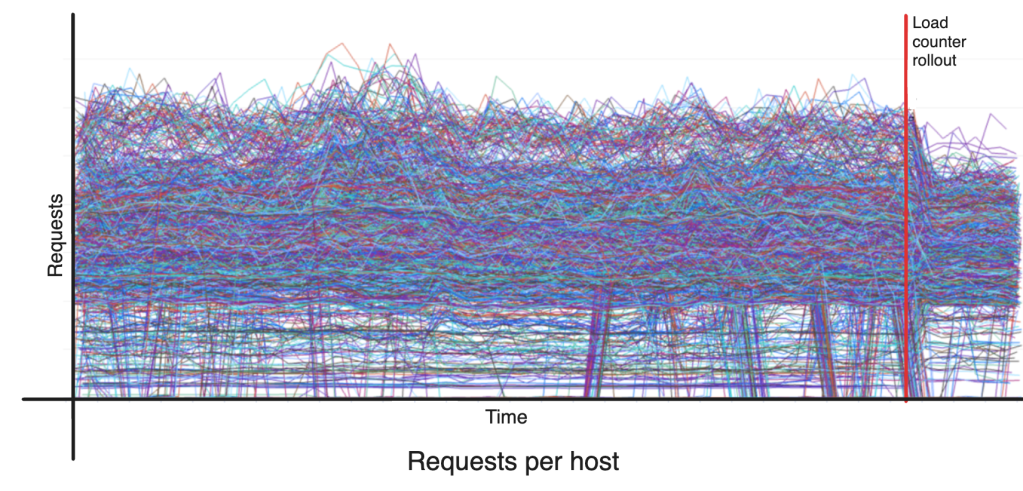
A straightforward correction is a per-model load counter. When each model exposes a load counter based on its own server-side work, ServiceRouter balances across replicas of that model, Shard Manager balances hosts more accurately, and replica estimation improves. The prediction client was updated to set the load counter per model client, and the server side now exposes the per-model metric. Replica load distribution tightened as expected.
Rolling this out had its own complications. Switching from a host-level to a per-model counter changes the load distribution immediately, causing spikes while Shard Manager catches up. A gradual client-side rollout smoothed the transition. For models with very low traffic, the per-model counter falls to 0, which makes routing effectively random; for these, the host-level load remains a useful proxy.
Among the counters tested, "outstanding examples CPU" proved the most useful. It estimates total CPU time spent on active requests, normalized by the number of cores to account for heterogeneous hardware, and matches the cost of outstanding work better than request counts.
Snapshot transitions
Most ads models periodically transition traffic from an old model snapshot to a new one. When a transition involves a model with a large replica footprint and happens during peak traffic, it destabilizes a balanced system for several Shard Manager load-balancing runs, since the new placements violate CPU soft thresholds. Load-counter issues compound the problem.
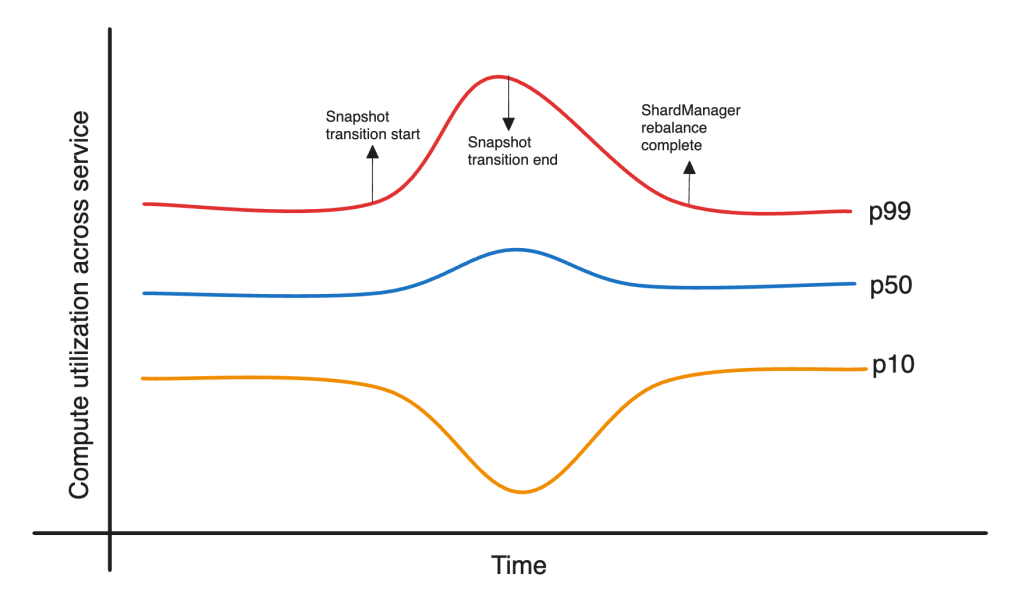
The team added a snapshot transition budget: transitions are only allowed when resource utilization is below a configured threshold. The trade-off is snapshot staleness against failure rate, and rapidly scaling down the old snapshots keeps that staleness window small while preserving low failure rates.
Balancing between services, not just within them
With intra-service balancing improved, the same approach was extended across the multiple sub-services that make up each regional inference service, which are split by hardware type and capacity pool (guaranteed and elastic). The load calculation was switched from host counts to compute capacity, which balanced load across tiers more evenly.
Some hardware types remain more loaded than others, and because clients maintain separate connections per tier, ServiceRouter’s within-tier balancing cannot help. Placing all tiers behind one parent tier was impractical, so a small utilization feedback controller was added to adjust traffic routing percentages between tiers until they converge. Figure 7 shows an example rollout.

Predictive replica estimation
Shard Manager’s default replica scaling is reactive: it scales up after load has already increased, so error rates rise during the provisioning window — made worse because higher-utilized replicas are more susceptible to spikes, given the non-linear relationship between QPS and utilization. Auto-scaling then responds to the larger CPU requirement and over-replicates. A simple predictor was designed that estimates future resource usage from current and past patterns up to two hours ahead. It produced meaningful failure-rate improvements during peak periods when applied per model.
Carrying the lessons forward
These findings are being carried into IPnext, Meta’s next-generation platform for managing the full model deployment lifecycle, from publishing to serving. Its modular design supports diverse model architectures — ranking and GenAI — through one platform across data center regions, and the tail-utilization optimizations described here are expected to bring the same benefits to that broader set of inference workloads.