
A record year for GitHub
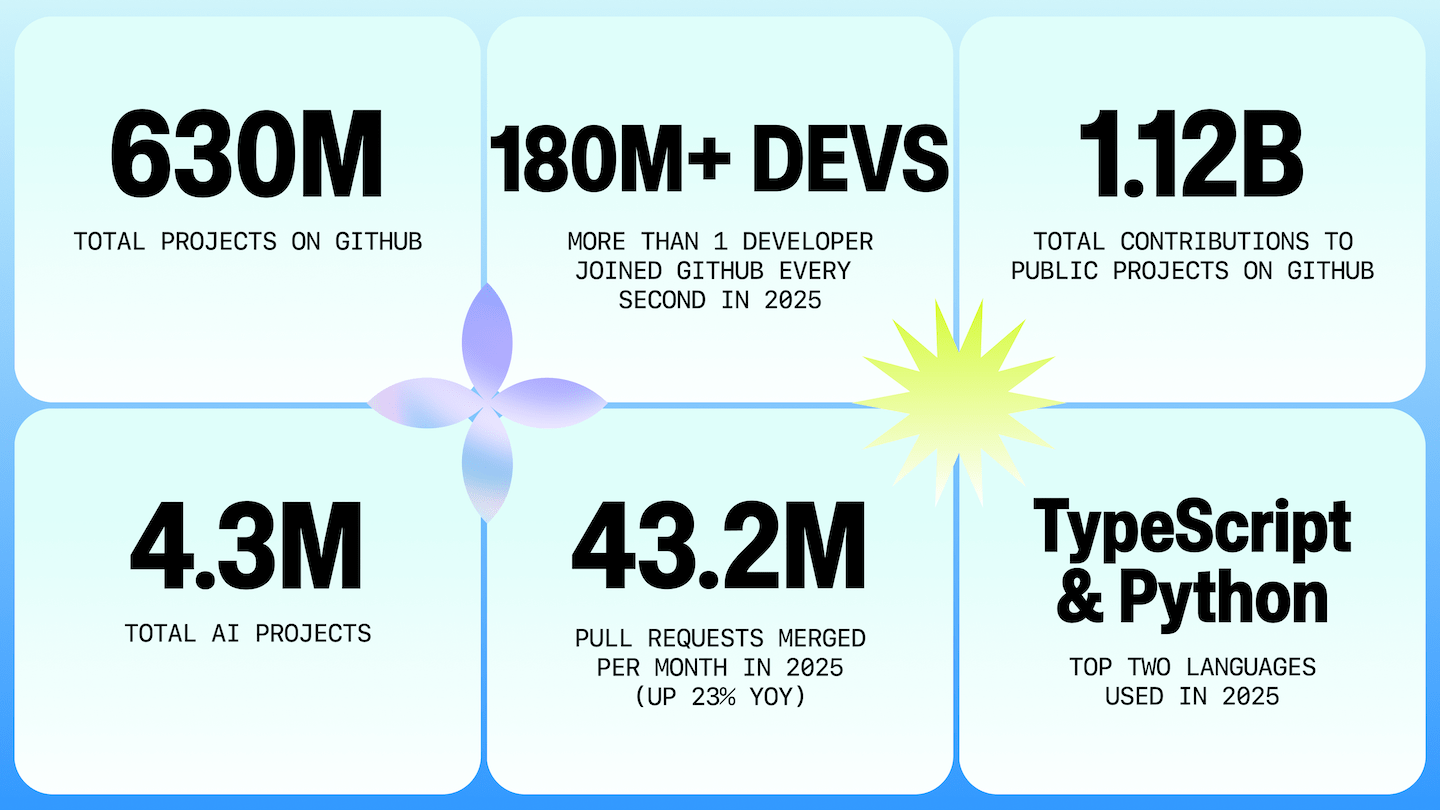
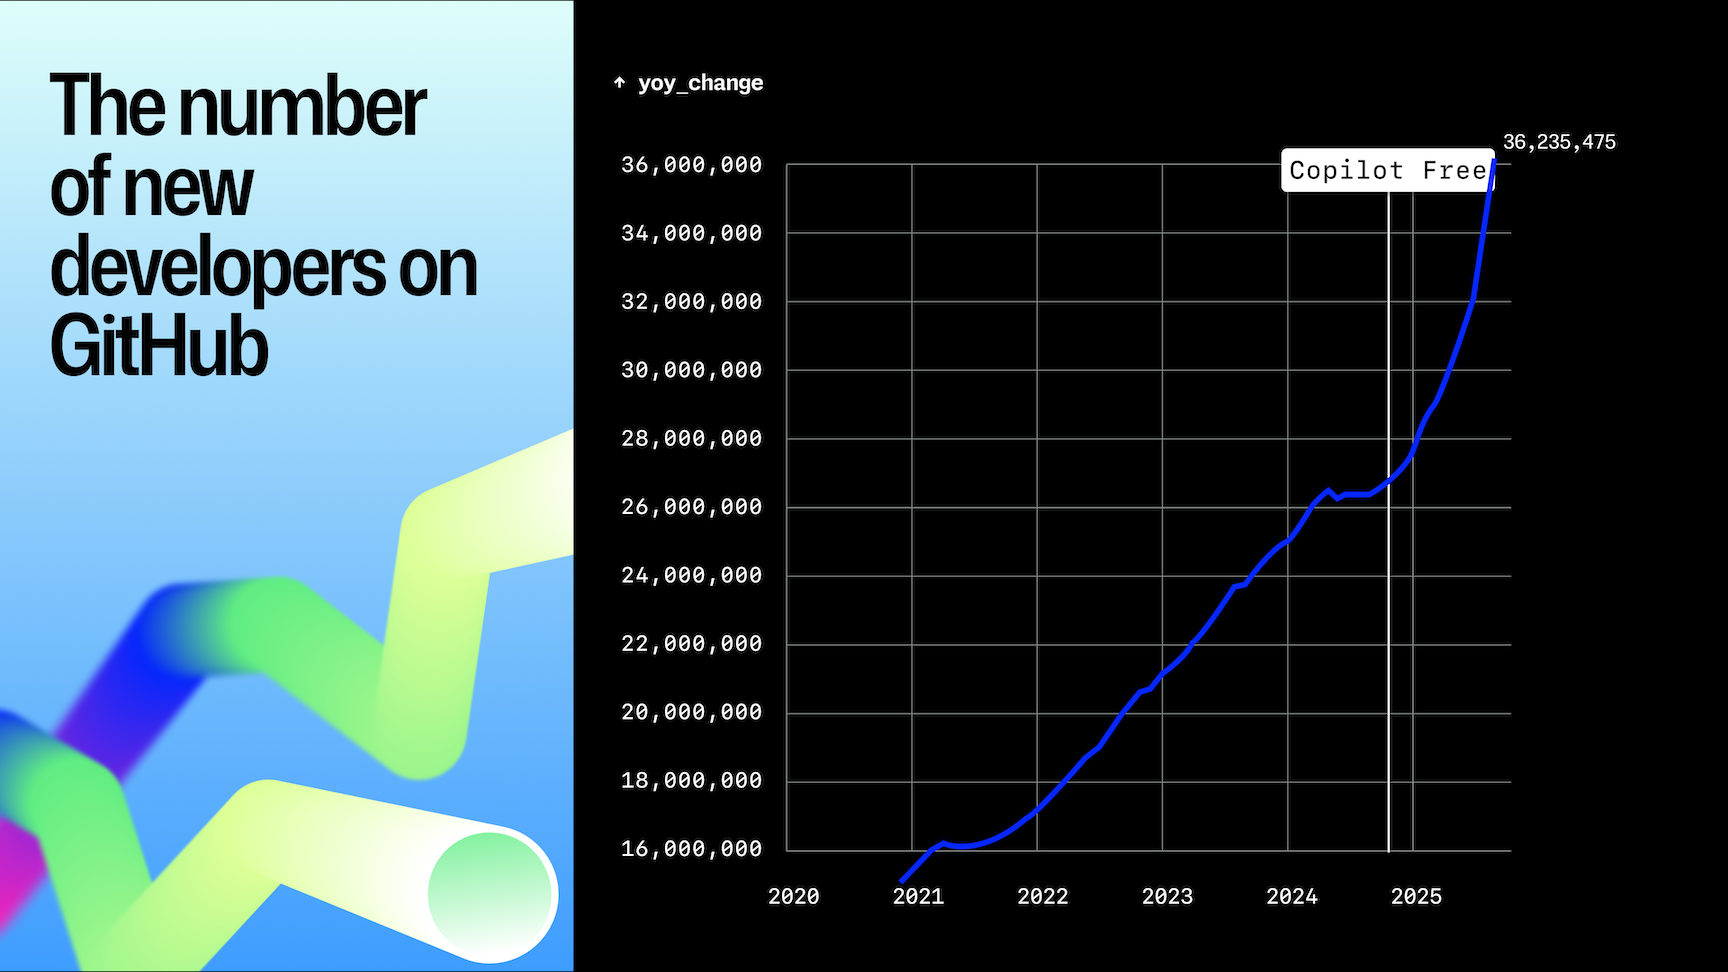
GitHub’s 2025 data shows growth on almost every axis. More than 36 million developers joined the platform over the past year—an average of more than one new account per second—bringing the total to over 180 million. That is the fastest absolute growth rate GitHub has recorded.
The December 2024 launch of GitHub Copilot Free coincided with a visible step-change in sign-ups, which exceeded prior projections. Activity across the platform reached new highs alongside that influx: developers created over 230 new repositories every minute, merged an average of 43.2 million pull requests per month (up 23% year-over-year), and pushed nearly 1 billion commits in 2025 (up 25.1%). August alone saw close to 100 million commits.
The surge also came with a structural shift in language usage. In August 2025, TypeScript overtook both Python and JavaScript to become the most-used language on GitHub—the most significant change at the top of the language rankings in over a decade.
Geographically, India added more than 5 million developers this year, over 14% of all new accounts, and is projected to account for one in three new developers by 2030.
Three shifts shaping the data
This year’s Octoverse report highlights three broad trends:
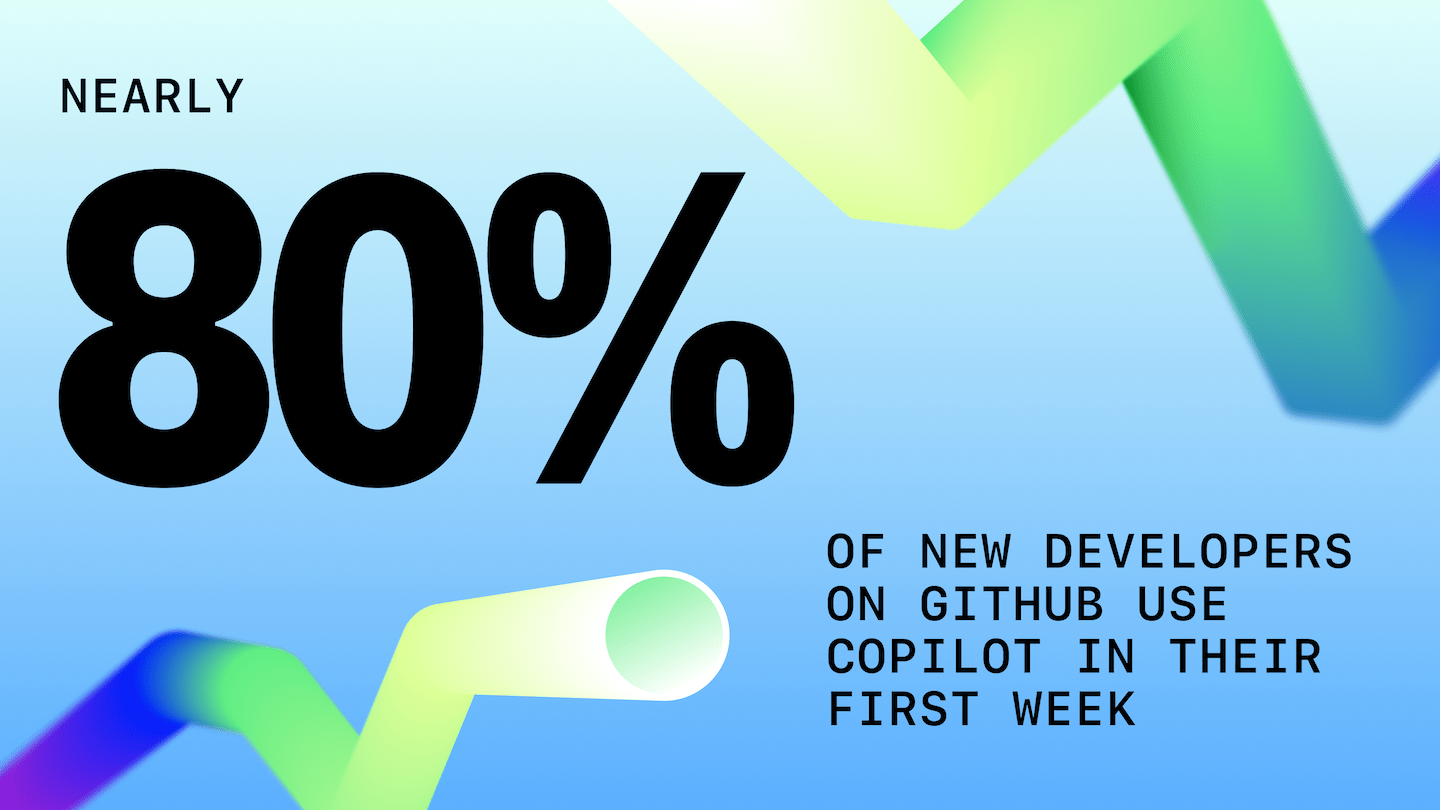
- Generative AI has become standard in development. More than 1.1 million public repositories now use an LLM SDK, with 693,867 of those projects created in the last 12 months alone (up 178% year-over-year). Developers merged a record 518.7 million pull requests, up 29% year-over-year. AI adoption is also immediate: 80% of new developers use Copilot within their first week.
- TypeScript is now the most-used language on GitHub. Its rise reflects a broader shift toward typed languages that make agent-assisted coding more reliable in production. Nearly every major frontend framework now scaffolds with TypeScript by default. Python remains dominant for AI and data science workloads, and the JavaScript/TypeScript ecosystem still accounts for more overall activity than Python alone.
- AI is influencing tooling choices, not just code. Developer choice in 2025 is no longer just about IDE, language, or framework. Correlations between AI tool adoption and language preference suggest AI is shaping which languages and tools developers pick.
Early data also shows the first signs of agentic tooling’s impact, though GitHub describes these as early signals with much more activity expected ahead.
Developer growth and activity records
It took GitHub nearly three years to grow from 50 million to 100 million developers, crossing that mark in 2023. The past year alone added 36 million, with more than 180 million developers now on the platform.
The new developer influx is geographically broad: roughly 25 developers joined per minute from APAC, 12 from Europe, 6.5 from Africa and the Middle East, and 6 from LATAM.
Copilot Free, released in December 2024, accelerated sign-up and repository-creation curves globally, overturning prior growth models.
Public and private repositories
In 2025, 81.5% of contributions happened in private repositories, while 63% of all repositories were public. Private repositories grew faster year-over-year (+33%) than public ones (+19%), reflecting growth in organizational development on GitHub.
| 2025‑YTD lens | Contributions | Share of total | What it signals |
|---|---|---|---|
| Private repositories | 4.97B | ≈ 81.5% | Enterprise and team‑level collaboration is happening on GitHub. |
| Public repositories | 1.12B | ≈ 18.5% | The volume of work is smaller, yet these projects supply the libraries, models, and workflows that power the broader ecosystem. |
Key platform numbers:
- 180M+ developers on GitHub
- 630M total repositories, with +121M new repositories in 2025—the biggest year yet
- +58M private repositories (up 33%)
- 63% of all repositories are open source or public
Productivity signals reach record levels
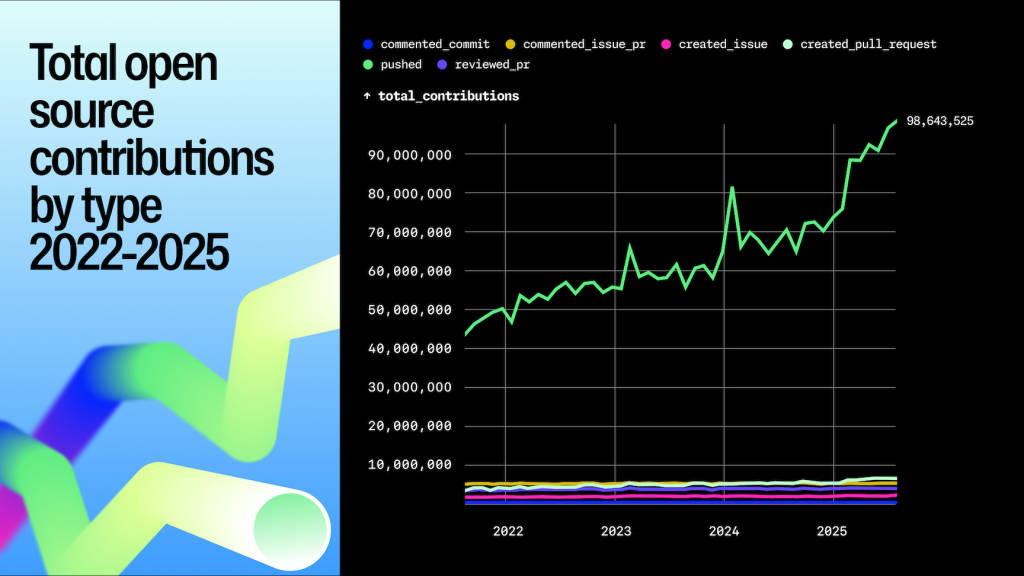
2025 was the most active 12-month period in GitHub history, with more than 1.12 billion contributions to public and open source projects. Activity accelerated in early 2025, coinciding with the preview of the Copilot coding agent in March and the general availability of Copilot code review in April.
| Activity | 2024 monthly average | 2025 monthly average |
|---|---|---|
| Issues closed | ≈ 3.4M | 4.25M |
| Pull requests merged | 35M | 43.2M |
| Code pushes | 65M | 82.19M |
In March, developers closed 1.4 million more issues than the prior month, culminating in 5.5 million issues closed in July. Code pushes drove much of the surge, with more than 986 million commits in 2025 (up 25% year-over-year) and monthly pushes topping 90 million by May.
Other activity metrics:
- Pull requests created: up 20.4% (47.5M vs 39.5M)
- Issues created: up 11.3% (17.5M vs 15.7M)
- Comments on issues/PRs: essentially flat (+0.35%)
- Comments on commits: down 27%
GitHub notes these are observational signals, not causal claims, and that more work is needed to understand AI's full impact on software development.
Notebooks, Dockerfiles, and agent adoption
Jupyter Notebooks and Dockerfiles reflect two ends of the modern development workflow. In 2025, 2.4 million repositories used Notebooks (up 75% year-over-year) and 1.9 million used Dockerfiles (up 120%). The Dockerfile growth is likely tied to the need to sandbox agents and LLMs; containerization offers a practical way to run and scale them securely.
| Repositories in 2024 | Repositories in 2025 | Delta | |
|---|---|---|---|
| Jupyter Notebook present | 1.4M | 2.42M | +75% |
| Dockerfile present | 875k | 1.9M | +120% |
On the AI front, interviews with developers who use Copilot code review found that 72.6% said it improved their effectiveness. Overall, the data shows an increase in rapid prototyping and experimentation, tied to both the growing developer base and the availability of agentic tools.
The global developer map in 2025
The last five years have reshaped GitHub's developer distribution faster than any prior period on record.
India added over 5.2 million developers in 2025—more than 14% of all new accounts—making it the single largest source of new developers this year. Brazil, Indonesia, and other emerging regions also contributed significant growth.
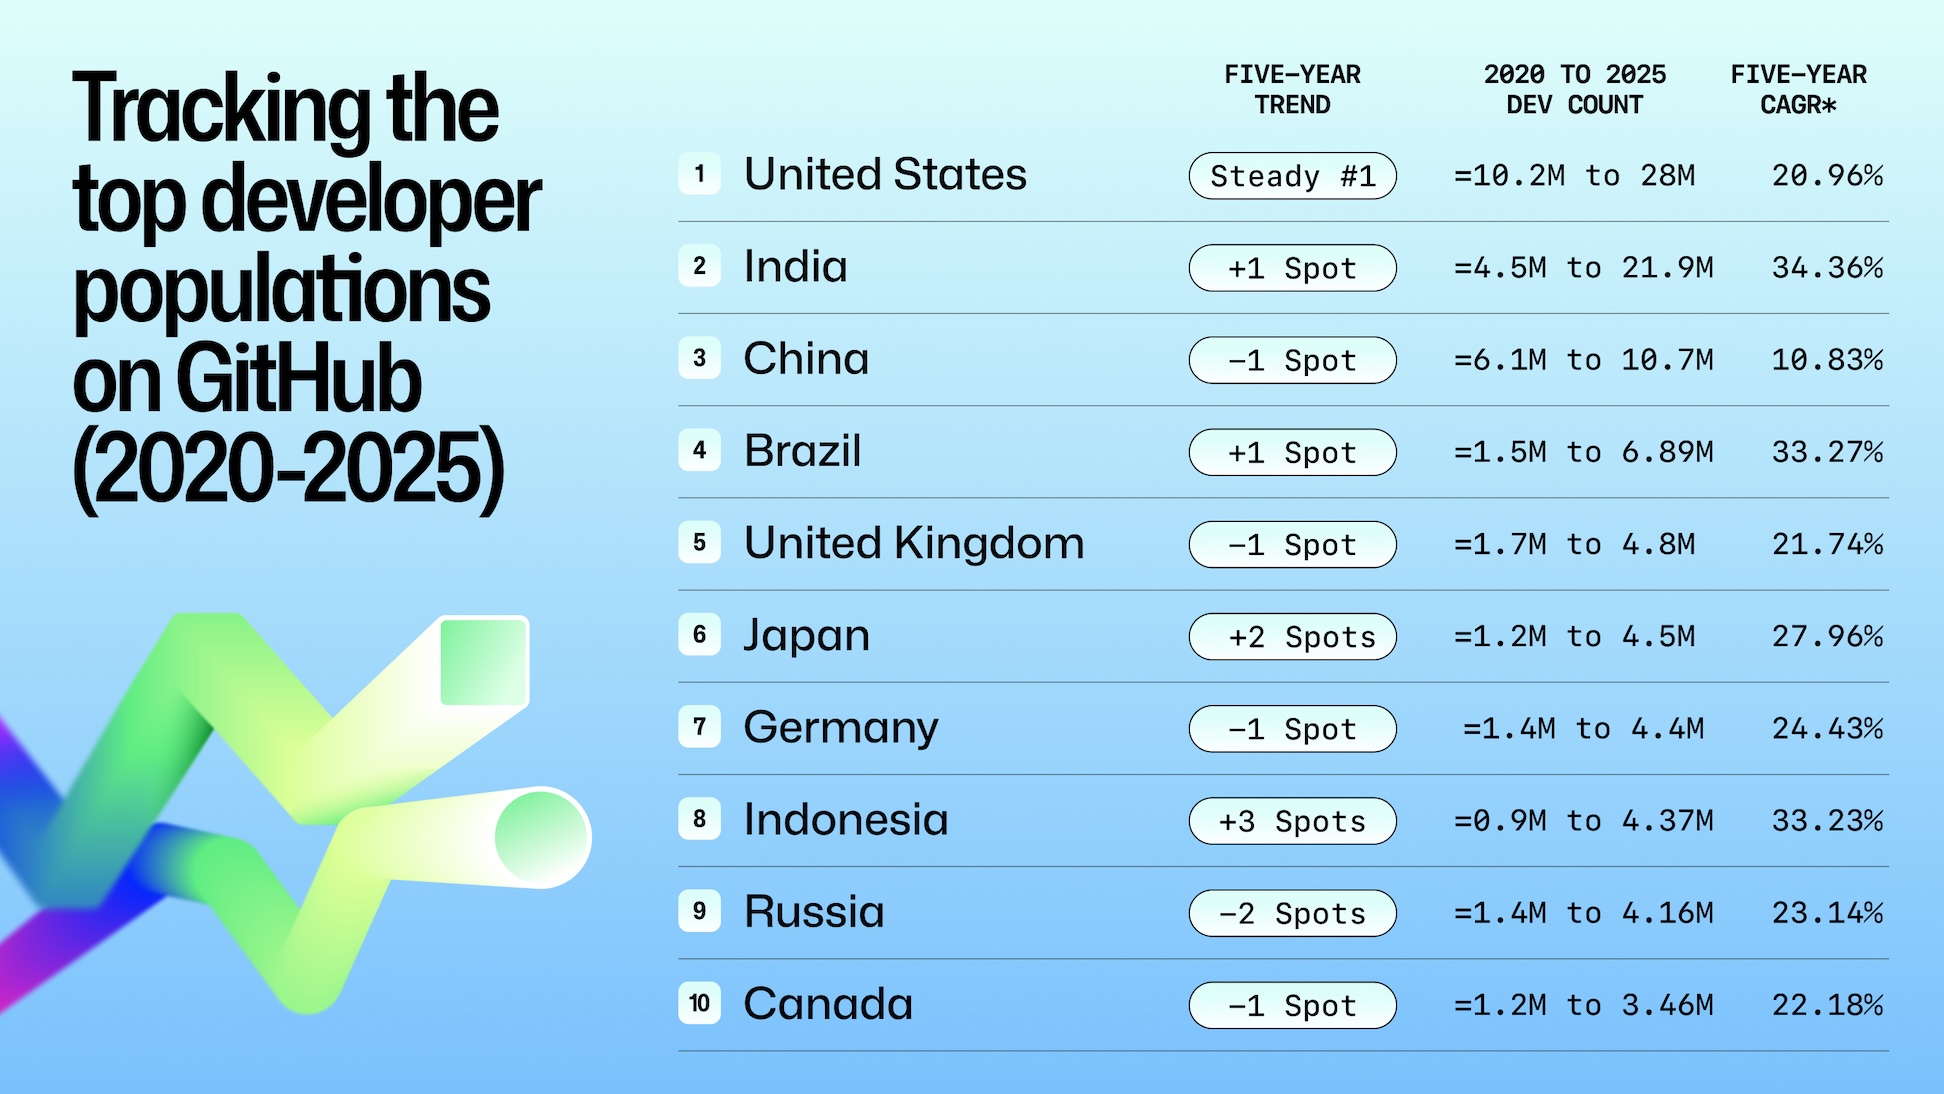
Over the past five years, India, Brazil, and Indonesia have more than quadrupled their developer numbers. Japan and Germany have more than tripled theirs, while the USA, UK, and Canada have more than doubled. Brazil has been boosted by investment in fintech and open banking, while Indonesia's growth tracks its rise as Southeast Asia's digital powerhouse.
| Region | Stand‑out markets | 2024 to 2025 net new devs | What’s fueling the boom |
|---|---|---|---|
| APAC | India, Japan, Indonesia, | +13M | Government skilling, AI‑assisted local‑language tooling. Japan, in particular, has embraced digital transformation in recent years, leading to a boom in developers. |
| LATAM | Brazil, Mexico, Colombia | +3.2M | Remote hiring by US/EU firms, fintech startup density |
| Europe | Germany, United Kingdom, France | +6.3M | Cloud infrastructure spend, AI investment, startup‑visa pipelines |
| Africa & the Middle East | Nigeria, Turkey, Egypt | +3.4M | Increased mobile adoption, community bootcamps, LLMs that work locally |
Projecting growth through 2030
Regression analysis of developer growth trends suggests India will reach 57.5 million developers by 2030, accounting for more than one in three projected sign-ups worldwide. The United States is expected to be the second-largest community with over 40 million developers, followed by Brazil (19.6M), Japan (11.7M), and the UK (11M).
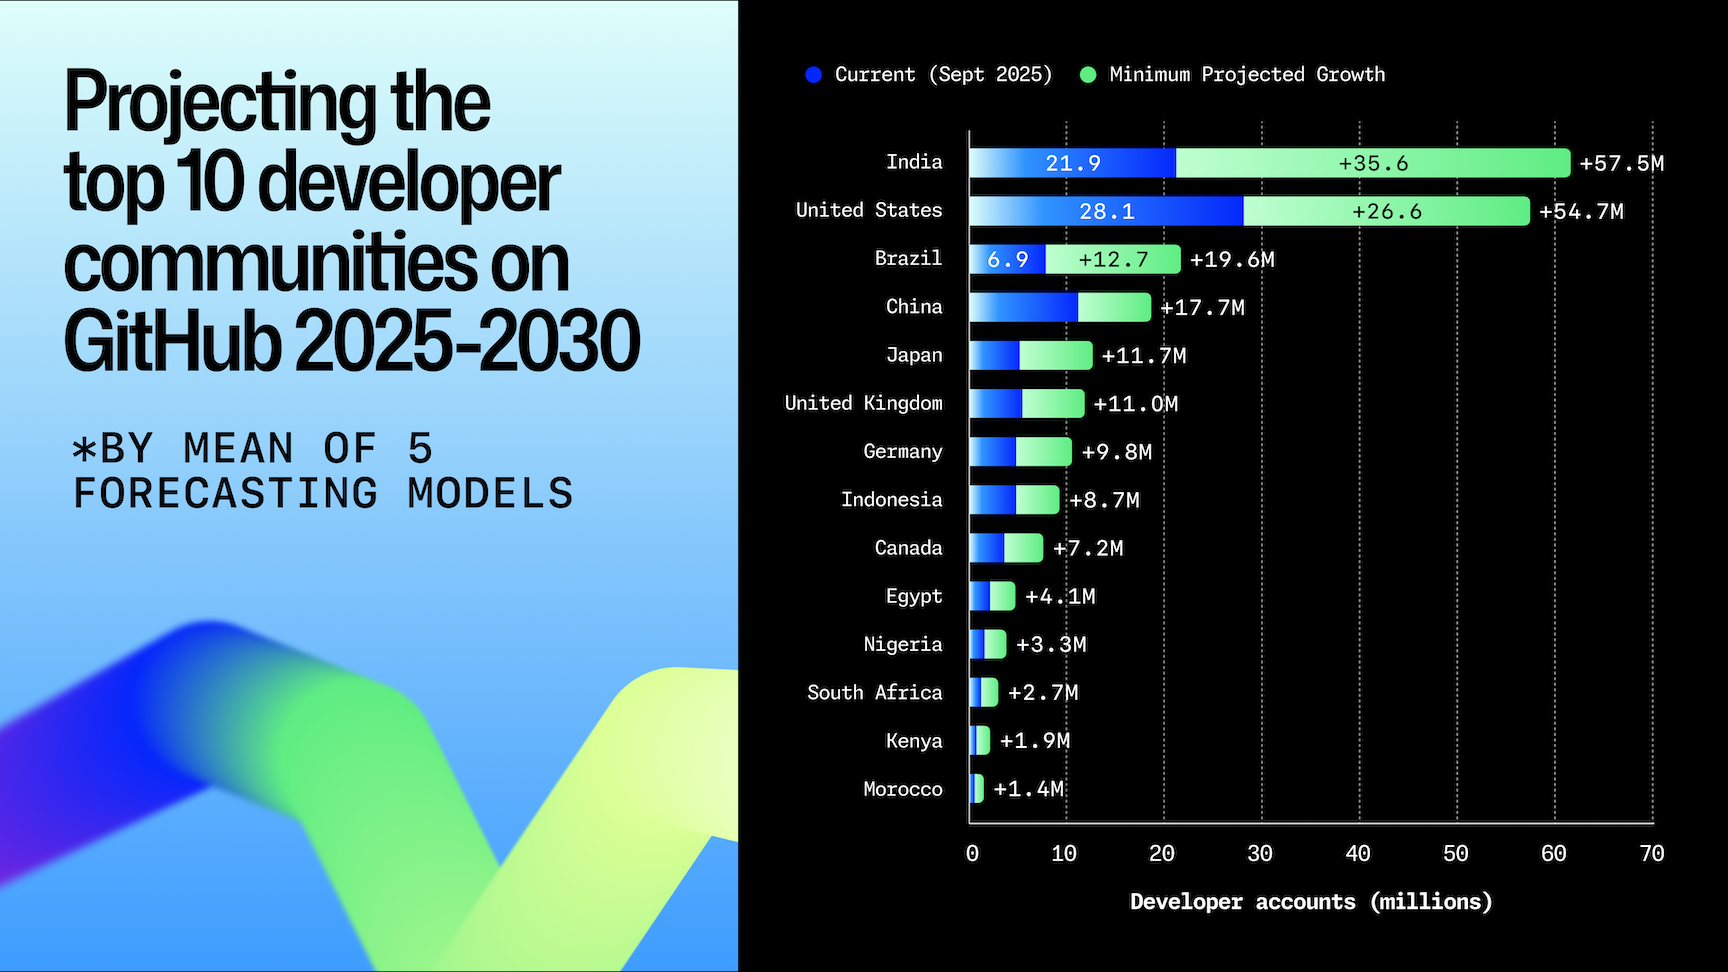
Emerging regions across Africa and the Middle East show notable momentum, with Egypt, Nigeria, Kenya, and Morocco all projected to add millions of developers in the coming years.
- One in three new developers who joined GitHub this year comes from a country that wasn't in the global top 10 in 2020.
- India added the most developers of any country this year, outpacing the US in growth.
- The AI boom is global: contributors to generative AI projects on GitHub are growing in number and working from around the world.
Record-breaking year for open source, but governance lags
Open source activity hit all-time highs in 2025. Public repositories hosted 1.12 billion contributions (+13% YoY) with 518.7 million merged pull requests — both records. The total public repository count grew to 395 million (+19% YoY). March 2025 saw the largest single influx of new open source contributors in GitHub's history: 255,000 first-timers.
AI infrastructure dominated growth. Six of the ten fastest-growing projects by contributor count were AI-focused, spanning runtimes, orchestration, and inference engines. The Model Context Protocol (MCP) reached 37k stars in eight months, though it didn't crack the top lists.
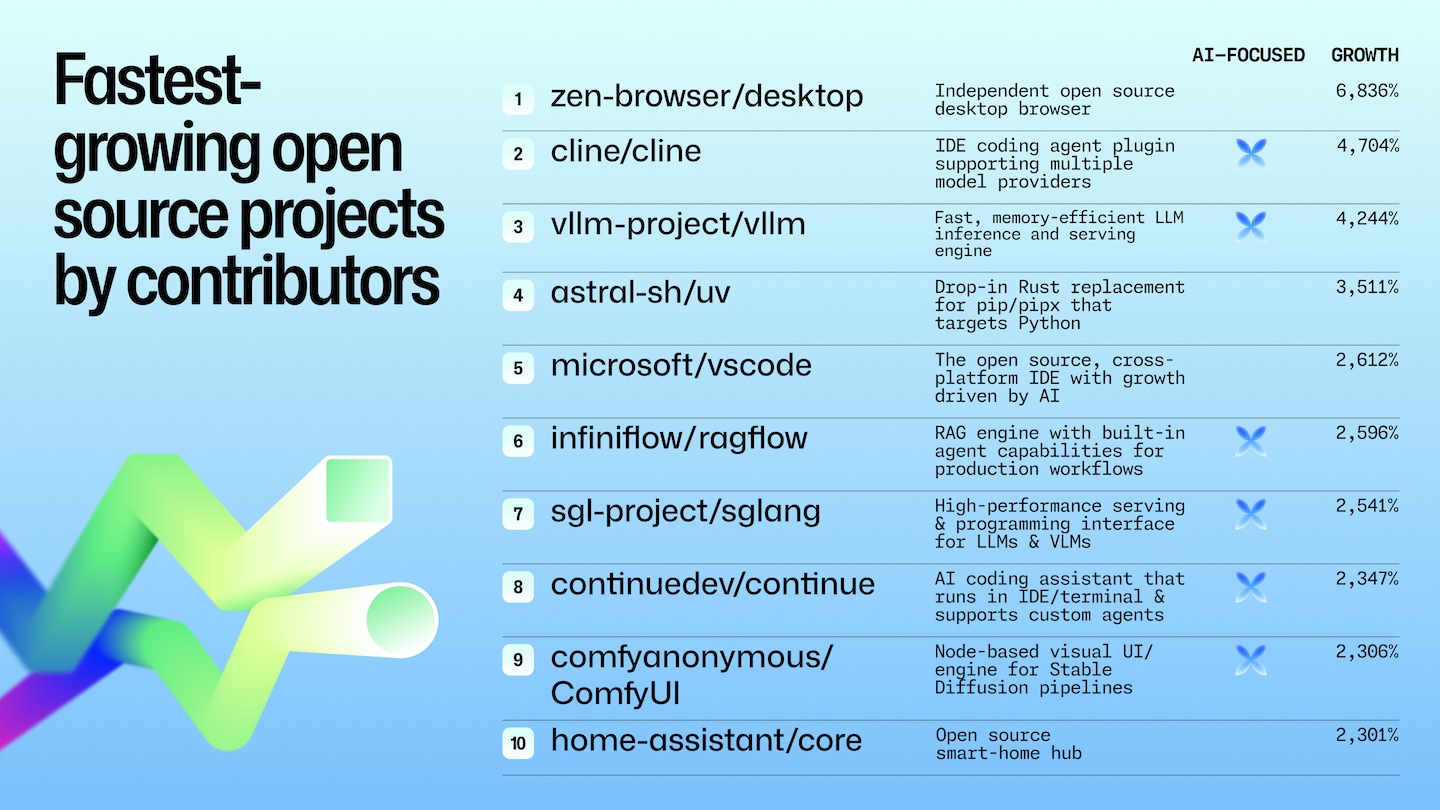
The most popular projects broke into two camps: AI infrastructure (vllm, ollama, huggingface/transformers) and established ecosystems (vscode, godot, home-assistant). Beyond those leaders, the top 20 fastest-growing projects revealed broader themes:
- Reproducibility is in demand. The rise of
astral-sh/uvandNixOS/nixpkgssignals interest in deterministic builds and dependency hygiene. - Performance-focused tools win. Ghostty, Tailwind CSS, and uv emphasize speed and minimal friction.
- Privacy and control matter. Zen Browser and Clash-Verge attract contributors interested in content control and network routing.
- Open source social media persists. Bluesky's momentum shows continued investment in open protocols and portable identity.
First-time contributors are also gravitating toward AI. Nearly 20% of the most popular projects among newcomers were AI-focused, including ollama/ollama, comfyanonymous/ComfyUI, and ultralytics/ultralytics. microsoft/vscode remains a top destination for first-timers, while firstcontributions/first-contributions continues to serve as a low-friction practice ground. Smart-home (home-assistant/core), mobile (flutter/flutter, expo/expo), game development (godotengine/godot), and 3D printing (bambulab/BambuStudio) projects also attract newcomers who want visible results from day one. Frontend and browser tooling — shadcn/ui and uBlockOrigin/uAssets — remain consistent draws.
Global contributor landscape shifts
India now has the largest public and open source contributor base in the world, reflecting its booming developer population. The U.S. still leads in overall contribution volume — despite fewer contributors, U.S.-based developers show higher per-developer activity. Brazil, Indonesia, and Germany fill out the next tier, with Indonesia entering the top five for contributor count as emerging regions expand their role in open source.
Repository health: documentation and governance stall
Governance hasn't kept pace with development velocity:
- ~63% of public repositories include a README, flat year-over-year.
- 5.5% have contributor guides.
- 2% include a Code of Conduct — just 1 in 50 repositories.
These files are more than formalities; they're the foundation for scalable, inclusive collaboration. A guide to getting your repository collaboration-ready outlines the essential documentation for fostering shared ownership.
Security shifts from "shift left" to secure by default
Remediation is finally catching up with development speed. Average fix times for critical severity vulnerabilities improved by 30%, and 26% fewer repositories received critical alerts in 2025. Automation is driving the improvement: Dependabot usage grew to 2.668M+ projects (+24.27% YoY, updated to reflect projects enabled via repository settings rather than just those with a dependabot.yml file). AI tools like Copilot Autofix are resolving common OWASP Top 10 issues across thousands of repositories monthly.
New risks are emerging alongside the gains. Broken Access Control overtook Injection as the most common CodeQL alert, flagged in 151k+ repositories (+172% YoY). Much of this stems from misconfigured permissions in CI/CD pipelines and AI-generated scaffolds that skip critical authentication checks. GitHub's engineers documented their SAML hardening, offering lessons for similar implementations.
Automation works — until merge queues stall
Developer automation continues to expand. Public projects consumed 11.5 billion GitHub Actions minutes in 2025 (+35% YoY), or 13.5 billion if including self-hosted usage as in last year's report (+30% YoY).
Automation raises fixes quickly, but merging remains a bottleneck when approval depends on humans or policy. Projects that configure Dependabot with auto-merge rules remediate vulnerabilities more consistently than those relying on manual review.
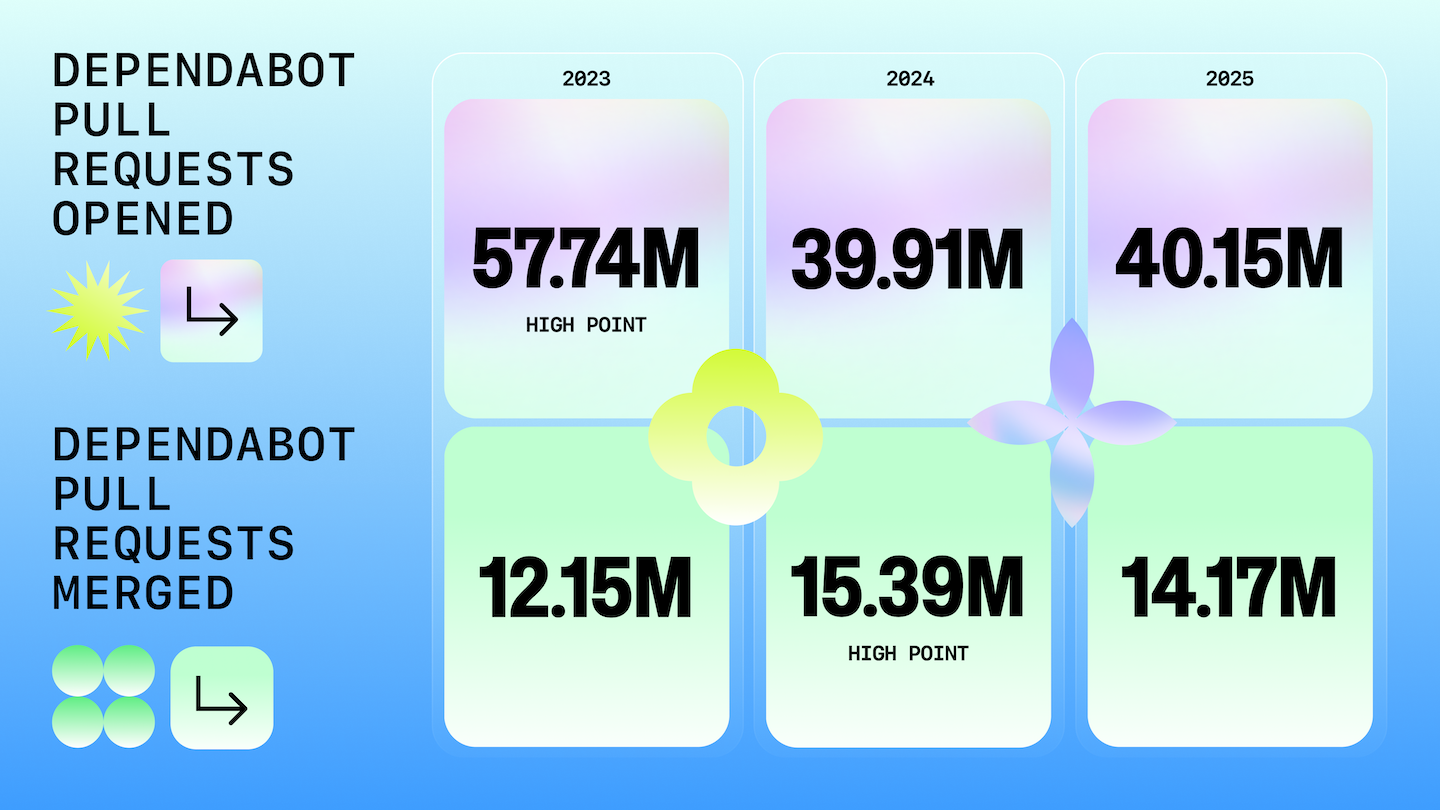
- Dependabot alerts peaked at over 12M in December 2022, following the Log4Shell and OpenSSL vulnerabilities.
- Monthly openings have settled near 3-4M, but merges hover around 1M. Only ~1 in 3 fixes ships the same month it's proposed.
- Alert patterns show brief spikes around new CVEs, followed by long tails of unresolved notifications — some likely tied to unmaintained zombie projects.
Critical vulnerability fix times dropped from an average of 37 to 26 days — a 30% improvement, with 26% fewer repositories receiving critical alerts.
Repositories defining Dependabot behavior in dependabot.yml more than doubled (846k, +137% YoY), signaling a shift from passive notification to automated patching within guardrails. When including projects that enable Dependabot in repository settings, the count reaches 2.668M+ projects (+24.27% YoY).
Broken access control tops CodeQL alerts
Broken Access Control became the leading CodeQL alert category, surpassing Injection across Python, Go, Java, and C++. Injection still leads in JavaScript, but the trend points to a broader challenge: authentication and authorization remain hard for developers and LLMs alike. AI-assisted development sometimes scaffolds endpoints that look correct but lack critical auth checks.
The same vulnerability category became the fastest-growing target for Copilot Autofix. By mid-2025, developers were accepting AI-generated fixes for Broken Access Control in 6,000+ repositories per month. Autofix also gained traction for Injection (3,100 projects), Insecure Design (2,300 projects), and Logging/Monitoring failures (3,500 projects).
On the supply chain front, 47 of the top 50 open source projects (94%) — by combined stars, forks, and issue authors — now use the OpenSSF Scorecard via GitHub Actions or are independently scanned, providing real-time security best-practice checks.
TypeScript edges Python as GitHub’s top language
For the first time in GitHub’s contributor-count history, TypeScript surpassed Python in August 2025 by roughly 42,000 contributors. Other industry indices that use different methodologies may still rank JavaScript or Python higher, but GitHub’s data marks a decade-long migration toward typed JavaScript and signals a shift in what teams consider the default for new development work.
- TypeScript grew by over 1 million contributors in 2025 (+66% YoY), driven by frameworks that scaffold projects in TypeScript by default and by AI-assisted development that benefits from stricter type systems.
- Python remains dominant in AI and data science with 2.6 million contributors (+48% YoY). Jupyter Notebook remains the go-to exploratory environment for AI (≈403k repositories; +17.8% YoY inside AI-tagged projects).
- JavaScript is still massive (2.15M contributors), but its growth slowed as developers shifted toward TypeScript.
Together, TypeScript and Python now account for more than 5.2 million contributors—roughly 3% of all active GitHub developers in August 2025. The rise of typed languages suggests AI isn’t just changing coding speed, but also influencing which languages teams trust to carry AI-generated code into production.
Python still trails the combined JavaScript and TypeScript ecosystem, a continuation of last year’s trend that highlights the sheer size of the typed and untyped JavaScript community. However, starting in 2025, Python’s growth curve began tracking almost identically in parallel with JavaScript and TypeScript, hinting that AI adoption is affecting language choice across all three ecosystems.
What else moved in 2025
- Python dominates AI projects. It remains the clear leader inside AI-tagged repositories, where Jupyter Notebook usage nearly doubled in 2025, evidence of its role as the go-to language for prototyping, training, and orchestrating AI workloads.
- Typed > loosely typed. TypeScript’s growth confirms the 2024 observation that much of what was previously counted as “JavaScript” activity already flowed through TypeScript transpilation pipelines. The data now shows typed languages are increasingly becoming the default.
- Enterprise stacks endure. Java and C# each added over 100k contributors this year, showing steady growth across large enterprise and game-dev environments even as AI reshapes the landscape.
- Legacy experiments emerge. COBOL appeared in the dataset with nearly 3,000 active developers—likely driven by organizations and hobbyists creating AI-assisted tutorial repositories aimed at modernizing legacy codebases.
Fastest risers by percentage growth
The languages below may not have the largest communities, but each has at least 1,000 monthly contributors and they’re posting the fastest year-over-year growth rates on GitHub.
| Language | Current developer count | YoY % | Why it’s hot |
|---|---|---|---|
| Luau | >3,600 | >194% | Luau is Roblox’s scripting language and a gradually typed language, reflecting a broader industry trend toward typed flexibility. |
| Typst | >3,600 | >108% | As a modern LaTeX alternative, Typst aims to make academic and technical publishing faster, less cryptic, and more collaborative. |
| Astro | >45,600 | >78% | Astro’s “islands architecture” and focus on shipping zero-JavaScript by default resonate with developers building fast, content-heavy sites (we added Astro to Linguist in 2021, which is our source for languages). |
| Blade | >91,100 | >67% | As Laravel’s templating engine, Blade rides on Laravel’s continued dominance in PHP web development. |
| TypeScript | >2,600,000 | >67% | Offering type safety for the JavaScript world, TypeScript’s combination of JavaScript ubiquity and type safety is compelling for both greenfield and legacy projects (plus, its types work well with AI coding tools). |
What new projects are built on
Nearly 80% of new repositories used just six languages: Python, JavaScript, TypeScript, Java, C++, and C#. These core languages anchor most modern development.
| Language | Total repositories (Sep 2024-Aug 2025) | Growth (Jan-Aug 2025 vs. Jan-Aug 2024) | What this growth tells us |
|---|---|---|---|
| Python | 9,261,587 | 53.41% | AI’s default glue with growth driven by ML, agents, notebooks, and orchestration. |
| JavaScript | 9,345,046 | 14.57% | Still ubiquitous for scripts and web apps, though growth is slower as TypeScript gains share. |
| TypeScript | 5,394,256 | 78.10% | Typed standard for modern web dev. Ideal for safe API/SDK integration, especially with AI. |
| Java | 3,520,215 | 9.35% | Reliable enterprise and backend workhorse. Gradual AI integration without language churn. |
| C++ | 1,701,552 | 11.82% | Performance-critical workloads used in game engines, inference, and embedded systems supporting AI. |
| C# | 1,478,463 | 10.61% | Steady enterprise and game dev usage, with AI capabilities folded into established ecosystems. |
- Experimentation is becoming more common. Though not a language, Jupyter Notebooks grew 24.5% YoY, with exploratory LLM experiments and data analysis now generating new standalone repos rather than remaining siloed in monorepos.
- Performance and systems languages are rising with AI (but not evenly). C grew ~20.9% YoY and C++ grew ~11.8% YoY, reflecting demand for faster runtimes, inference engines, and hardware-optimized loops.
- .NET stays strong. C# grew ~10.6% YoY, consistent with enterprise and game/tooling ecosystems—evidence that AI features are being integrated into existing .NET workflows rather than driving a wholesale language shift.
The state of AI development on GitHub
Python and Jupyter Notebook continue to anchor new AI projects, but the standout story this year is Python’s growth. Python now powers nearly half of all new AI repositories (582,196; +50.7% YoY), underlining its role as the backbone of applied AI work from training and inference to orchestration and deployment. Jupyter Notebook remains the leading exploratory environment for experimentation (402,643; +17.8% YoY), but the pivot toward Python codebases signals more projects moving out of prototypes and into production stacks.
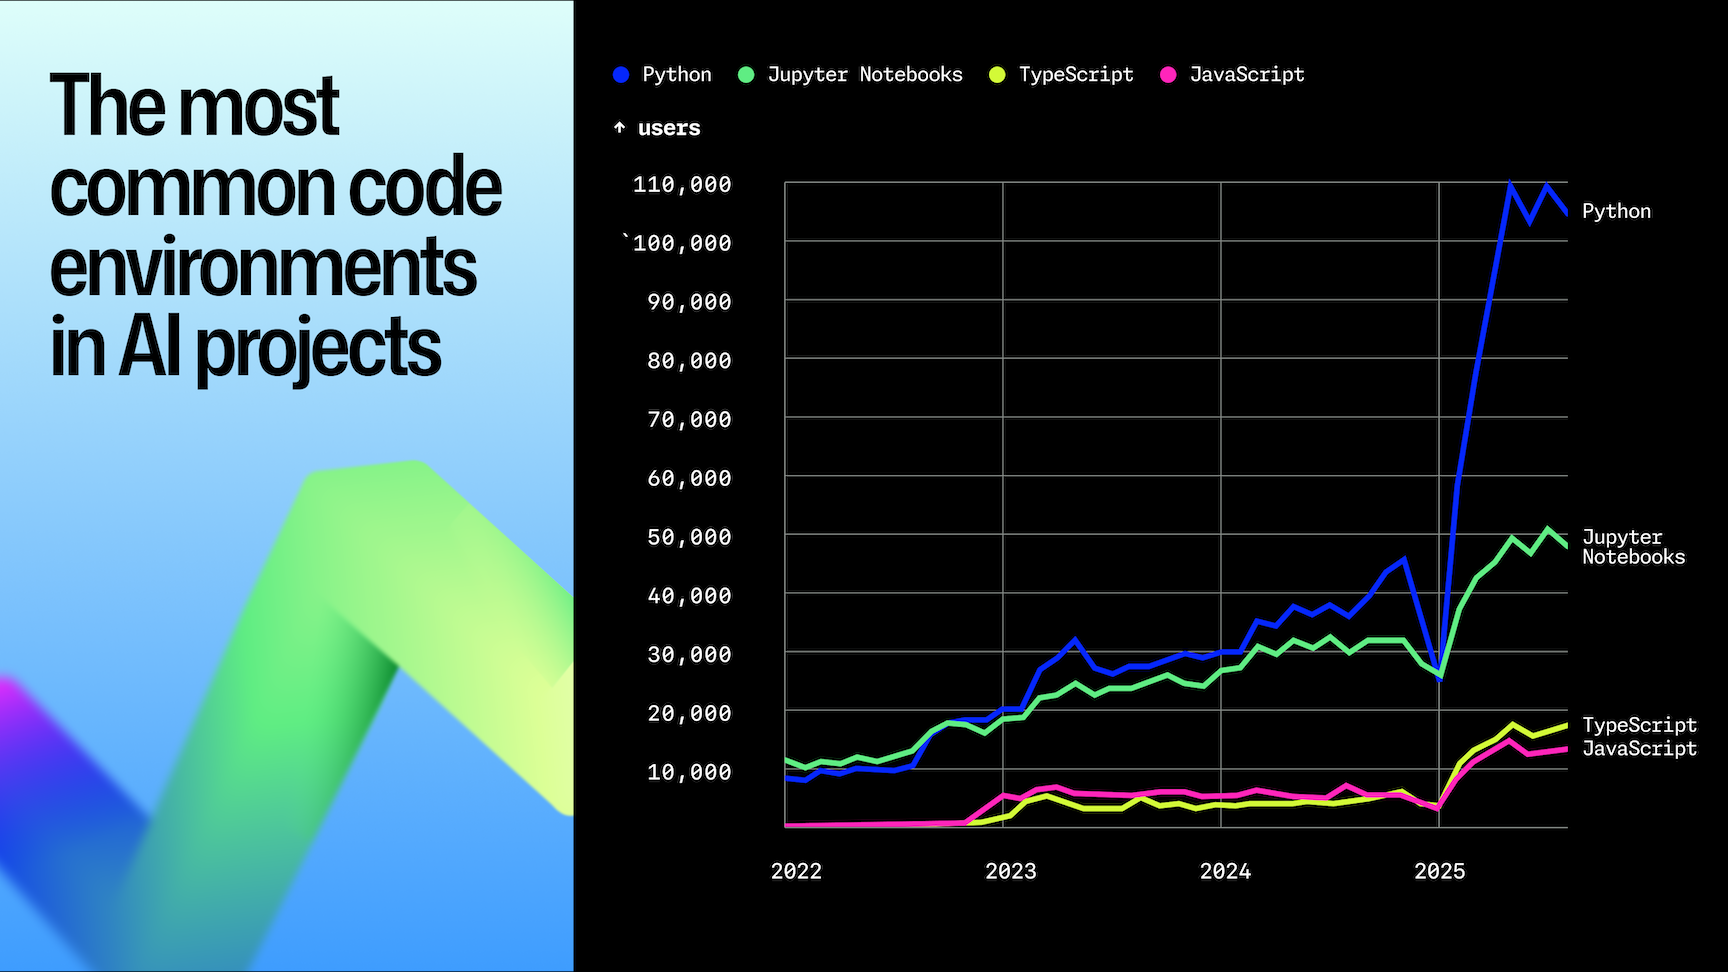
Front-end and app-layer languages grew sharply from smaller bases—TypeScript +77.9% (85,746) and JavaScript +24.8% (88,023)—mirroring the rise of demos, dashboards, and lightweight apps built around model endpoints. Shell scripts (+324%) emerged as the fastest riser, reflecting how teams codify eval harnesses, data prep, and deployment pipelines. And C++ crossed 7,800 repos (+11%), a steady reminder of its role in performance-critical inference engines, runtimes, and hardware-close systems.
AI-related repositories on GitHub now exceed 4.3 million, nearly doubling in under two years. Roughly 80% of new GitHub users tried Copilot within their first week, showing that AI is no longer an advanced tool to grow into but part of the default developer experience.
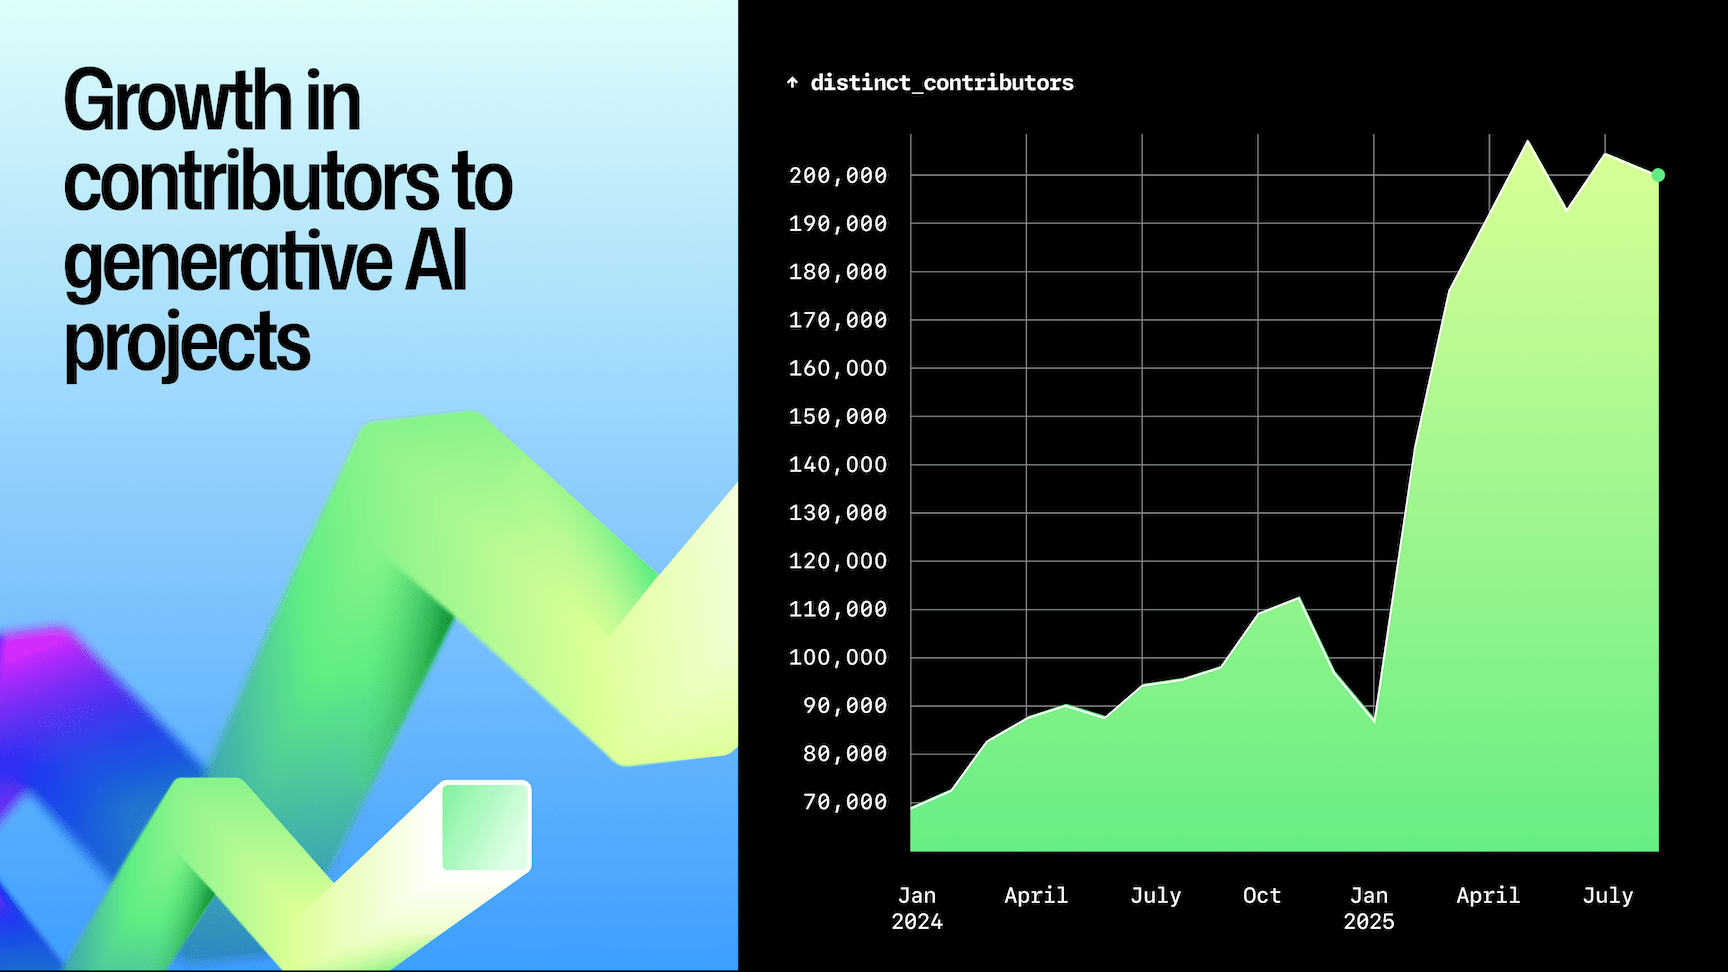
Monthly contributors to generative-AI projects climbed sharply across the September 2024–August 2025 measurement year. Months averaged ~151k contributors (median ~160k). Activity rose from ~86k in January 2025 to a peak of 206,830 in May (+132% YoY vs. May 2024), then held near ~200k through the summer. On a like-for-like basis, Jan–Aug 2025 averaged ~175k contributors, up +108% YoY vs. Jan–Aug 2024 (~84k)—a durable step-change rather than a one-off spike.
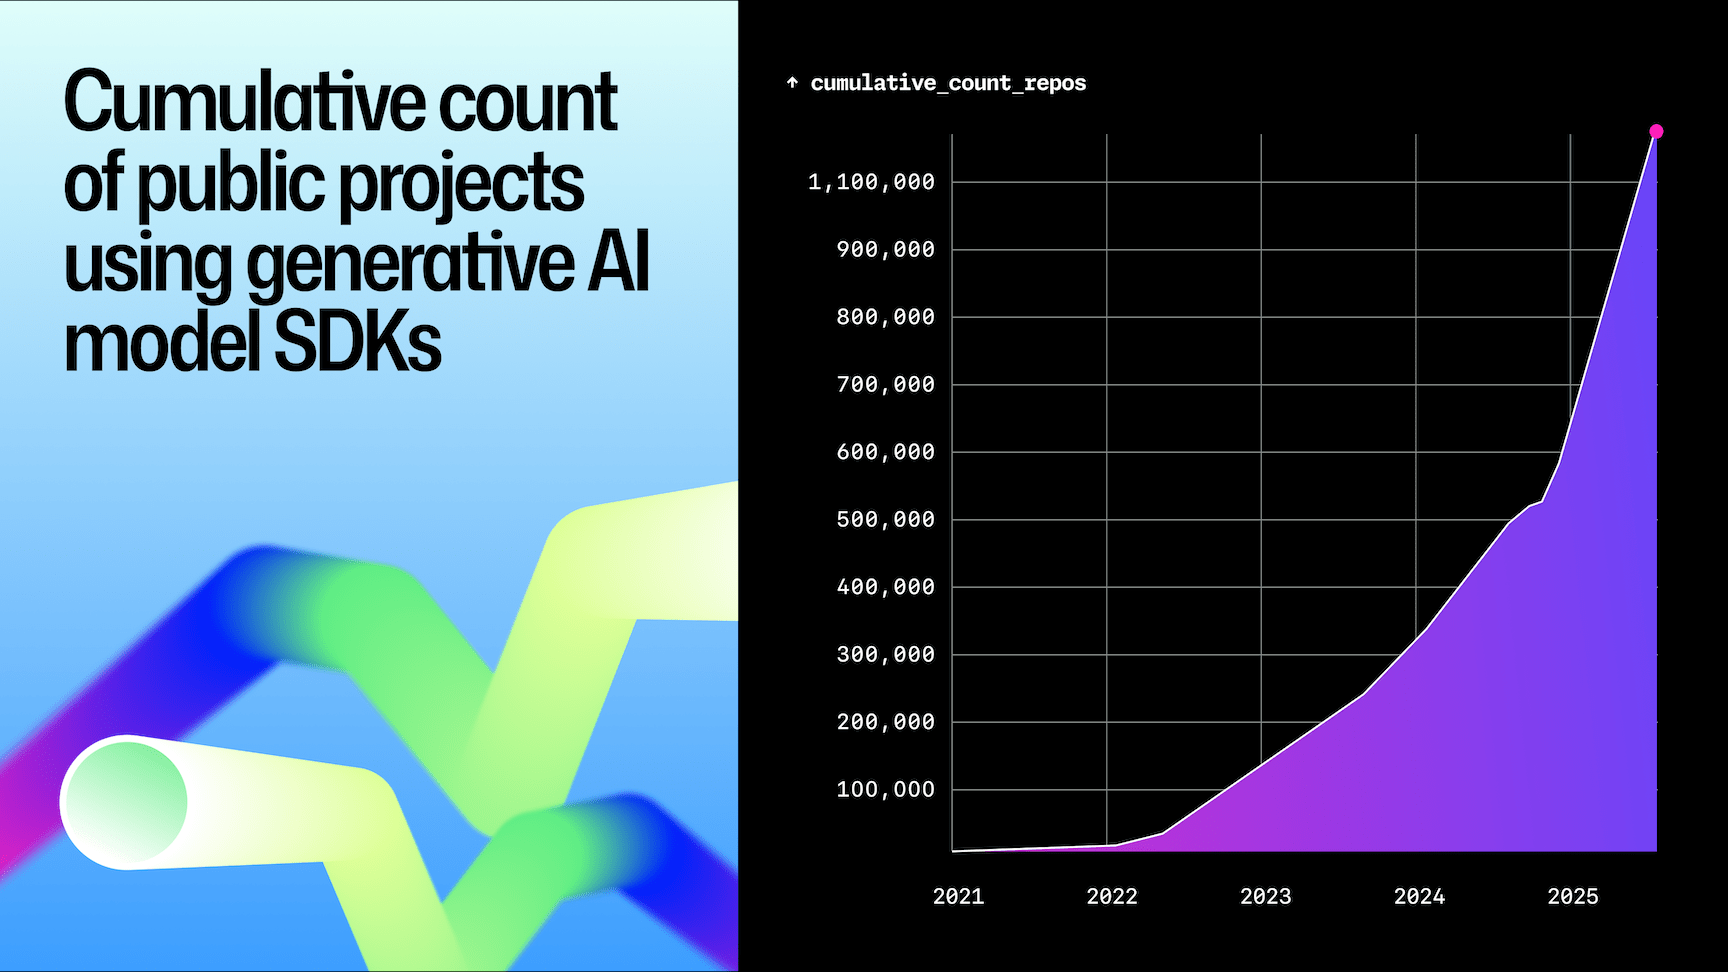
- Generative AI is becoming infrastructure. More than 1.1M public repositories now import an LLM SDK (+178% YoY, August ’25 vs. August ’24), supported by 1.05M+ contributors and 1.75M monthly commits (+4.8X since 2023).
- Growth surged early, then normalized. Contributors ran +100-118% YoY from Feb–May 2025, then cooled to +31% (Jun), +11% (Jul), and -3% (Aug) as teams shifted focus from experimenting to shipping.
- AI in open source. Half (50%) of open source projects have at least one maintainer using GitHub Copilot.
- Prototype-to-production pivot. Python-based code accelerated mid-2025 while Notebook growth flattened—signaling packaging into production. By year’s end, Notebooks rebounded, keeping pace with Python.
Scale replaces hype
1.13M+ public repositories now depend on generative-AI SDKs (up 178% YoY). More than 693k+ were created in the last 12 months, sharply outpacing 2024’s total (~400,000). The compounding curve that began in early 2023 shows no sign of tapering; every week, on average, new all-time highs are still being set.
Who’s shipping the code
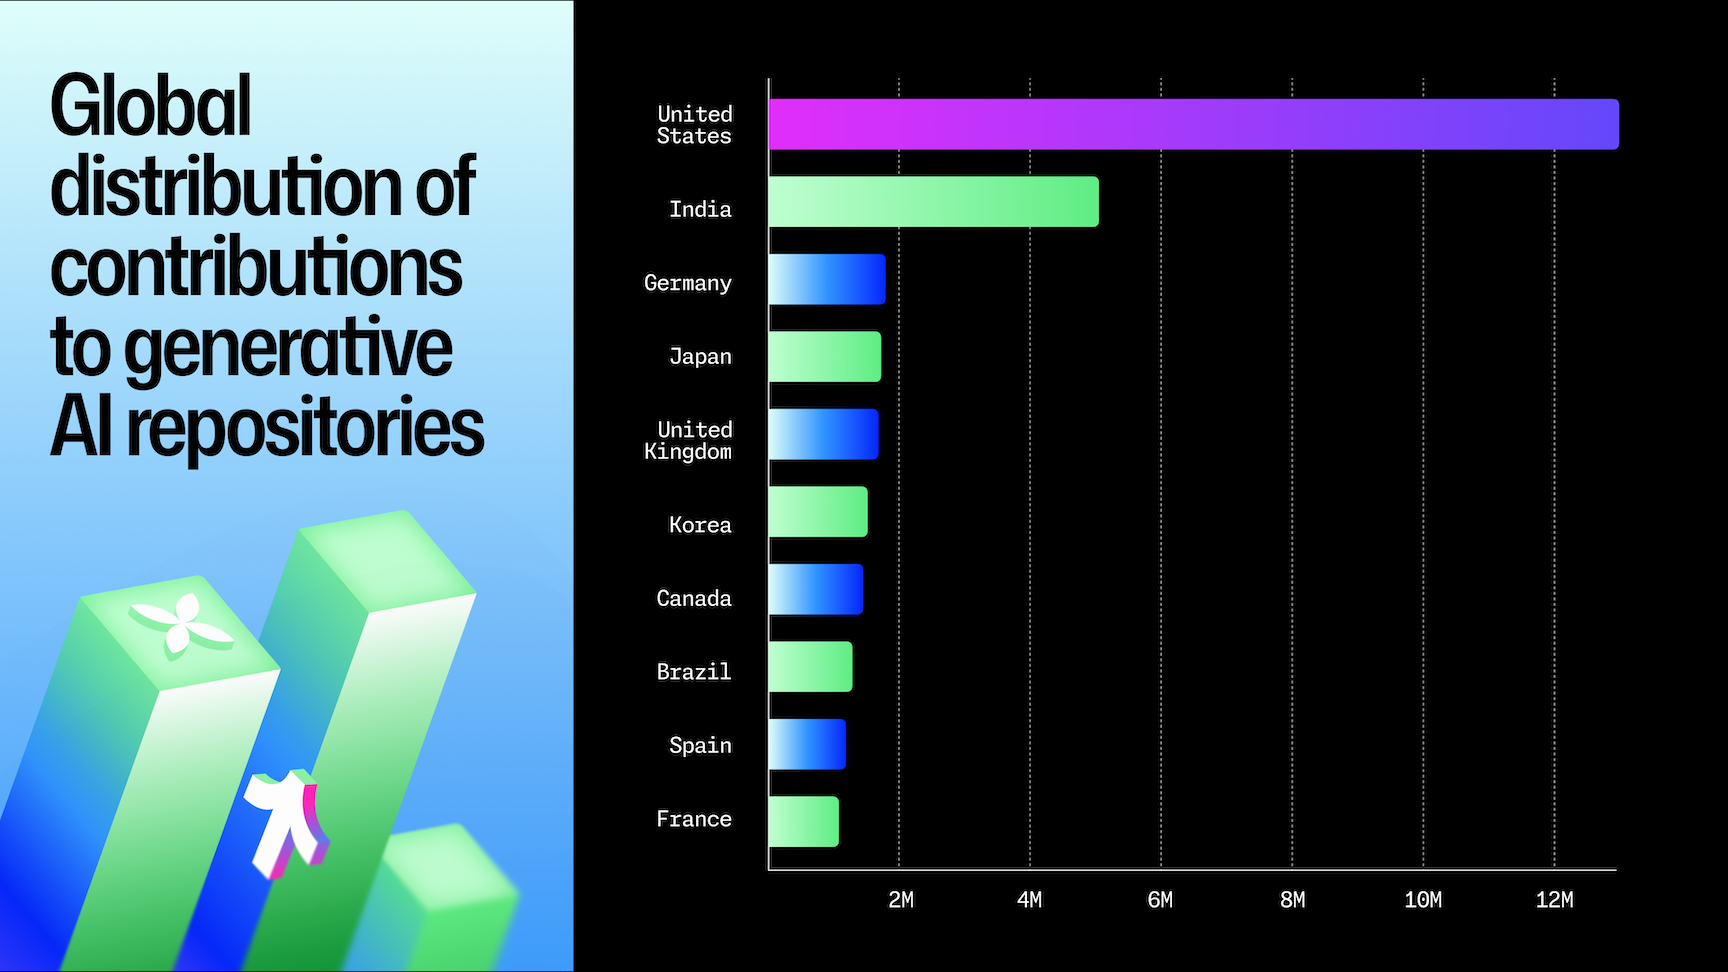
The U.S. remains the largest source of contributions (~12.8M, 31.8%). India ranks second (~5M, 12.5%) and leads by distinct repositories (405k vs. 342k). A second tier—Germany, Japan, U.K., Korea, Canada, Brazil, Spain, France—contributes another ~40%, globalizing the map.
Coding agents enter the workflow
GitHub Copilot coding agent went from demo to GA this year, and early data shows 1+ million pull requests created between May 2025 and September 2025. A repository-level comparison of public repositories with ≥1 coding agent-authored PR versus a random sample without Copilot coding agent shows strong selection effects: agent activity skews toward repositories with more stars, larger size, and greater age. Teams aren’t assigning agents only to throwaway projects; they’re trying them in better-known, established codebases too.
GitHub invites the community to run within-repository experiments (A/B or stepped-wedge) and matched analyses conditioned on size, stars, age, and complexity proxies to establish robust baselines.
AI breakouts reshape open source
Generative AI projects continue to rank among GitHub’s most popular. Projects like vllm, ragflow, and ollama outpaced the historical contributor growth of staples such as vscode, home-assistant, and flutter.
| Repository (age ≤3 yrs unless noted) | AI connection |
|---|---|
| vllm-project/vllm | Open source vision-language model + training/inference stack |
| ggml-org/llama.cpp | Local Llama inference on CPU/GPU |
| infiniflow/ragflow | End-to-end retrieval-augmented-generation (RAG) template |
| cline/cline | “LLM-native” command-line shell that reasons over local context |
| huggingface/transformers (6.6 yrs) | Defacto Python library for model loading/fine tuning |
- Software infrastructure outpaces everything else in velocity. Brand-new generative AI repositories (≤ 1 yr old) are racking up star counts that took other projects a decade to accumulate.
- Standards are emerging in real time. The rapid rise of Model Context Protocol (MCP) shows the community coalescing around interoperability standards.
- AI is reshaping classic tooling. Projects like ollama and ragflow show how local inference and AI-augmented pipelines are moving from proof-of-concept into mainstream developer workflows.
AI helps fix code, too
GitHub Copilot Autofix contributed to measurable improvements in 2025:
- Broken access control surged the fastest, with fixes accepted in 6,000+ repositories per month by mid-2025.
- Security logging and monitoring failures, injection, insecure design, and misconfiguration fixes also climbed sharply, each crossing into the thousands of repositories monthly.
- Autofix is addressing the most common OWASP Top 10 issues—not just exotic vulnerabilities—bringing AI into the daily fabric of software security.
Staying ahead
Early adopters using agents, open standards, and self-hosted inference are already setting norms for the next decade. Continuous AI—systems and workflows that are updated, retrained, and deployed on an ongoing basis—is emerging.
- Expect AI libraries to become “plumbing.” If your stack can’t load a model or pipe context into one, you’ll feel legacy-bound quickly.
- Go beyond notebooks. Package your experiments early to share them with others.
- Watch the toolchain, not just the models. The next productivity leap may come from LLM-native editors, shells, and test runners growing out of today’s fast-rising repositories.
- Build for interoperability. Standards like MCP and Llama-derived protocols are gaining momentum across ecosystems.
The 2025 State of Development: Three Milestones
Three years ago, the industry debated whether AI would replace developers or simply change how they work. The data from the past year settles that question: GitHub saw record activity across contributors, repositories, and experimentation. AI did not shrink the ecosystem—it expanded it.
Several historic milestones define the 2025 Octoverse report:
- India is now the largest contributor base to public and open source projects, overtaking the United States. India is also projected to surpass the US in total developer population within a few years, a clear sign of the field's globalization.
- TypeScript became the most used language on GitHub for the first time, passing both Python and JavaScript. This marks a generational shift in how modern software is constructed.
- Open source remains the core of the ecosystem, with public projects supplying the libraries, models, and workflows that drive most private development. The health of this ecosystem and its maintainers will set the pace and reach of the next wave of software innovation.
The narrative of 2025 isn't a contest between humans and AI. It's about the evolution of developers in the AI era—people who now orchestrate agents, shape language adoption, and drive entire ecosystems. Regardless of which agent, IDE, or framework they choose, GitHub is the convergence point.
Key Definitions and Metrics
To understand the report's findings, it helps to know exactly how terms are measured.
- 2025: The period from September 1, 2024 through August 31, 2025.
- Year-over-year comparisons: Unless otherwise noted, YoY values compare the same month across years (e.g., Aug 2025 vs Aug 2024) to account for seasonality.
- Contributions: Includes commenting on commits, issues, or pull requests; creating gists, issues, or pull requests; pushing commits; and reviewing pull requests.
- Contributors: GitHub users who performed any of the defined contribution activities.
- Developer: Anyone with a GitHub account. This group includes not just coders but also those making non-code contributions, researchers, and more.
- Total repositories: The combined count of all public and private repositories on GitHub.
- Programming language usage: Ranked by distinct monthly contributors who committed code in that language, the standard measure behind claims like "TypeScript became the most used language."
- AI-related repository: Any repository tagged with relevant topics (e.g., "AI," "ML," "LLM") or fitting a broader AI classification. This captures both dedicated AI work and adjacent experimentation.
- Agentic workflows: Tasks completed with autonomous or semi-autonomous AI tools, such as Copilot coding agents opening pull requests, AI-based issue triage, or automated test runs.
- Copilot coding agent: A feature that can independently draft code, run tests, and open draft pull requests in a secure sandbox, pending developer review.
- Copilot code review: A feature that reviews pull requests, suggests changes, and surfaces potential issues before merging.
- GitHub Actions minutes: CPU minutes spent running CI/CD workflows, reported cumulatively and as YoY growth.
- CodeQL: GitHub’s semantic analysis engine for detecting security vulnerabilities, with alerts categorized by type.
- Mona rank: A repository ranking based on the sum of separate ranks for stars, forks, and unique issue authors.
- LLM SDK: Official libraries from model providers (e.g., OpenAI, Anthropic, Meta, Mistral, Cohere, AI21) that wrap model APIs with client tools, enabling developers to handle prompts and responses without building low-level infrastructure. Usage metrics reference SDKs from providers available via GitHub Models.
How the Data Was Collected
The Octoverse report is built on a specific set of methodologies for consistency and reliability.
Scope and Time Windows
- The Octoverse year spans from Sep 1, 2024 through Aug 31, 2025.
- Unless stated otherwise, metrics reflect public activity only. This data is often available via the GitHub Innovation Graph, which publishes country-level metrics only when at least 100 unique developers performed the activity.
- Monthly snapshots use calendar months to highlight peaks and turning points, such as the Aug 2025 language rankings.
- Trailing-12-month (T12) comparisons contrast Sep ’24–Aug ’25 with Sep ’23–Aug ’24 for YoY trends.
- Historical context draws from data going back to Jan 2022 where relevant.
Counting and Attribution Rules
- Contributors and developers are counted as monthly unique users per metric. Users can appear in multiple categories in the same month, so these counts don't sum across categories.
- Repositories are counted in a month if created or active, per the metric definition.
- Same-month YoY is used for milestones and seasonality control, while T12 YoY is used for sustained trends like average monthly contributors.
- Stock vs. flow: Stock is the level at a point in time (e.g., SDK repos as of Aug ’25); flow is adds over a window (e.g., Sep ’24–Aug ’25). These are labeled distinctly.
Classification and Quality
- Geography is based on self-reported locations, standardized to ISO country codes, with any aggregate under 100 developers withheld.
- Primary language: Mixed-language repositories are attributed to a single primary language (e.g., TypeScript/JavaScript mixes may appear under one). "Jupyter Notebook" is a development-environment classification and is labeled as such.
- AI projects are identified via generative-AI SDK usage and related metadata.
- Statistical techniques include monthly time-series tracking, cumulative counts for stock growth, and Top-N rankings with minimum thresholds (e.g., lists may require ≥1,000 contributors) to reduce noise.
- Bot and automation filtering uses account flags and behavioral heuristics; incomplete months are excluded from comparisons.
Forecasting Developer Growth
Projections about future developer populations rely on a mix of historical data and statistical models, but they come with caveats.
- Forecasting models: A collection of time-series and regression models using historical GitHub data, sign-up rates, product usage, and market-sizing information to predict future outcomes.
- Accuracy expectations: No forecast is perfect. Backtesting shows growth projections were within a reasonable margin of error—less than 30% Mean Absolute Percentage Error.
- Unmodeled external factors: These forecasts do not account for changes in the competitive landscape, geopolitical or economic conditions, or future product releases that might shift behavior away from historical patterns.