
Why agentic workflows burn tokens
GitHub Agentic Workflows act like a crew of automated maintainers, tidying up repositories and enforcing quality. But because these CI jobs trigger automatically and often, their token consumption can quietly balloon. Unlike interactive coding sessions, whose workload is unpredictable, agentic workflows run the same YAML-defined job on every execution—which makes them a prime target for systematic cost reduction.
When we began optimizing the workflows we maintain and use internally in April 2026, our first problem was measurement. Every agent framework (Claude CLI, Copilot CLI, Codex CLI) logged usage in a different format, and historical data was often incomplete. Our security architecture, which routes all agent traffic through an API proxy so agents never see authentication credentials, gave us a single point to capture normalized usage data.
Each workflow now emits a token-usage.jsonl artifact containing per-API-call records of input tokens, output tokens, cache-read tokens, cache-write tokens, model, provider, and timestamps. Combined with existing workflow logs, this gave us a complete picture of typical token spend per run.
Self-optimizing workflow loops
With usage data flowing, we built two daily agentic workflows to act on it. A Daily Token Usage Auditor aggregates token artifacts across recent runs by workflow and posts a structured report, flagging workflows whose usage has spiked, surfacing the most expensive jobs, and noting anomalies like a workflow that normally finishes in four LLM turns suddenly taking 18.
When the Auditor flags a problem, a Daily Token Optimizer examines the workflow's source and recent logs to file a GitHub Issue containing concrete inefficiencies and specific optimization proposals. The Optimizer has surfaced many patterns we would have missed manually. The Auditor and Optimizer are themselves agentic workflows, so their own token usage appears in the daily reports—a small virtuous cycle that keeps the system honest.
Pruning unused MCP tools
The most common inefficiency the Optimizer identified was unused MCP tool registrations. LLM APIs are stateless, so agent runtimes resend the full set of tool names and JSON schemas with every request. A GitHub MCP server with 40 tools contributes roughly 10–15 KB of schema per turn; if the agent only calls two of those tools, the rest is pure overhead on every single API call.
Workflows naturally start with broad tool access, but mature agents settle into a narrow, stable tool set. The Optimizer cross-references the configured tool manifests against actual tool calls in the logs and recommends pruning the unused entries. In our smoke-test workflows this alone cut per-call context by 8–12 KB, saving thousands of tokens per run with no behavioral change.
Moving data fetching out of the reasoning loop
A larger structural win came from replacing GitHub MCP calls for retrieving diffs, file contents, and review comments with the GitHub CLI. An MCP tool call is itself a reasoning step: the agent must choose the tool, format arguments, and ingest the response as context, consuming tokens for the tool schema, argument block, and reply on every round trip. A gh pr diff call, by contrast, is a deterministic REST API request with no LLM involvement.
We applied two migration strategies. For data the agent will always need—like the PR diff or changed-file list—we added setup steps that run gh commands before the agent starts and write results to workspace files. The agent reads files instead of making MCP calls, letting it lean on its strong bash scripting skills to process the data. For data the agent must discover at runtime, we deployed a lightweight transparent HTTP proxy that routes CLI traffic to GitHub's API without exposing a token to the agent. The agent runs gh pr view --json and gets structured output just as a terminal user would. Together these techniques removed the majority of GitHub data-fetching from the LLM reasoning path.
Measuring efficiency without fooling yourself
Optimizing turns out to be easier than verifying the optimization. Three confounders make raw token counts misleading.
Token cost varies by model. The same workflow on Claude Haiku versus Claude Sonnet produces similar counts but roughly 4× different cost. To compare apples to apples we compute an Effective Tokens (ET) metric with model and token-type multipliers:
ET = m × (1.0 × I + 0.1 × C + 4.0 × O) where m is the model cost multiplier (Haiku = 0.25×, Sonnet = 1.0×, Opus = 5.0×), I is new input tokens, C is cache-read tokens, and O is output tokens. Output tokens carry 4× weight as the most expensive token type across providers; cache reads carry 0.1× since they are served at a fraction of fresh input cost. ET lets a 10% reduction represent a genuine cost drop regardless of which model is running.
Live repos have volatile workloads. One run may handle a five-line fix and the next a 200-line PR; raw counts will vary far more than efficiency does. We track LLM API call counts alongside tokens—constant turns-per-run with falling tokens-per-call signals genuine improvement, while both falling together may just mean less work.
Quality is hardest to assess. Cheaper models or tighter constraints can degrade output. We rely on process signals—output tokens per call, turn counts, tool-call completion rates—as a proxy. Our optimized Smoke Copilot workflow completed in roughly five LLM turns before and after optimization, with output tokens per call and completion rates stable, while token consumption fell. These are process indicators, not ground-truth correctness; measuring tokens per unit of correct work remains open.
Preliminary results
We deployed the Auditor and Optimizer across a dozen production workflows in the gh-aw and gh-aw-firewall repos. Nine received optimizer-recommended changes. We report only workflows with at least eight runs before and after optimization:
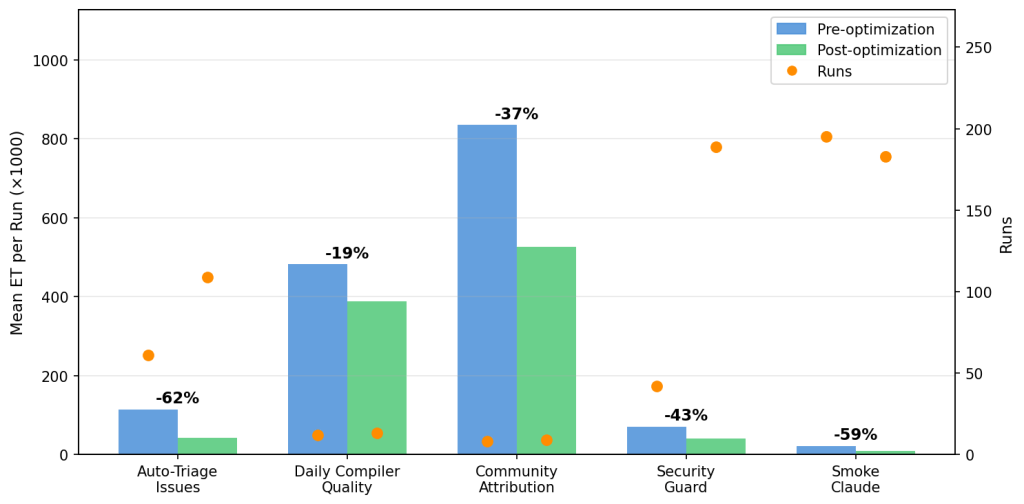
Auto-Triage Issues, which fires on every new issue (averaging 6.8 runs per day, peaking at 15), showed a sustained 62% ET reduction across 109 post-fix runs. Daily Compiler Quality improved 19% over 12 runs, and Daily Community Attribution 37% over eight. In gh-aw-firewall, Security Guard and Smoke Claude, which run most frequently, improved 43% and 59% respectively.
Run frequency matters as much as per-run savings. Auto-Triage's 62% reduction at 6.8 runs/day saved roughly 7.8 M ET over the observation window; Security Guard and Smoke Claude run even more often. Not every recommendation translated into measurable savings though—Contribution Check saw a 5% ET increase, a reminder that short windows on live repositories are noisy and that per-run gains can be offset by workload variation.
Patterns worth copying
Three recurring patterns explain most of the savings we measured across the optimized workflows.
Deterministic reads should happen before the agent starts. The Auto-Triage Issues workflow showed the strongest sustained improvement in gh-aw: −62% across 109 post-fix runs. The cause was structural. A large share of agent turns fetched issue metadata and scanned labels—operations that needed no inference. Moving those reads into pre-agentic CLI steps removed them from the LLM reasoning loop entirely. The same logic drove Security Guard's −43% reduction in gh-aw-firewall: a relevance gate now skips the LLM for pull requests that don't touch security-sensitive files. The cheapest LLM call is the one you don't make.
Contribution Check is the counter-example that keeps expectations honest. Input tokens were 82–83% cache reads, yet average ET rose 5%. That wasn't an optimization failure—it was a workload shift. Before optimization, 41% of runs handled small pull requests (ET < 100K) and 39% handled large ones (ET > 300K). After optimization, a burst of development activity flipped those numbers to 9% small and 65% large. Output tokens, which carry a 4× weight in the ET formula, rose 14% as the agent reviewed bigger diffs. Per-turn efficiency almost certainly improved; the aggregate numbers were swamped by heavier workloads.
Unused tools are expensive to carry. In the excluded gh-aw workflows, Glossary Maintainer made the point sharply. One tool, search_repositories, was called 342 times in a single run—58% of all tool calls—even though the workflow only scans local file changes. The optimizer's recommendation was to remove it. In gh-aw-firewall, Smoke Claude's −59% reduction came partly from aggressive MCP tool pruning combined with a model-tier switch to Haiku.
There are limits to that approach. Daily Community Attribution was configured with eight GitHub MCP tools and called none of them across an entire run, yet removing them didn't reduce ET. Tool manifests were a negligible fraction of that workflow's context.
One misconfigured rule can cause a runaway loop. Among excluded workflows, Daily Syntax Error Quality had the highest ET in the project. The root cause was a one-line configuration error: the workflow copied test files to /tmp/ then called gh aw compile, but the sandbox's bash allowlist only permitted relative-path glob patterns. Every compile attempt was blocked. Unable to use the tool it needed, the agent fell into a 64-turn fallback loop, manually reading source code to reconstruct what the compiler would have said. Fixing the allowed bash patterns eliminated the loop. We lacked enough baseline runs to quantify the improvement precisely, but the pathology was unambiguous.
Where the next wins are
The optimization toolkit we used—API-level observability, automated auditing workflows, MCP tool pruning, and CLI substitution—is built into the GitHub Agentic Workflows framework today. A further optimization on the roadmap is refactoring monolithic agents into teams of subagents built on smaller, cheaper models.
The broader move ahead is from workflow-level to system-level optimization. A workflow run isn't a flat sequence of API calls. It's a chain of episodes: gathering context, reading artifacts, retrying after failure, synthesizing a final answer. Once those episodes are visible, better questions become possible. Which episode drove a costly run? Which are repeated, blocked, or failed work? Which should stop being agentic and become deterministic pre-steps?
The same logic extends to the portfolio. Repositories run fleets of agentic automations that often trigger on the same events, inspect the same diffs and logs, and produce adjacent judgments. Cost is therefore not just a property of a single workflow but also of overlap across the portfolio. The analyses we want next are portfolio-level: where workflows duplicate reads, where several should be consolidated, and where shared intermediate artifacts should be cached instead of rediscovered by each run.
These questions are genuinely hard. Measuring goodput still requires outcome instrumentation that doesn't exist at scale for agentic CI workflows, and episode- and portfolio-level efficiency requires richer lineage data than most systems collect today. But the direction is the right one. Proxy-level observability and the optimizer workflows have already changed how we develop and deploy agentic automations. We add token monitoring from day one rather than retrofitting it, and we increasingly think in terms of avoidable work across the entire automation fleet, not just expensive runs in isolation.
If you're running agentic workflows in CI and suspect you're overspending, the first step is the one we took: add the API proxy, turn on logging, and let the data point you to the problem.
gh extensions install github/gh-aw
gh aw add githubnext/agentic-ops/copilot-token-audit githubnext/agentic-ops/copilot-token-optimizer
Running these workflows alongside existing CI gives immediate visibility into usage and supports continuous optimization over time.