A Production View of the AI Model Landscape
Model leaderboards measure isolated races under controlled conditions. Production traffic tells a different story—one where cost, volume, and reliability requirements split the market into distinct layers that no single lab dominates. Vercel's AI Gateway, which routes tens of trillions of tokens across hundreds of models for real applications and agents, offers a seven-month view into those patterns based on usage from over 200,000 teams.
Four findings stand out from the data:
- Anthropic leads in spend despite higher unit prices; Google leads in token volume
- OpenAI's spend share grew quickly after recent model releases
- High-volume workloads route across 30+ distinct models on average
- Agentic workloads now carry 59% of all token volume, up 2x in six months
Spend and Volume Tell Different Stories
In April 2026, Anthropic captured 61% of spend through AI Gateway, followed by Google at 21% and OpenAI at 12%. The volume picture flipped: Google handled 38% of tokens, Anthropic 26%, OpenAI 13%, and xAI 10%, with smaller labs splitting the remainder.


These rankings diverge because they measure different workloads. Premium reasoning calls land on Claude Opus, while cheap, fast calls route to Gemini Flash. Spend follows high-stakes calls where correctness matters; volume follows low-stakes ones where cost per token dominates. The same customer base appears on both leaderboards, using each lab for a different layer of the same application.
Several signals drove the shifts:
- Gemini Flash helped Google take the volume lead at a smaller share of spend
- Claude Opus keeps Anthropic atop spend with less volume than Google
- OpenAI's spend share tripled from March to April following the GPT-5.4/5.5 releases
- Google's spend share climbed from 8% in March to 21% in April as Flash usage scaled
Mistake Costs Dictate Per-Token Economics
The cost/volume divide persists at workload granularity. Personal assistants account for 20% of cost on 40% of token volume, while back-office agents run at 6% of cost on 15% of tokens. Coding agents sit roughly balanced at 22% of cost on 20% of tokens, and app generation at 7% of cost on 11% of tokens.

What a workload spends per token tracks the cost of being wrong. Personal assistants run on cheap, fast models because mistakes affect only individual users and are quickly corrected. Back-office workflows pay for stronger reasoning because errors can trigger legal, financial, or operational risks that outweigh per-call savings. The same pattern holds across B2C and B2B: consumers generate many low-cost calls, while businesses run fewer, more expensive ones—B2B costs roughly twice as much per token as B2C.

Provider Strengths Are Layer-Specific
Breaking the data down by use case shows a fragmented landscape with no universal winner:
- Anthropic leads in software building
- Google over-indexes in consumer applications
- OpenAI is the most evenly distributed across categories
- xAI and others split across coding, consumer, and long-tail use cases

Anthropic's concentration sits at the high-stakes layer. Its token share drops from 71% in back-office work to 7% in consumer, while its cost share follows a much shallower curve and keeps the lead through three of four categories. Revenue concentrates wherever answers must be right, regardless of volume.
Google is the inverse shape: its footprint concentrates in consumer, where Gemini Flash carries 28% of tokens at 15% of cost. That position is a single-SKU bet that rises and falls with Flash adoption. xAI acts as a price wedge, carrying 20% of building tokens and 18% of outreach tokens at materially smaller cost shares in each. OpenAI is the most balanced—6% of building cost, 18% of consumer cost, 28% of outreach cost—making it the least exposed to disruption in any single layer.
Open-weights families like Kimi, MiniMax, and GLM rotate through the consumer and building tiers where the cost ceiling is lowest. Their cost share stays small, but their token share in those tiers is large enough that cost-only views understate their presence.

Agentic Traffic Is Reshaping Request Patterns
The composition of production AI requests has shifted dramatically. In April 2026, 22.2% of AI Gateway requests ended with a tool call, up from 11.4% in October 2025. Measured by tokens, the change is larger: 58.9% of all tokens now flow through tool-call requests, up from 31.6% six months earlier.

Both measures roughly doubled in half a year, but the gap between them is the telling number. Tool-using requests are about 2.6x more token-heavy than the rest, meaning the cost surface of AI has shifted from chat-shaped to agent-shaped while headline request counts barely moved. Every round trip in an agent chain bills against the same meter—whether function execution, API call, database query, or code run—so an agent shipping ten tool calls bills roughly ten times the tokens of a single chat prompt.
Scale Demands Multi-Model Architecture
Multi-model routing stops being optional at scale and becomes standard architecture. Teams running 1K to 10K requests averaged 3 distinct models. Teams in the 10M+ requests bucket average 35 models in regular use, up from 18 in the 1M–10M bucket.

Those 35-model fleets operate as routing graphs: a cheap classifier for intent detection, a frontier model for reasoning, an embedding model for retrieval, a fast model for summarization, a vision model for screenshots. Every model is swappable. If a provider raises prices, degrades quality, or suffers an outage, traffic redistributes in hours. At the scale generating most leaderboard spend, switching labs is closer to a configuration change than a vendor migration.
New Models Are Absorbed Within Weeks
The same fleet design explains how quickly new releases get adopted. When a new version ships inside a model family, traffic moves to it within weeks. Claude Sonnet 4.6 absorbed most of the Sonnet family's share by its first full month after launch.

The Opus family is following the same curve, with Claude Opus 4.7 taking share from Opus 4.6 on a near-identical trajectory.
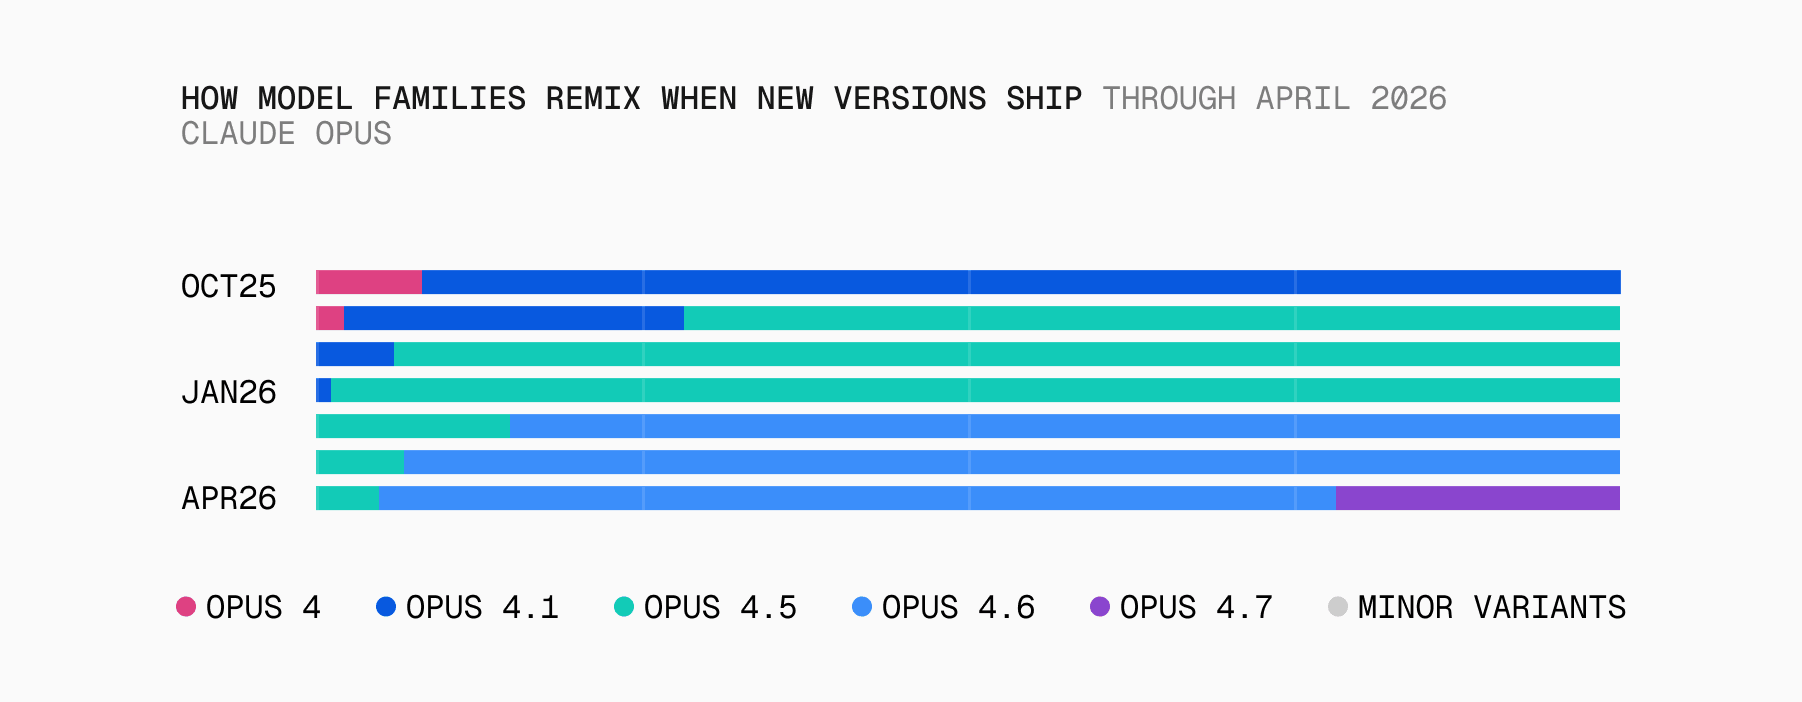
Predecessor models stayed live and routable throughout both windows, yet teams migrated anyway. The labs no longer set the upgrade timeline for their own product lines.
Failures Hit the Expensive End of the Curve
Roughly 3.5% of requests on AI Gateway complete after a fallback—the initial route hit an error, rate limit, or timeout, and the gateway reissued the request to a healthy alternative. Measured in tokens, the rescue rate runs at 5.1%; in dollars, 4.9%.

The divergence matters. Long context windows hit rate limits more often than short ones, multi-step agent runs accumulate failure across steps, and heavy reasoning calls time out under sustained load. Each failure mode targets the expensive end of the workload. A provider's SLA measures request-level uptime, but production applications experience cost-weighted uptime—and the two come apart on exactly the calls that paid for the model.
Architect for Workloads, Not Labs
Across every cut of the data, the same shape emerges: different labs win different layers of the same applications, and production teams at scale have built architectures that handle those layers. The pattern echoes the early cloud era—teams expanded compute capacity first and squeezed per-unit cost later. The 35-model fleets at the top of the spend curve show the same behavior at faster cadence, with optimization happening at the routing layer.
For teams shipping AI today, the implications are direct:
- Plan for multiple models across providers from the start
- Build fallbacks in to optimize for uptime and cost
- Treat routing as a core architectural unit, not an afterthought
About This Data
This analysis draws on anonymized, aggregate routing data from the Vercel AI Gateway through April 2026. Spend figures use market-rate published list prices to normalize across teams that bring their own API keys. Volume counts tokens routed through the gateway. B2C, B2B, and use-case classifications are aggregate; no individual team or workload is identified.