
Why Test on a Real iPhone?
Desktop browser emulation has blind spots. Layout bugs that only appear on actual mobile hardware — like the infamous horizontal scroll caused by an element overflowing its container — can be invisible even when using DevTools' device mode. If an issue only reproduces on a physical device, you need a workflow that gets your local dev server onto that device and lets you inspect what's happening.
There are two separate problems to solve: making localhost reachable from your phone, and opening Safari's developer tools to debug the page.
Exposing Your Local Server
The naive approach — putting your computer and iPhone on the same Wi-Fi network and hitting your machine's IP address — is fiddly. Your dev server often needs to be bound to 0.0.0.0 instead of 127.0.0.1, and the configuration changes per tool (e.g., gatsby develop --host 0.0.0.0). macOS's network sharing options for USB-connected iPhones are unreliable and present a number of intimidating prompts without guaranteed success.
A more dependable route is to use a tunnelling service like ngrok to expose a single port publicly. Alternatives like localtunnel and serveo exist, but ngrok's free tier is sufficient and reliable.
ngrok Setup
- Sign up for a free account at ngrok's dashboard.
- Copy your authentication token from the dashboard.
- Download the desktop client and unzip it. It runs from the command line; keeping it in your home directory (
~/ngrok) is common. - From that directory, authenticate:
./ngrok authtoken <YOUR_AUTH_TOKEN>
Tunneling Your Dev Server
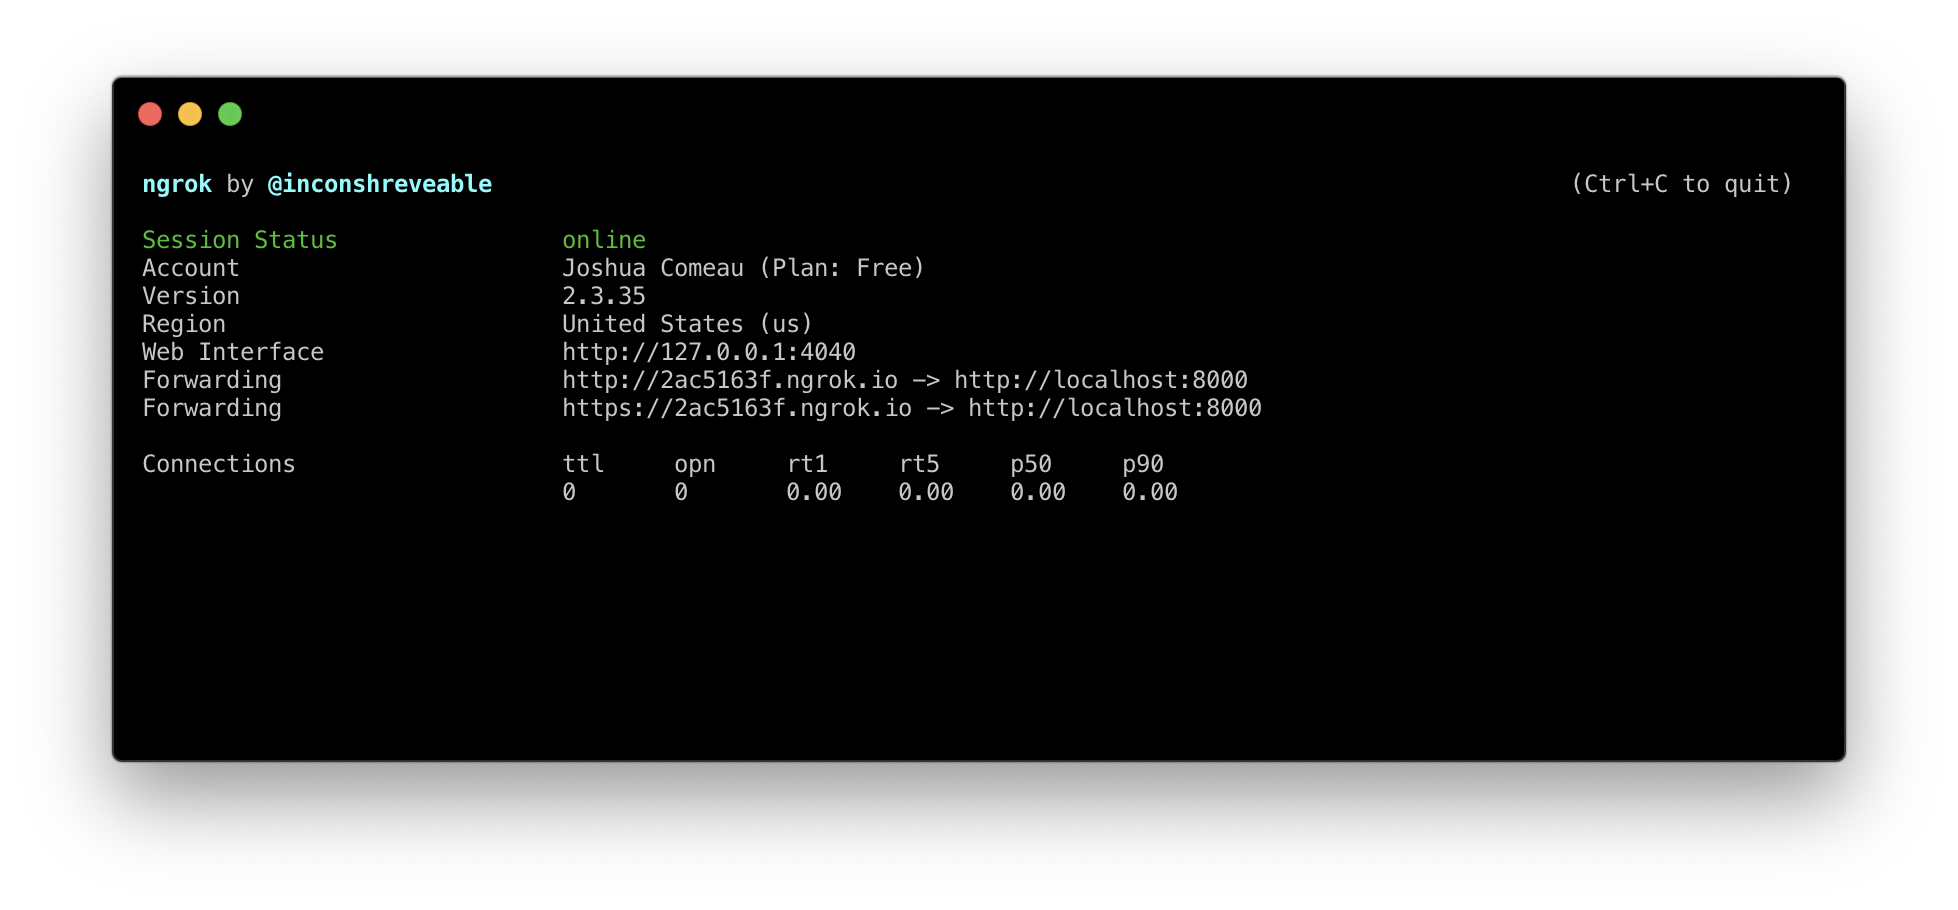
Once configured, expose your local server with a single command. The first argument is the protocol (http or https), and the second is the port your dev server runs on (e.g., 8000 for a Gatsby site):
$ ./ngrok http 8000The output will display a forwarding URL, typically formatted like http://abc123.ngrok.io. Visiting that URL on your iPhone will load your local dev code.
Debugging with Safari's Web Inspector
Accessing the page is only step one. To diagnose issues, you need the developer tools. Since all iOS browsers are built on WebKit, you must use Safari's tools — which are more than adequate for inspecting the DOM, viewing console logs, clearing local storage, and profiling performance on the device.
Enable Web Inspector on Both Ends
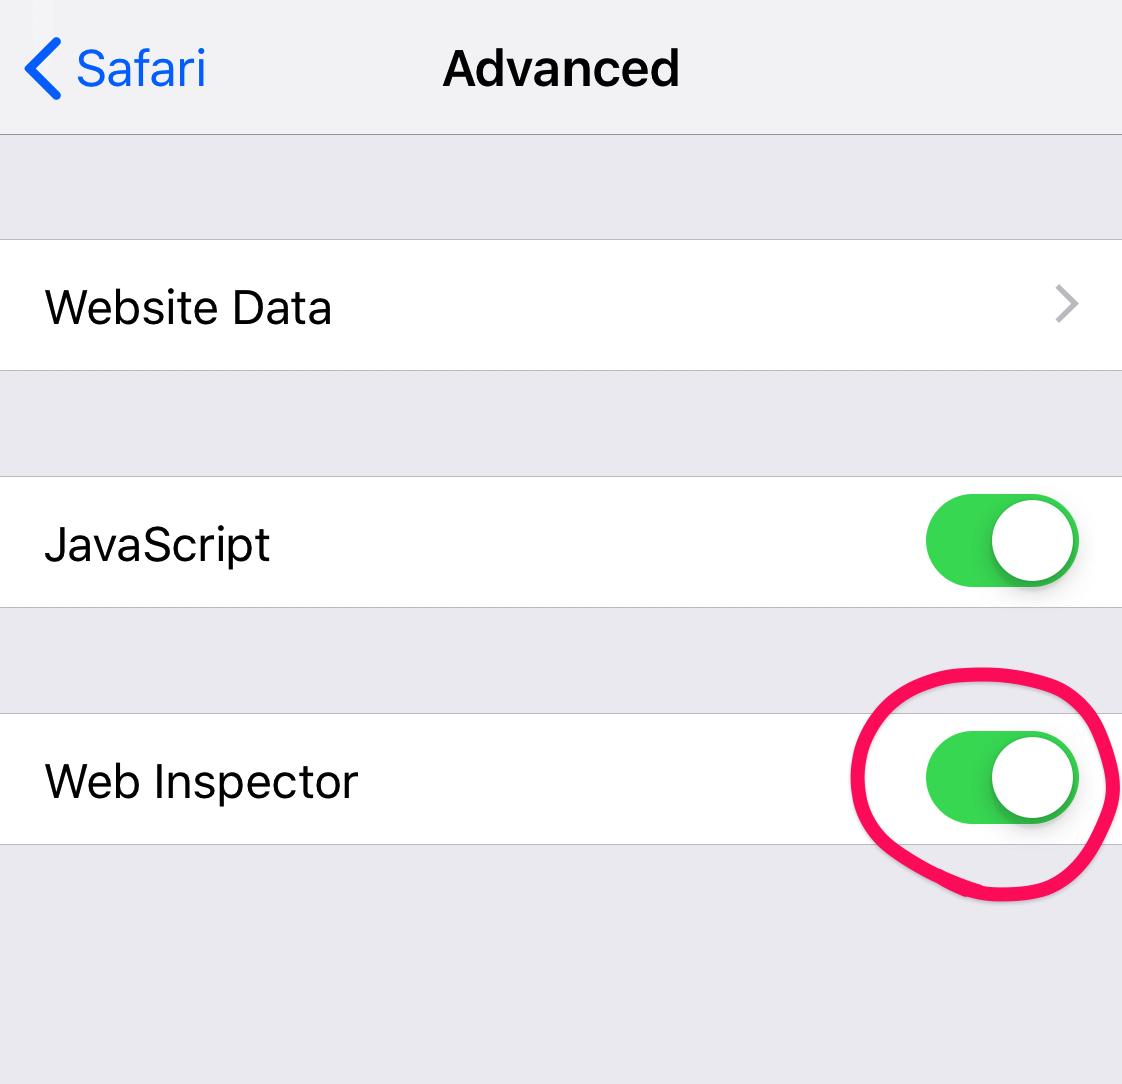
- On your iPhone: go to Settings › Safari › Advanced and enable Web Inspector.
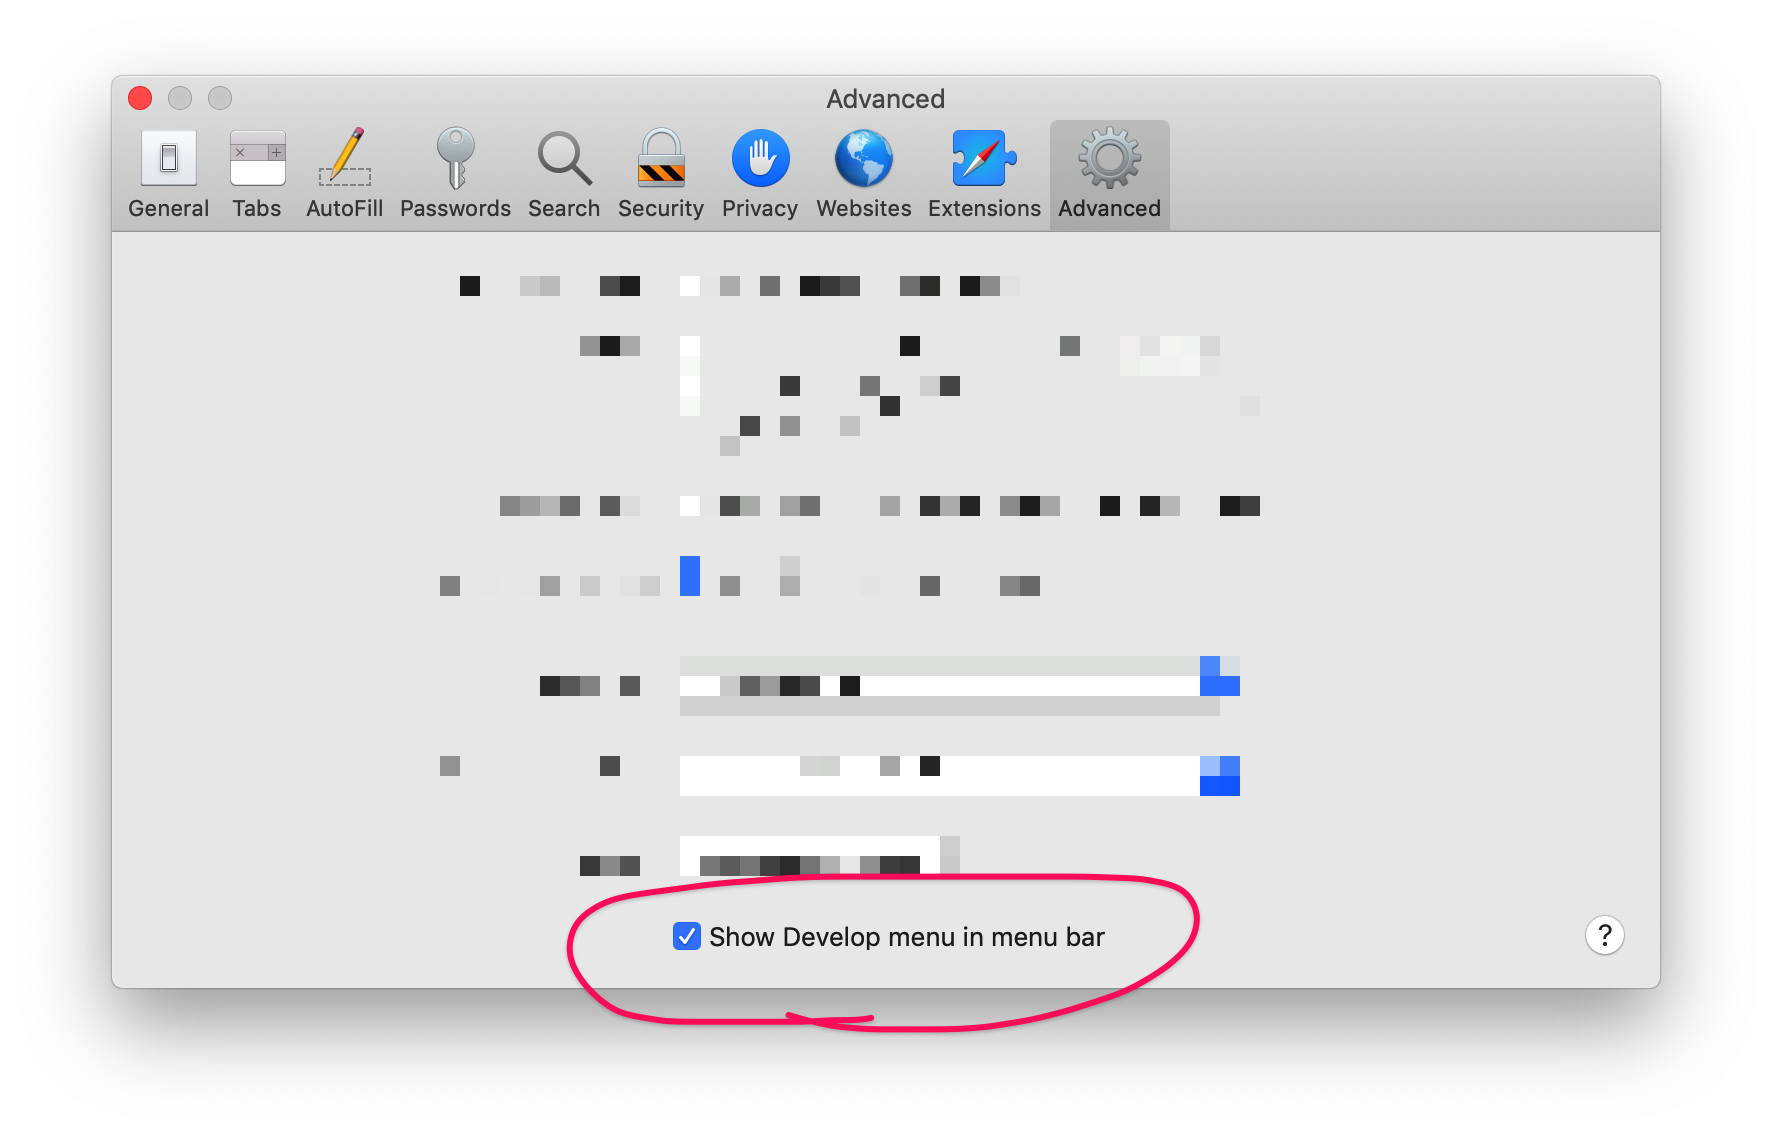
- On your Mac: open Safari's preferences (Safari › Preferences › Advanced) and check the box at the bottom to enable the Develop menu.
Connect and Inspect
Connect your iPhone to your computer with the Lightning cable — this step is easy to forget — and unlock the phone. After any iTunes prompts appear, you're ready.
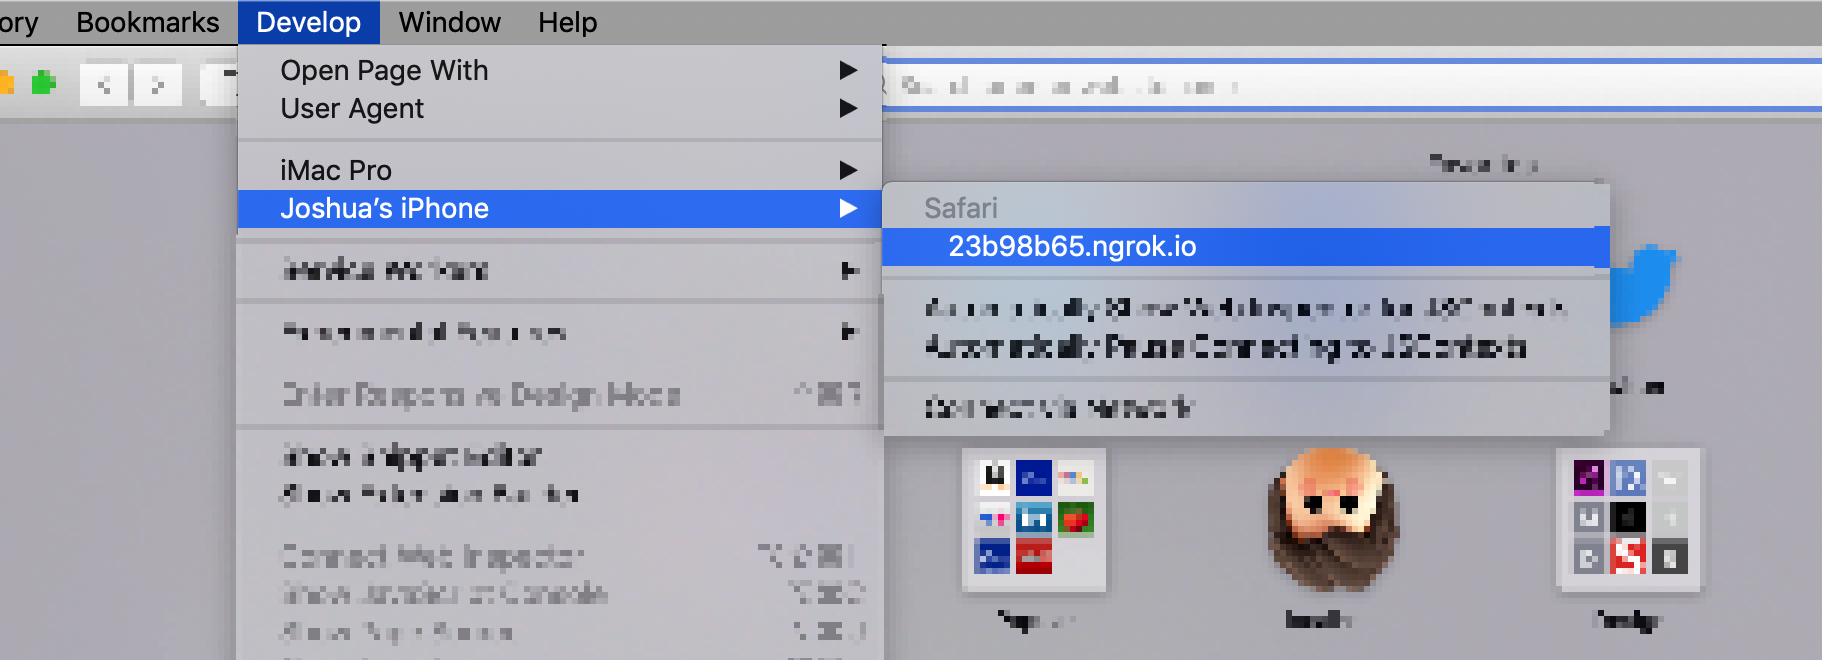
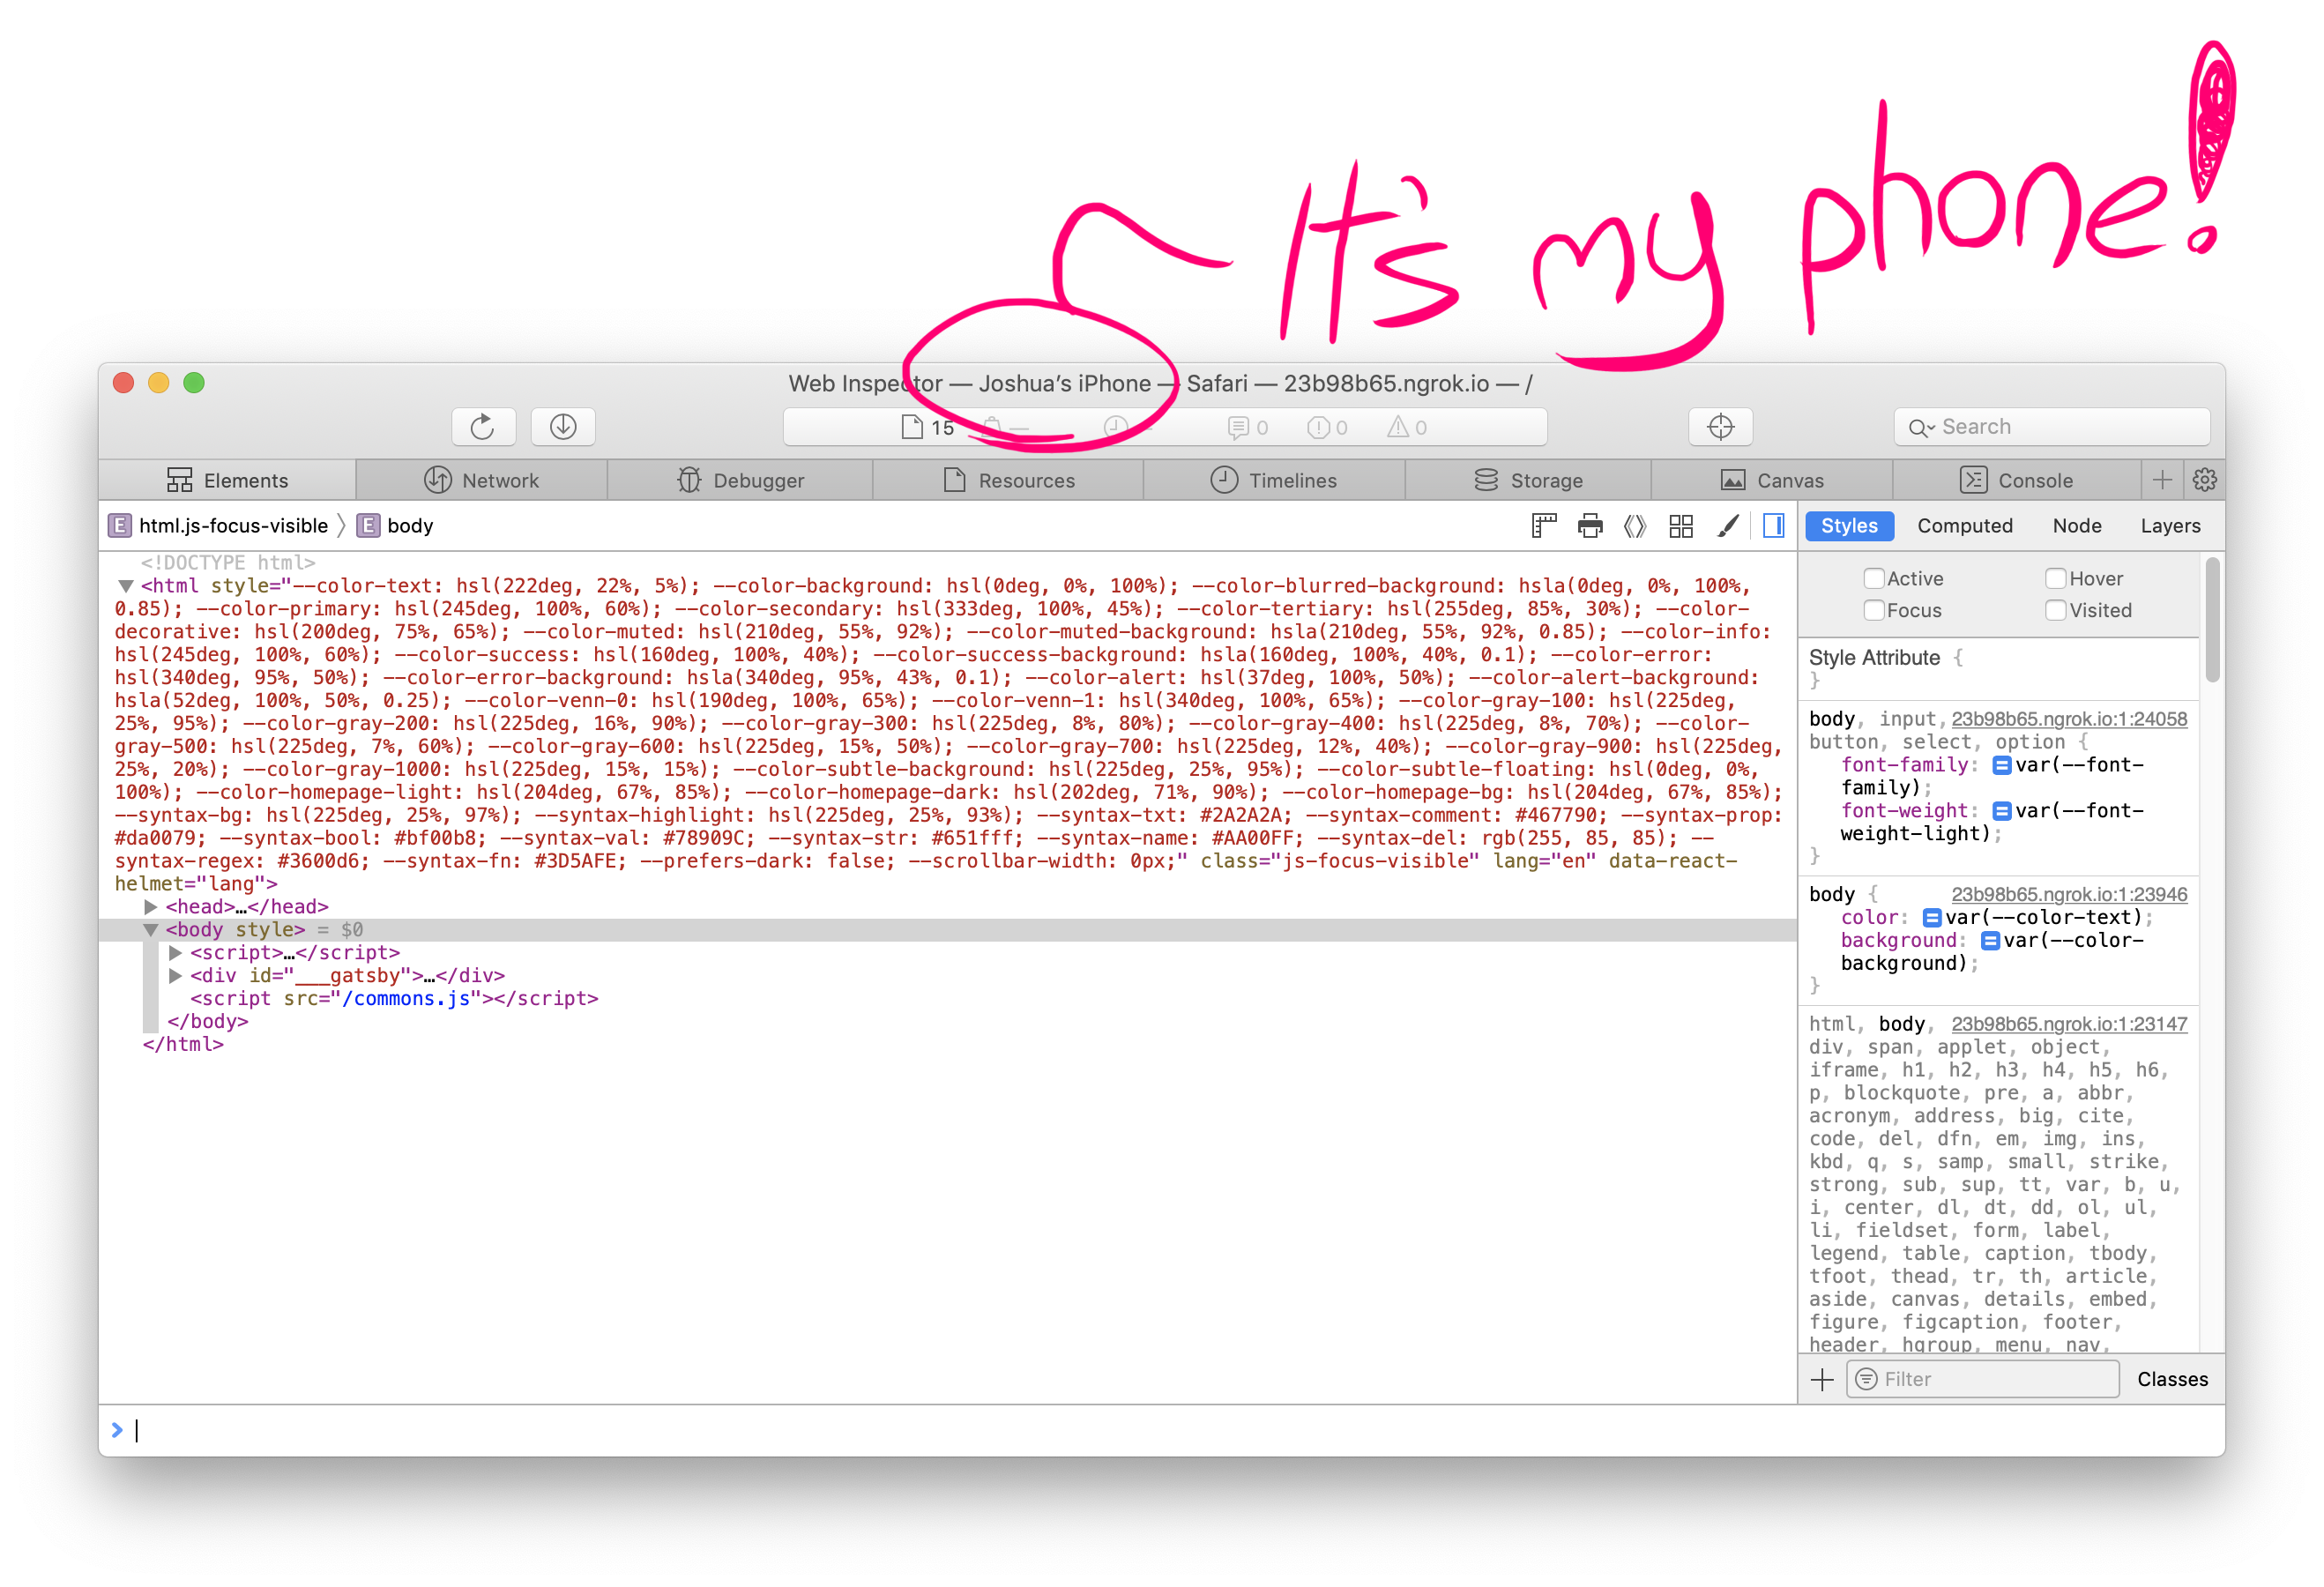
With your ngrok URL loaded in Safari on the iPhone, open the Develop menu on your Mac and select Develop › Your iPhone Name › abc123.ngrok.io. This opens the remote Web Inspector connected to the page on your phone.
A Repeatable Testing Habit
The recurring workflow is short:
- Plug your iPhone into your computer.
- Run
ngrok http PORT. - Visit the generated URL on your iPhone.
- Open the tools via Develop › Phone Name › abc123.ngrok.io.
Testing on real hardware early and often becomes much less of a chore once the setup is done.
A Simulator Alternative
The iOS Simulator that ships with Xcode can also serve this purpose, and debugging via desktop Safari's devtools works there as well. Its advantages include not needing a physical iPhone, easy testing across iPad and various iPhone screen sizes, and avoiding the cable/ngrok setup. The drawbacks are that it lacks true device characteristics — touch interaction and on-device performance are not accurately represented — so some issues may only surface on actual hardware. Both tools are worth keeping around for different testing scenarios.