

ChatOps as the on-call multiplier
GitHub’s on-call engineers don’t work alone. Much of their incident response runs through Hubot, the chatbot that powers the company’s ChatOps workflow. When a ChatOps command runs from Slack, teammates can see both the invocation and its output, turning individual troubleshooting into real-time collaboration. For incidents, where the goal is minimizing customer disruption and finding root cause fast, that visibility matters.
Service health is not delegated to a separate ops team at GitHub. The engineers who build a service also keep it running. For GitHub Actions, that means on-call shifts where engineers triage support tickets, investigate alerts, and occasionally fail over databases. The tools they reach for are increasingly Hubot commands rather than raw queries or sprawling runbooks.
Turning common questions into one-liners
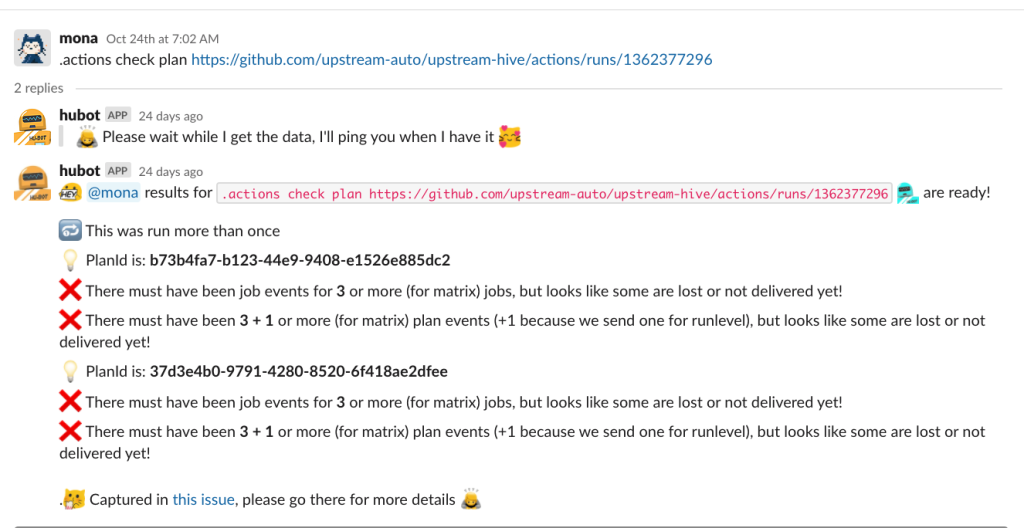
Consider a support ticket about failing Actions runs in a private repository. Without customer consent, the on-call engineer can’t access the logs directly. The privacy boundary is real, and provisioning temporary access just to peek at a run is slow. Instead, the engineer asks Hubot about the run URL. Behind the scenes, Hubot fans out parallel queries to Kusto, GitHub’s log aggregation layer, runs the analysis, and returns a diagnosis. The engineer gets the answer without needing extra permissions or writing a single query.
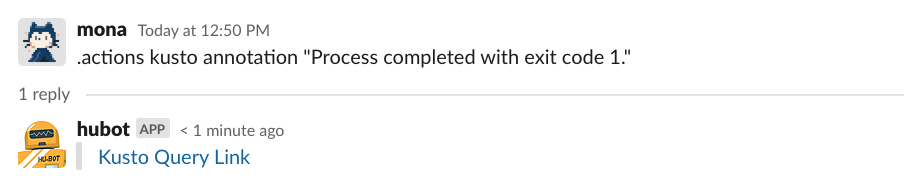
The same pattern applies to error visibility. When Actions runs start failing, telemetry lands in Splunk and Azure Data Explorer (queried via Kusto Query Language). Rather than constructing the Kusto query from scratch, an on-call engineer can invoke a ChatOps command that returns a link to the pre-built query for the relevant error. Investigation starts immediately instead of after the query is written and debugged.
These workflows exist because on-call rotations are repetitive. The same classes of problems surface, and each has a known set of investigation and remediation steps. GitHub codifies those steps into ChatOps commands so the next engineer encountering the issue starts from a proven baseline.
Searching the documentation haystack
GitHub invests heavily in internal documentation: architecture decision records (ADRs), repository content, and GitHub Issues all hold operational knowledge. But that knowledge is only useful if it can be found under time pressure. A high-severity incident is not the moment to browse across repositories hoping to stumble on the right issue.
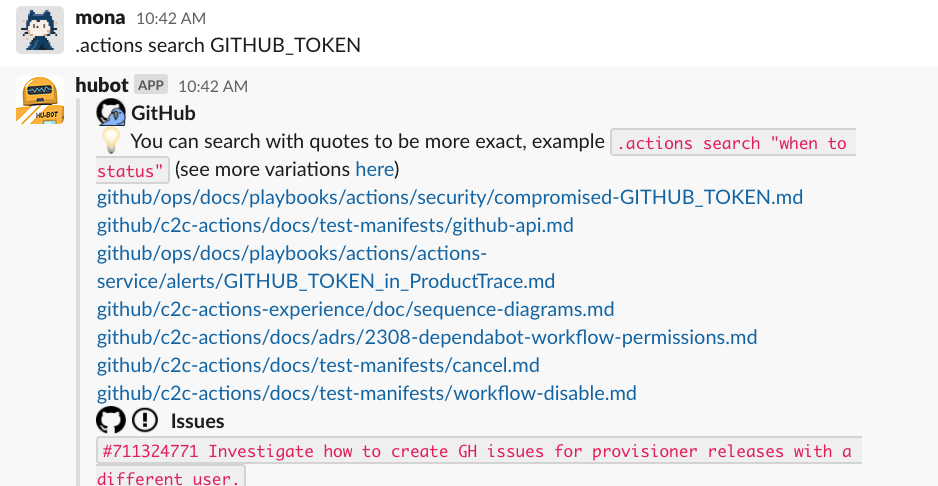
A ChatOps command that searches only Actions-relevant repositories narrows the problem. The on-call engineer gets pointed at the right documentation instead of a broad codebase search.
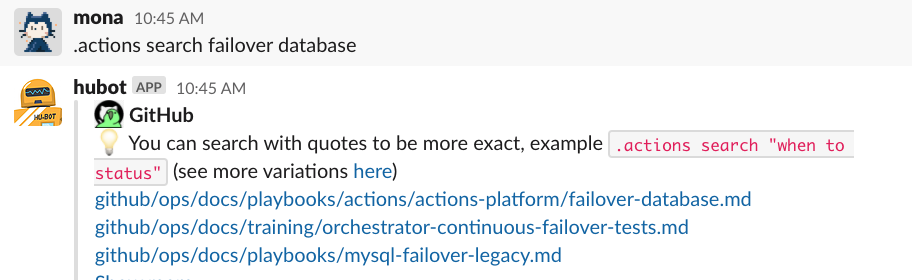
The same search capability rescues the engineer when automated database failover doesn’t trigger and manual intervention is required. The command .actions search failover database pulls up the playbook—the set of manual steps for troubleshooting a production issue—without a scavenger hunt.
From static playbooks to interactive commands
GitHub’s SLOs are behavior-based rather than resource-based, but resource alerts still earn their keep. A run-start-delay SLO signal paired with high CPU on a database can be a fast track to root cause. The problem is that the corresponding playbook may be long, and during an active incident there is no time to read through every branch of investigation logic.
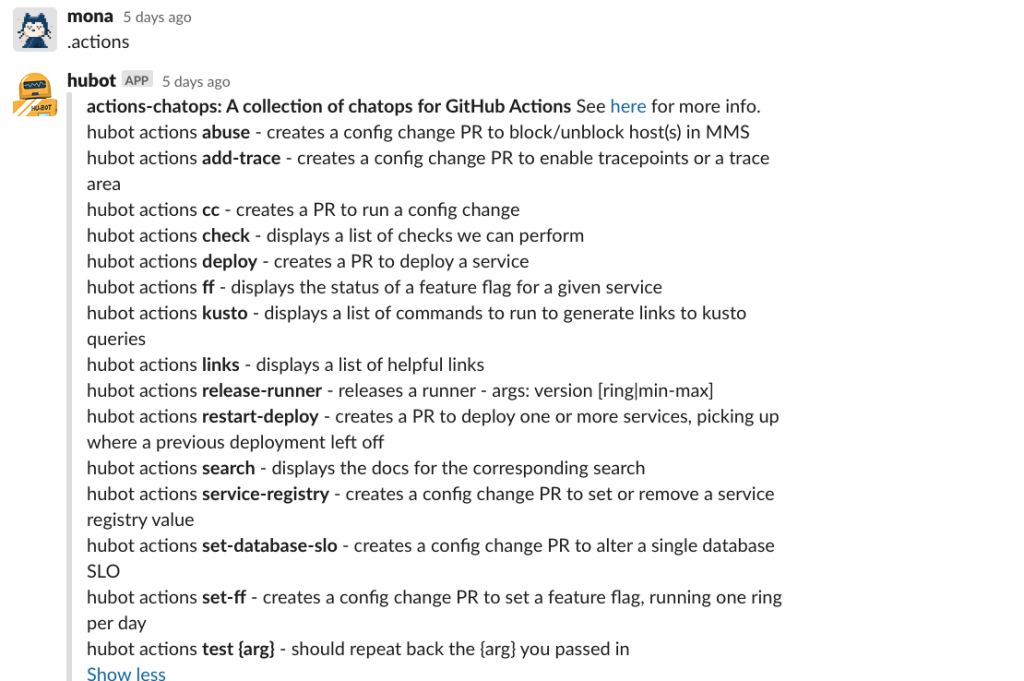
When the on-call engineer is paged for an unhealthy database, the first move is to see what Hubot offers. Invoking .actions lists the available commands.
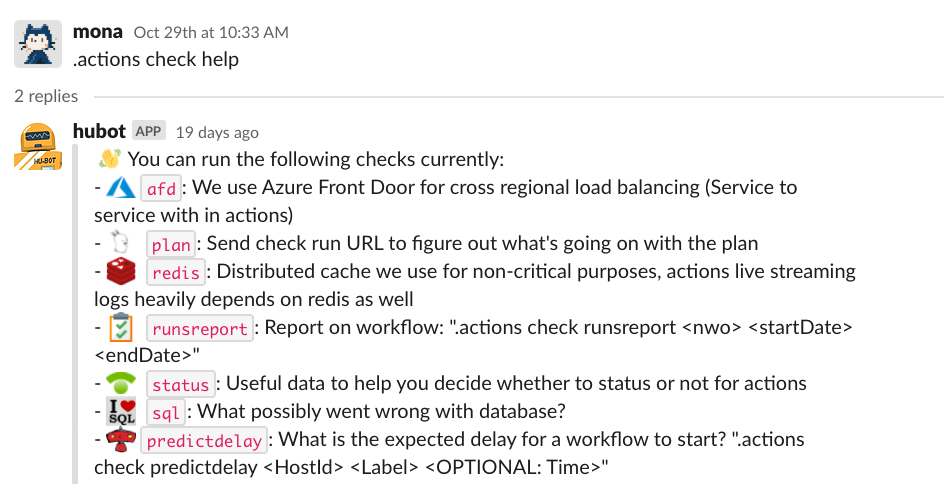
The .actions check command looks relevant, and .actions check help reveals the subcommands.
The sql subcommand is exactly what’s needed for the database in question:
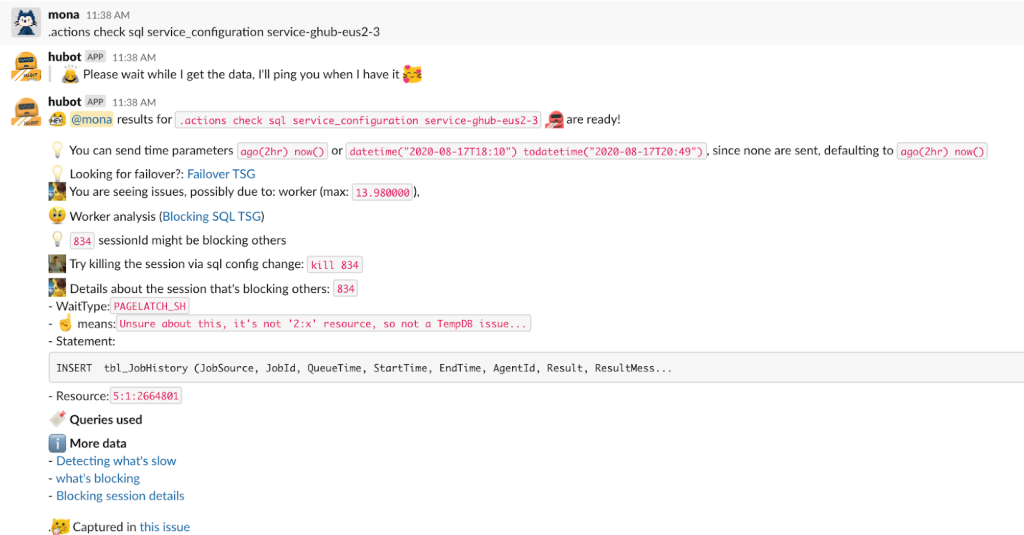
The root cause surfaces quickly: worker percentage is high, with a single session blocking others while waiting on PAGELATCH_SH. Hubot’s analysis is anomaly-based—it compares CPU, memory, and worker percentage metrics against historical data using interquartile range (IQR) to identify outliers. Once the anomalous resource is found, Hubot digs in further, suggests mitigation steps, and links all relevant queries and resources for follow-up.
That is the direction GitHub’s incident response is moving: away from static playbooks and toward living ChatOps. Subject matter experts codify their debugging practice into commands that any on-call engineer can run. The engineer gets a head start, can take the analysis further, and can contribute improvements back to the command itself. Each incident makes the tooling better for the next one.
A living incident playbook
Build ChatOps from the workflows your domain experts repeat, and the payoff compounds. Engineers use the commands, find gaps, and iterate. The result is a living playbook that accelerates both investigation and remediation. The same tooling extends beyond root cause analysis to deployments, mitigations, VM recycling, and database upgrades. By moving expertise into ChatOps, GitHub shortens the path from alert to mitigation and gives on-call engineers a much better quality of life.


