Debugging the Unreproducible Crash
Imagine deploying a code change, then getting an alert that the service is crashing on 0.1 percent of servers. At a large company, that fraction can translate into thousands of machines. The problem: you can’t reproduce the failure locally. Hours of digging through logs lead nowhere.
Reverse debugging—recording a program’s execution and rewinding it—has been possible for years, but the overhead makes it impractical for production workloads at scale. To solve this, we built a system that traces CPU activity on live servers, captures the history of a crashing process, and then reconstructs that history for analysis in the LLDB debugger. The result is a human-readable view of exactly what happened before the crash, without needing to rerun the program.
Capturing Traces Without Slowing Production
Continuous Collection with Circular Buffers
Since crashes are unpredictable, we continuously record Intel Processor Trace (Intel PT) data for every running process. To keep memory usage bounded, the trace lives in a circular buffer, where older data is overwritten by newer data.
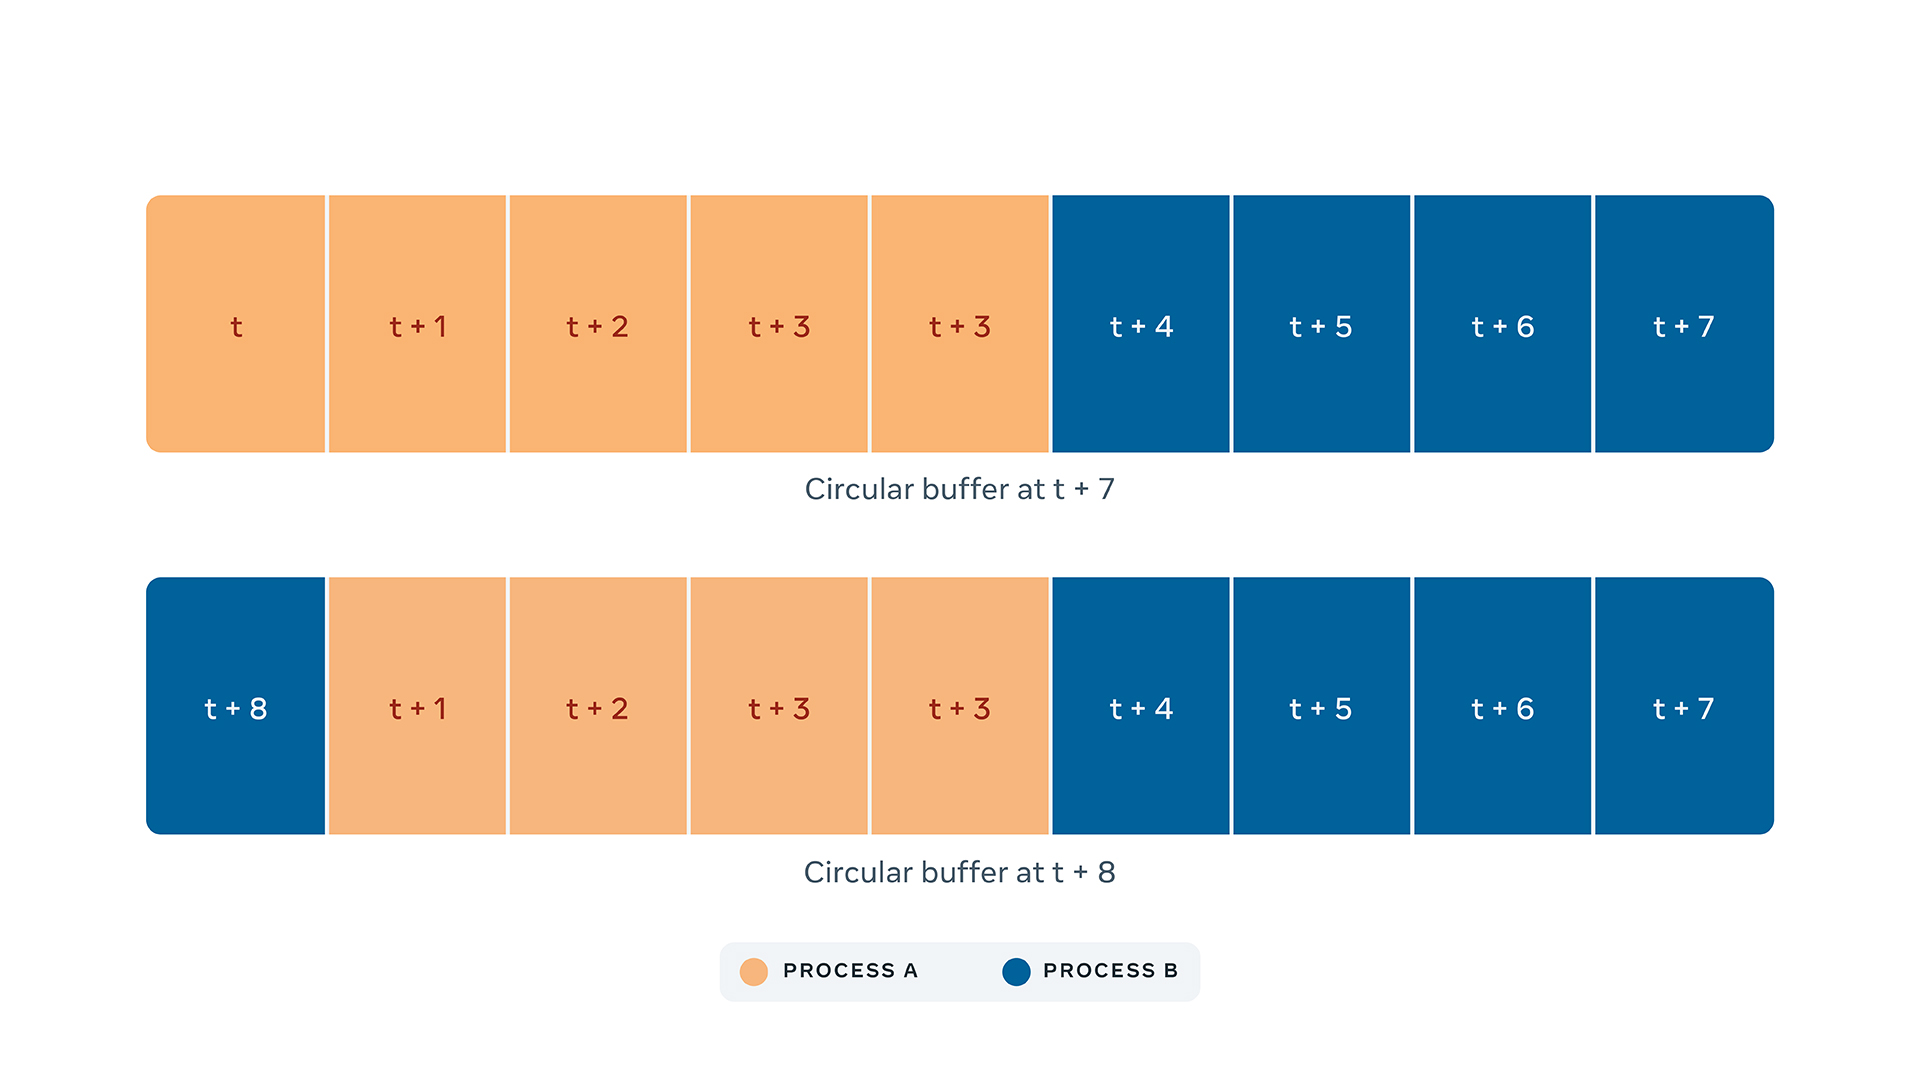
The challenge is timing. On large servers—like those used for AI training—Intel PT can generate hundreds of megabytes per second, even compressed. When a process crashes, we have only milliseconds to copy the buffer before new data from other processes overwrites the crash-relevant portion.
We solved this with an eBPF kernel probe that triggers on crash events and notifies our collector almost instantly. This was the fastest approach we tested. Crashes can leave a machine in an unstable state, so we store the raw trace and the corresponding binary in our data centers for later analysis on a separate machine.
Reconstructing Instructions from Raw Traces
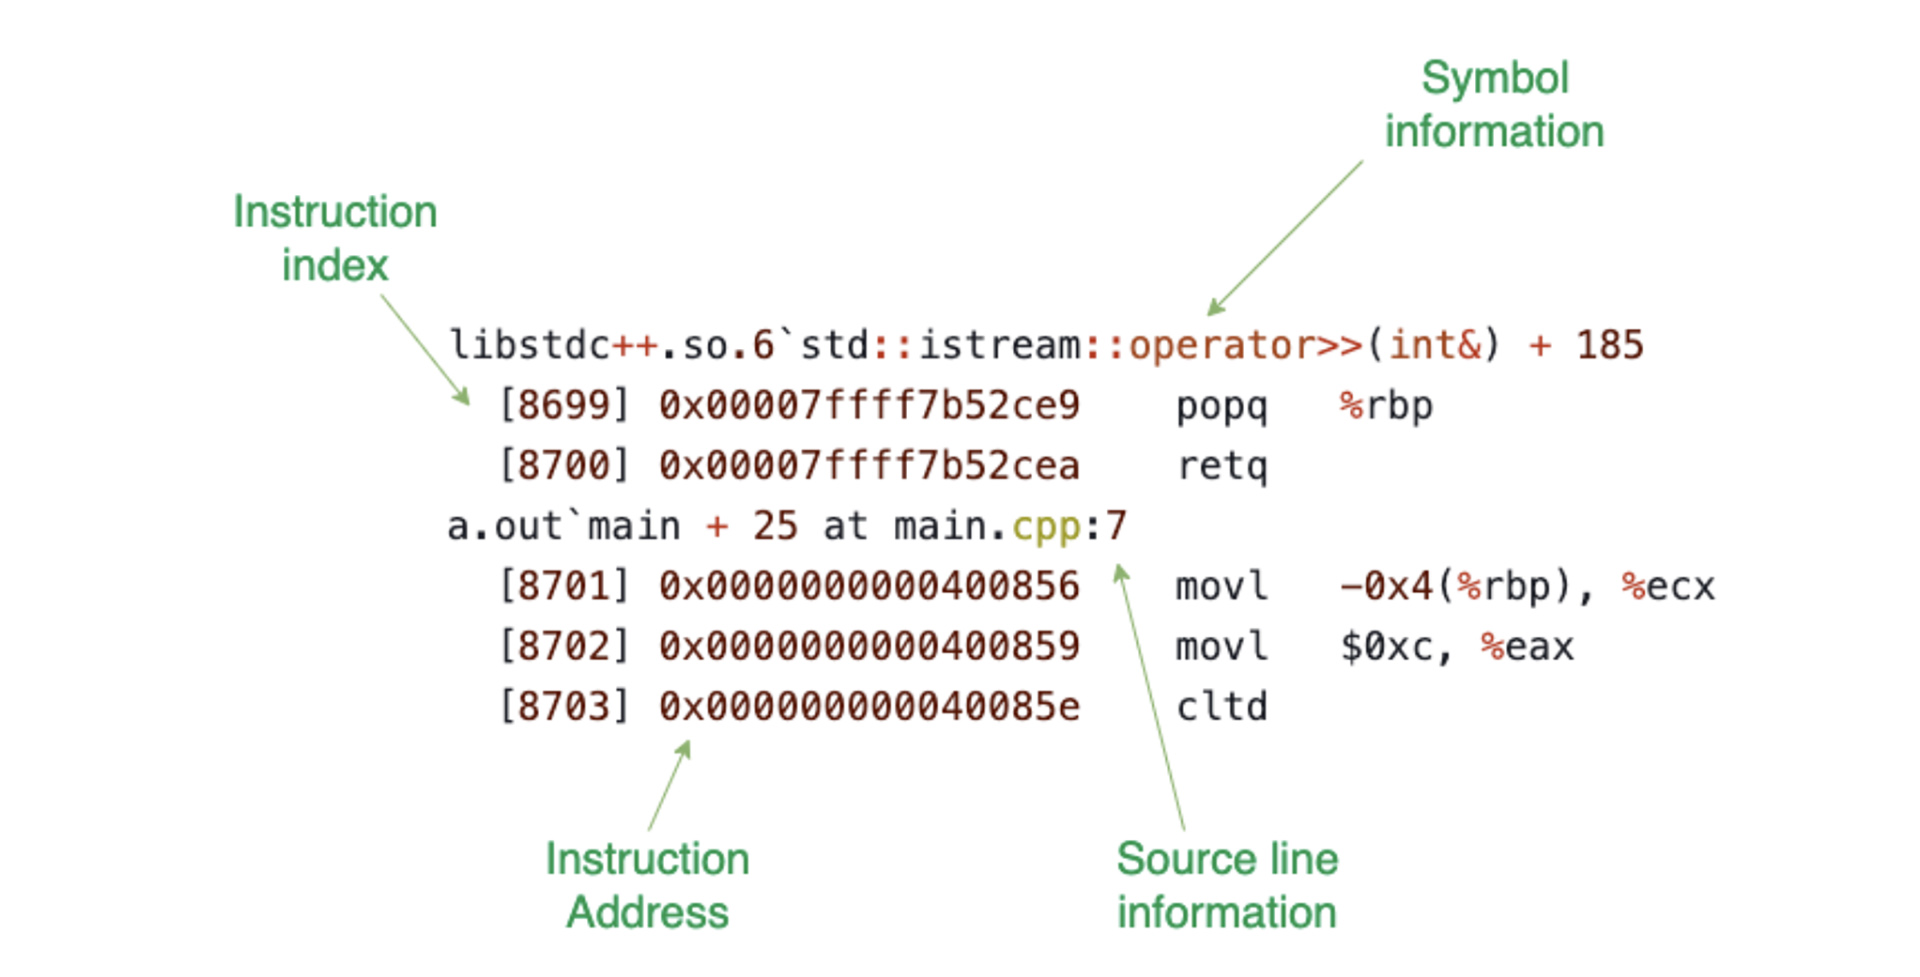
A raw Intel PT trace is just a stream of bits—useless to an engineer without context. To make it meaningful, we built a component inside LLDB that decodes the trace into individual instructions and maps them to source lines and function names. This plugin is now open source in the LLVM project.
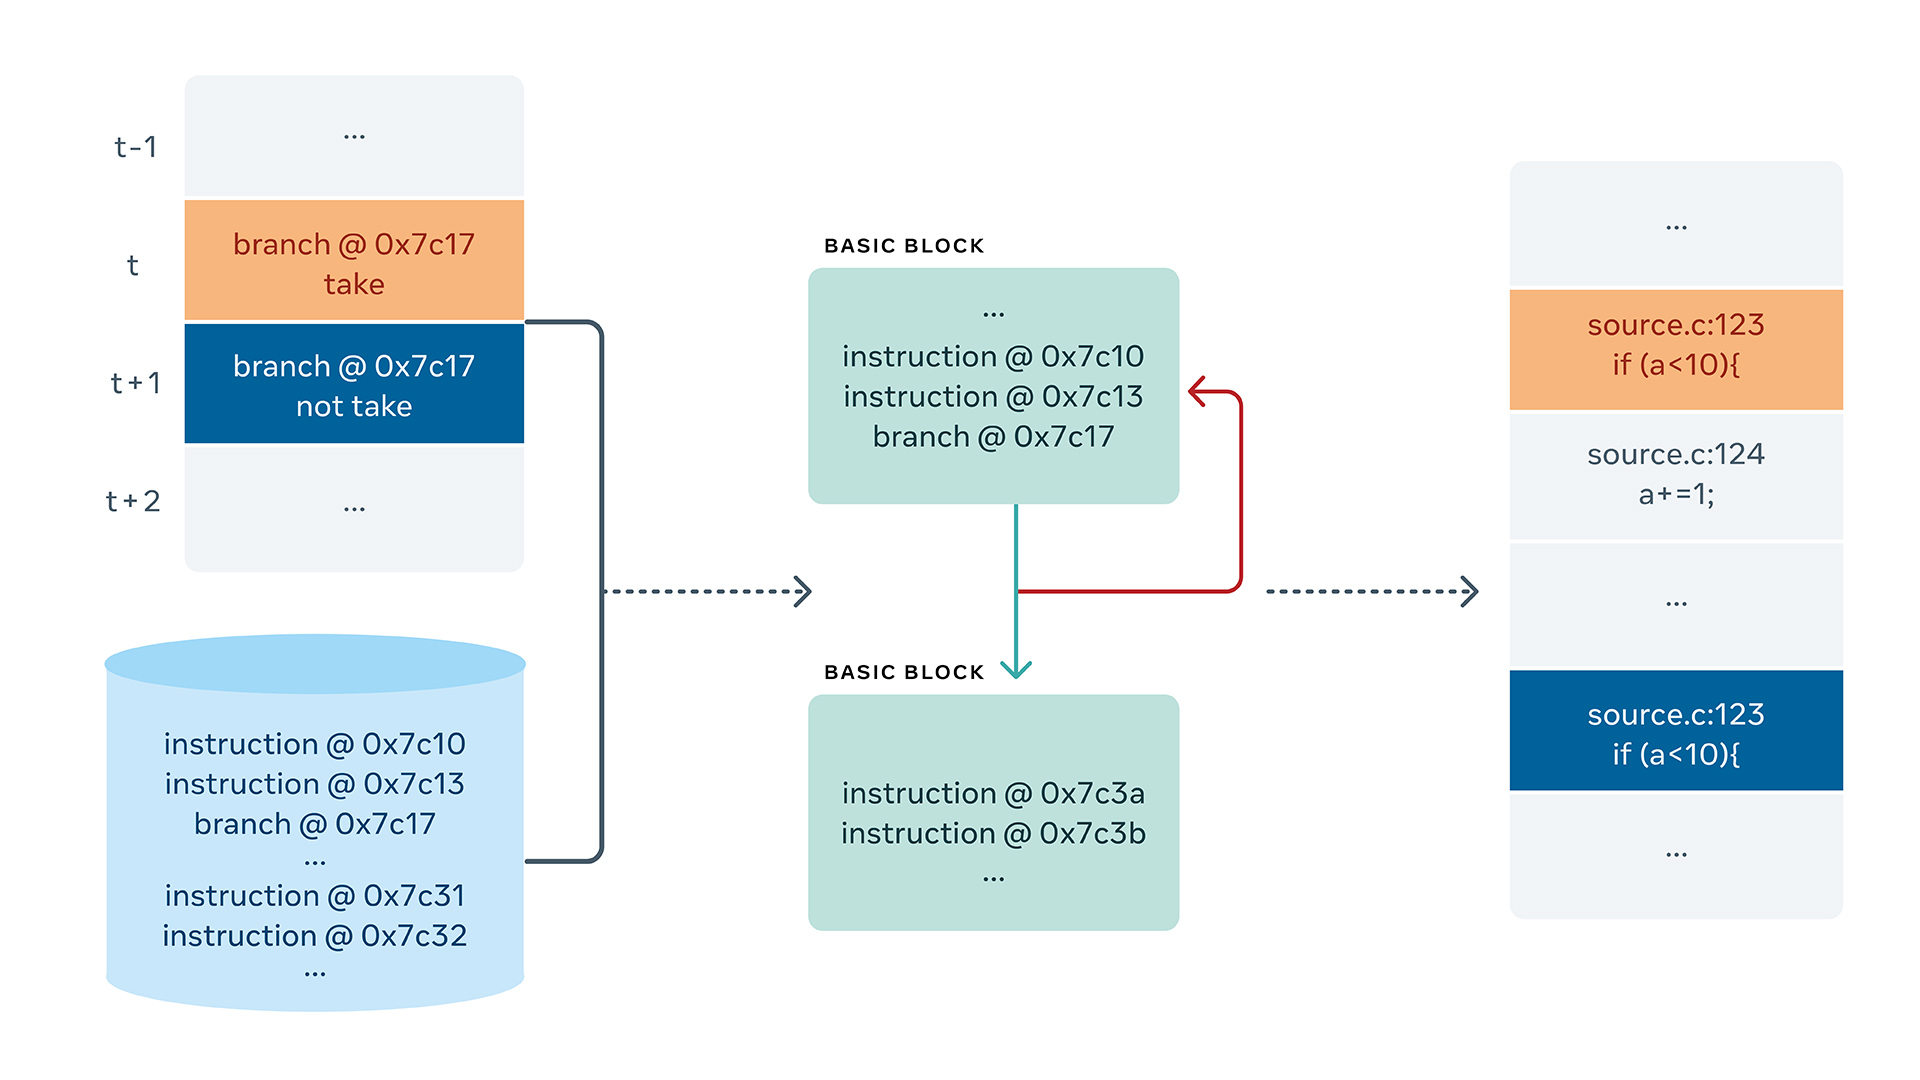
With this decoding step, a raw trace file is transformed into a structured, symbolicated instruction stream.
Rebuilding the Call History
Symbolication is only the first layer. The next step is reconstructing the function call sequence. Our algorithm walks through the decoded instructions and builds a tree of function calls—which function invoked which, and when. This works even when the trace starts mid-execution rather than at program entry.
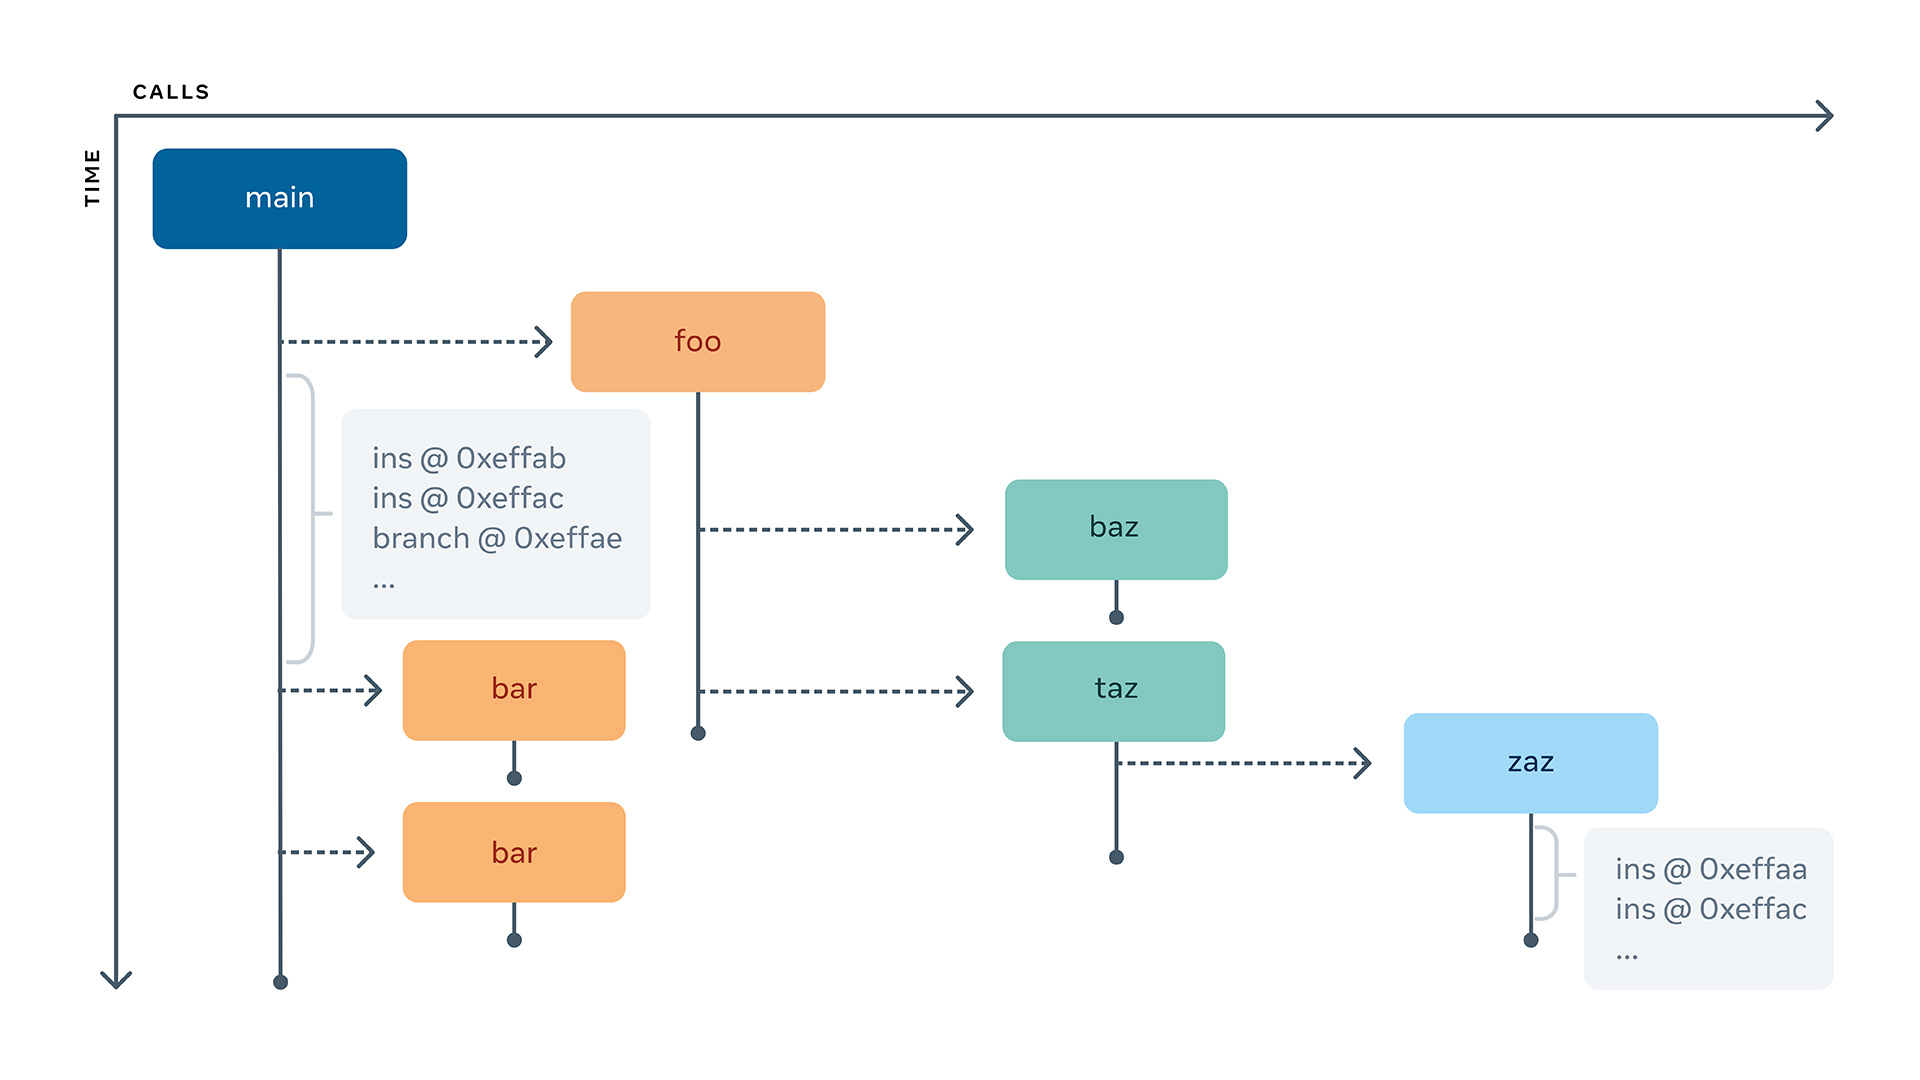
This call tree makes common debugging questions fast to answer. A stack trace at any historical point, for instance, is just a walk up the tree. More subtle is figuring out where a reverse-step-over should stop. Consider a line of code with an if statement: stepping backward over the line should land you at the previous executed line, but only if you skip over any function calls made on that line.
A naive approach scans every instruction in history until it finds a matching source line—wasteful when a function like foo contains millions of instructions. Traversing the call tree instead of the instruction stream makes the operation nearly trivial.

Breakpoints work too. If you’re mid-session and want to jump back in time to the most recent call to function_a, you can set a breakpoint and let the debugger rewind you there:
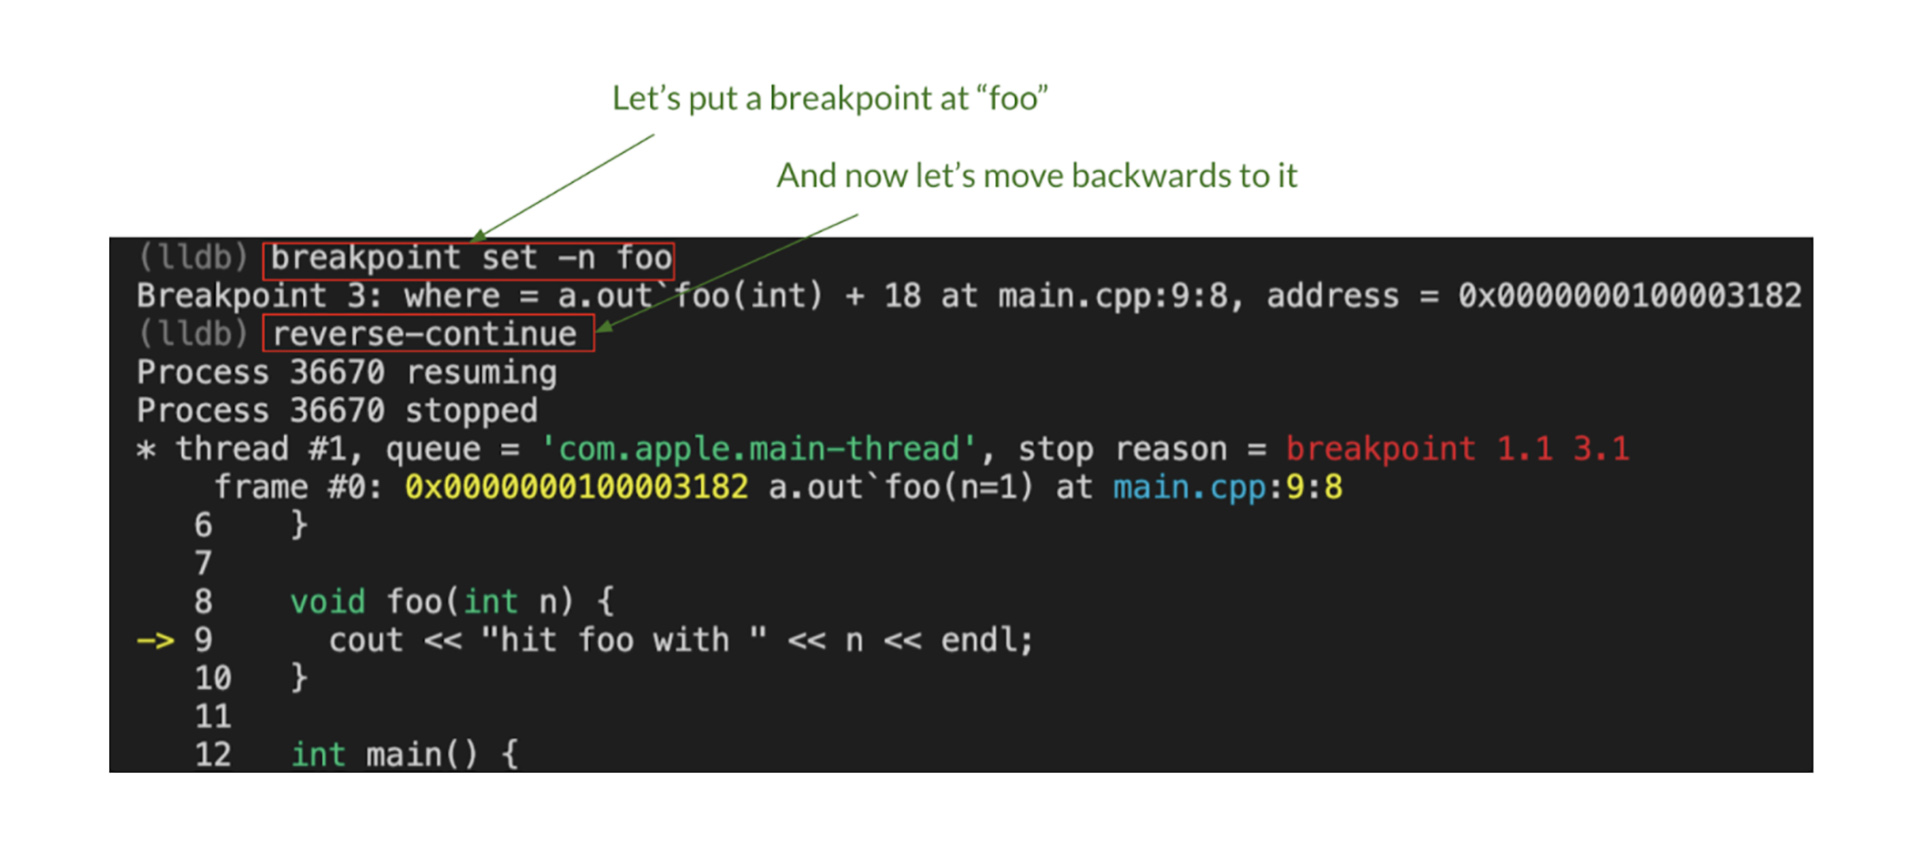
We also plan to integrate this flow into VSCode for a full visual reverse-debugging experience.
Latency Analysis with Precise Timing
Execution traces contain richer control-flow data than sampled call stacks, and our traces carry high-resolution timestamps. That opens a use case beyond crash debugging: latency analysis.
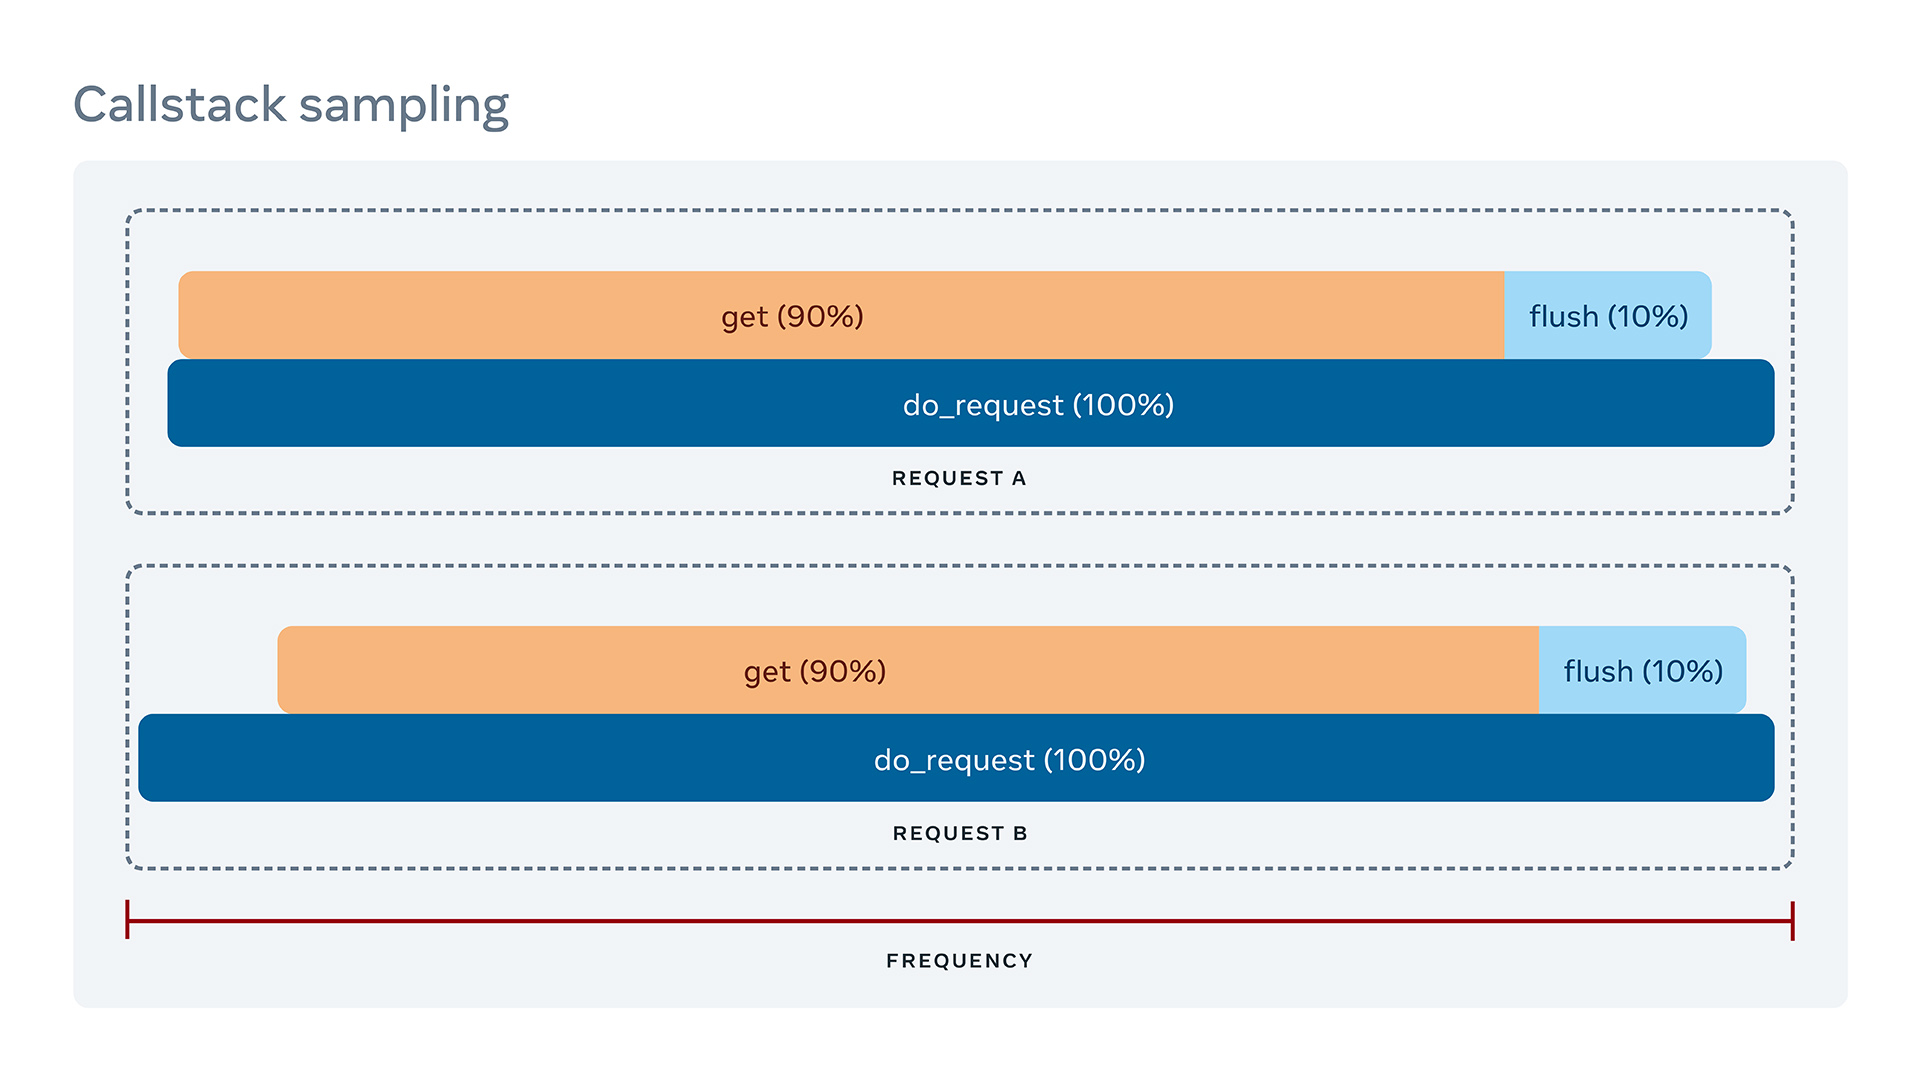
Consider a service that fetches data through an internal cache. Occasionally the cache flushes, and the next fetch is slow. Standard profile data shows two types of requests with similar aggregated call stacks—indistinguishable in a flame graph. A trace, however, reveals the order of operations. In one path, request B flushes the cache before fetching; in the other, request A does not.
A single trace makes the difference obvious:
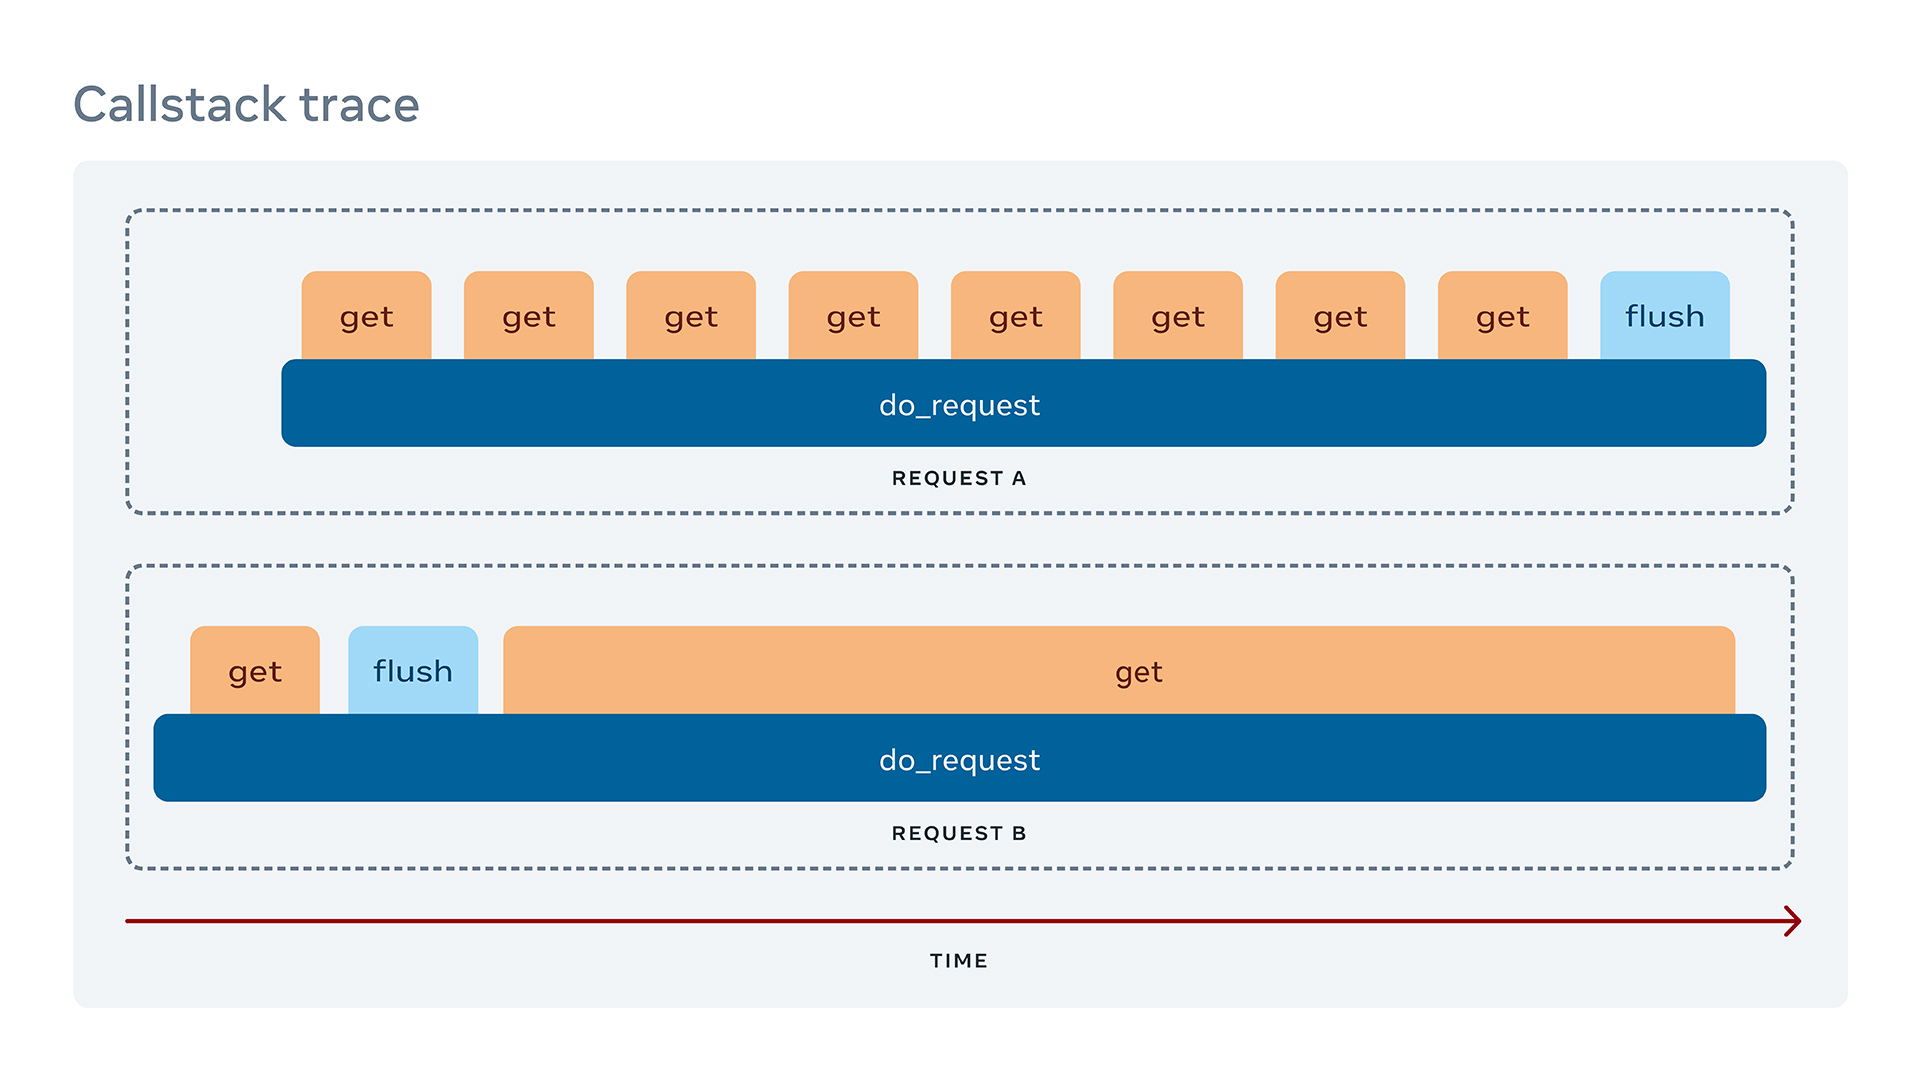
While a debugger handles step-wise movement through history, a visual overview helps spot patterns. We are building tools in our performance analysis platform, Tracery, that combine Intel PT trace data with the symbolication output from LLDB. The goal is to give developers a zoomable view of execution paths and timings, letting them glide from high-level call graphs down to individual instructions.
With this system, the original scenario changes: the crash alert comes with a button that opens the failed run in a reverse debugger. You rewind through the history, spot the function call that shouldn’t have happened, fix it in minutes, and move on.


