A New Lens on Server Fleet Efficiency
Meta has maintained net zero emissions in its own operations and matched 100% of its electricity use with renewable energy since 2020. But the company's decarbonization goals extend beyond its data centers and offices. To align with the Paris Agreement, Meta has set a 2030 target for net zero emissions across its entire value chain, which includes supply chain emissions from server component manufacturing and other indirect sources.
Meta's Net Zero Program rests on three pillars: understanding emissions, reducing them, and removing what remains. The first pillar has driven work on improving the granularity, accuracy, and near real-time measurement of greenhouse gas data. That work now extends to a new initiative called RETINAS (Real Time Infrastructure Accounting for Sustainability), which studies how server reliability, performance, and operational optimization affect Meta's Scope 3 emissions.
A key output is a new internal metric: real-time server fleet utilization effectiveness. It measures how effectively embodied carbon—the emissions from manufacturing, assembly, and transportation of servers and components—is being used across Meta's large-scale data center fleet. The goal is to fold embodied carbon into the same infrastructure metrics that already guide fleet decisions, so operational teams can weigh environmental impact alongside power, performance, and total cost of ownership.
Why Current Accounting Falls Short
Meta has reported Scope 1 and 2 emissions since 2011, began reporting select Scope 3 categories in 2017, and since 2019 has published annually on all relevant categories defined by the Greenhouse Gas Protocol. Data center servers and their components represent a significant share of the company's Scope 3 footprint. Much of the reduction strategy has centered on circularity: extending server life, reusing components, and improving reliability to defer new purchases.
But standard carbon accounting treats embodied emissions statically. When a server is purchased, the full upstream emissions from supply chain, manufacturing, and logistics are attributed to that year. Benefits from circularity only appear when future purchases are deferred. That does not give operational teams real-time visibility into how usage patterns or expected server life changes affect Scope 3 emissions.
Meta saw a need for internal metrics that capture efficiency, utilization, and useful life in a way that can inform fleet management decisions on an ongoing basis, rather than only at annual reporting time.
The Metric: Depreciation Meets Utilization
RETINAS introduces a standardized, fleet-wide metric for any given resource—a server, a rack—that measures the utilization of embodied carbon:

Where:


The approach borrows the finance and accounting concept of depreciation and applies it to server reliability, efficiency, and useful life. Depreciation lets Meta track acquisition and disposition of server resources at fleet scale and report on that continuously, rather than as a one-time annual charge.
Existing utilization metrics like power usage effectiveness (PUE) and hardware usage effectiveness (HUE) look at power consumption at the data center and server level, respectively. Combining depreciated Scope 3 emissions with those utilization metrics creates a standardized measurement that can be compared alongside other fleet health indicators over any defined period.
Static vs. Dynamic Accounting
Consider an example set of servers purchased in 2023 with 1000 tons of CO2e embodied emissions. Under current static accounting:
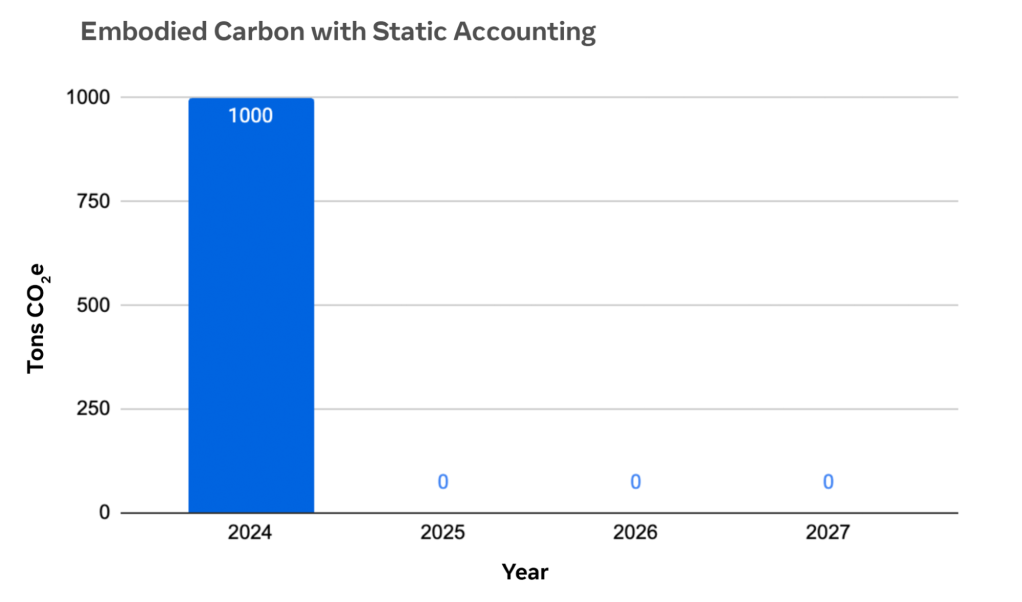
There is no representation of useful life in this picture. Change the expected useful life (UL) from four years to five years, and the metric does not move.
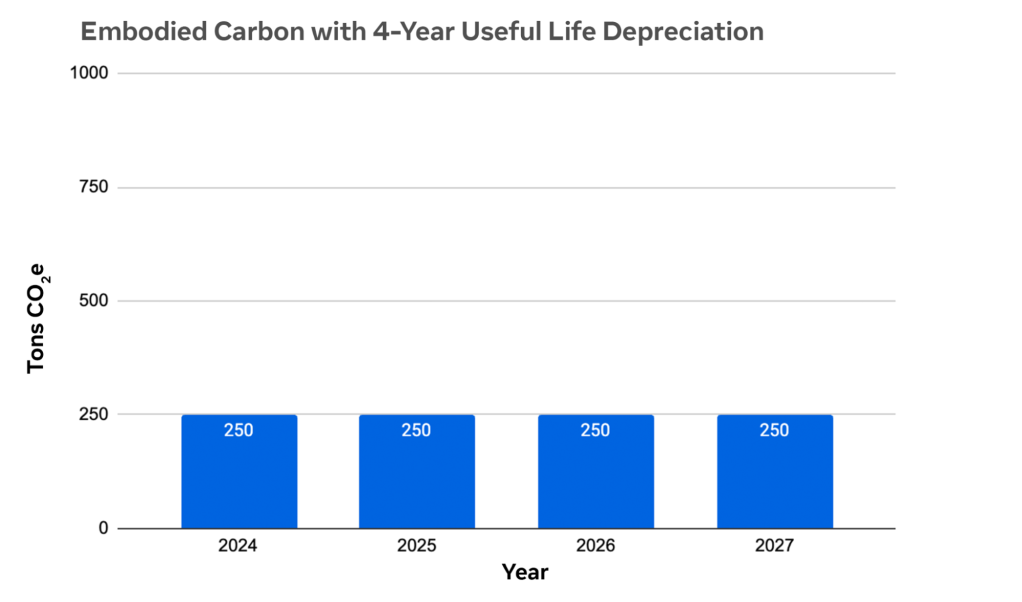
Using depreciation over a four-year useful life horizon, the same purchase would look different:
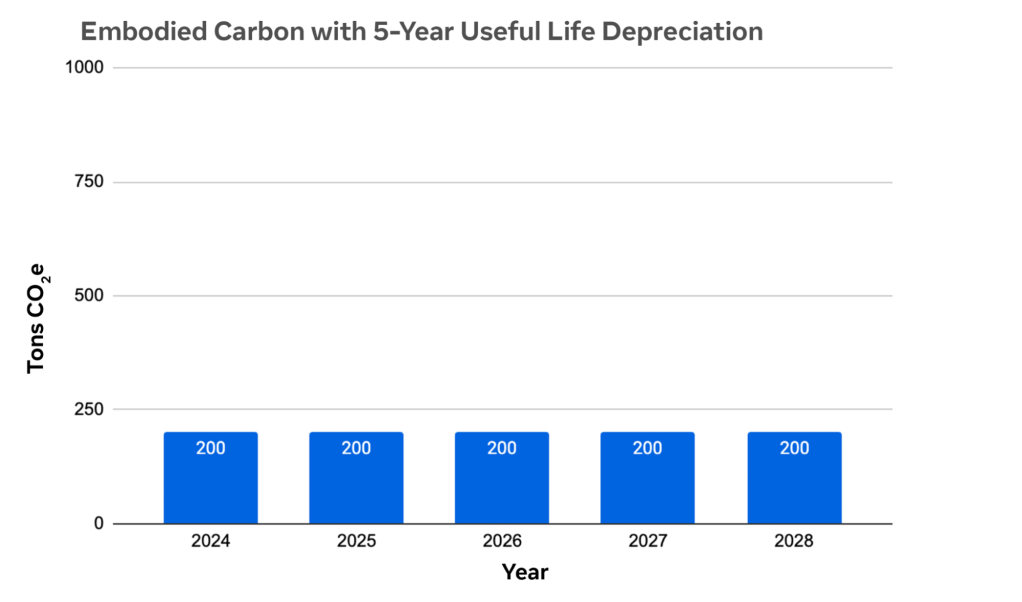
If the useful life is extended from four years to five years, that change becomes visible in the depreciation metric:
Combining Depreciation with Utilization Effectiveness
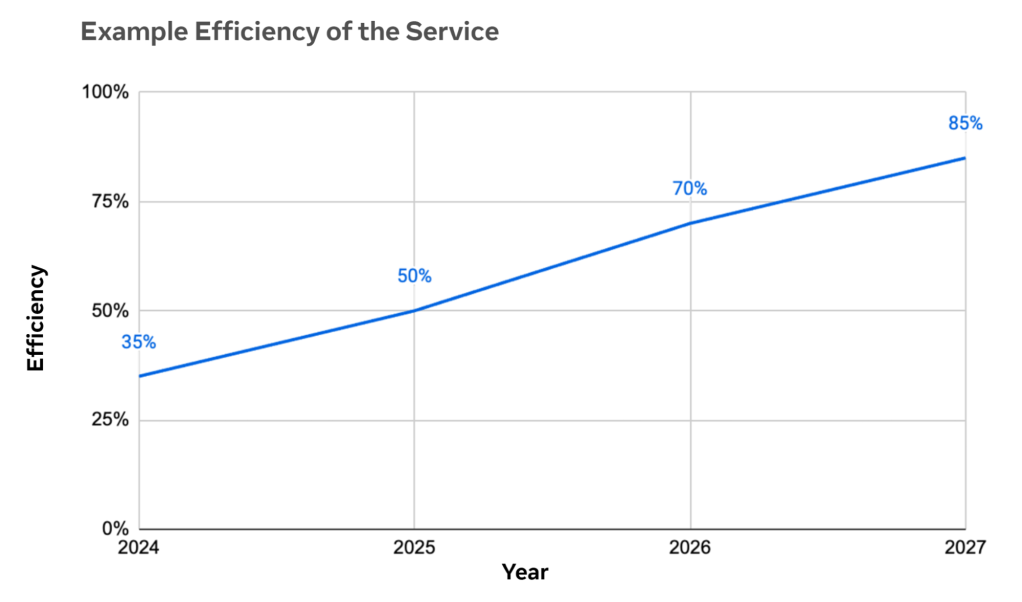
Large-scale infrastructure has multiple layers of availability—hardware, firmware, kernel, operating system, application. Each layer has efficiency metrics tied to capacity and effective resource use. The graph below shows an example of how utilization effectiveness can vary over time due to application-level improvements:
Utilization effectiveness is defined as:
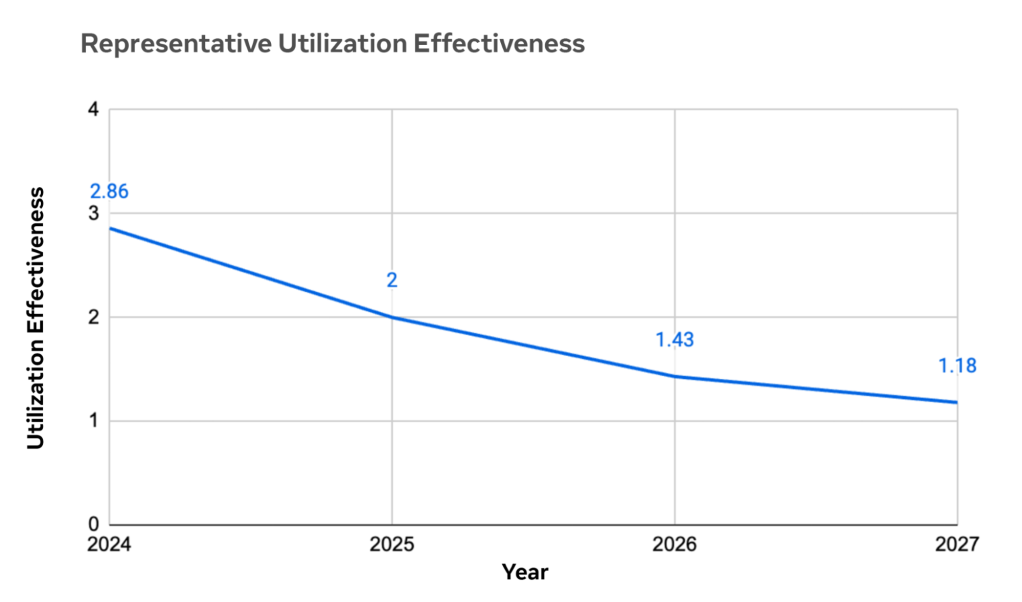
By combining depreciation of embodied emissions per unit time with utilization effectiveness over that same period, RETINAS arrives at a near real-time measurement of server fleet utilization effectiveness of embodied carbon. The utilization effectiveness values in the chart are representative.
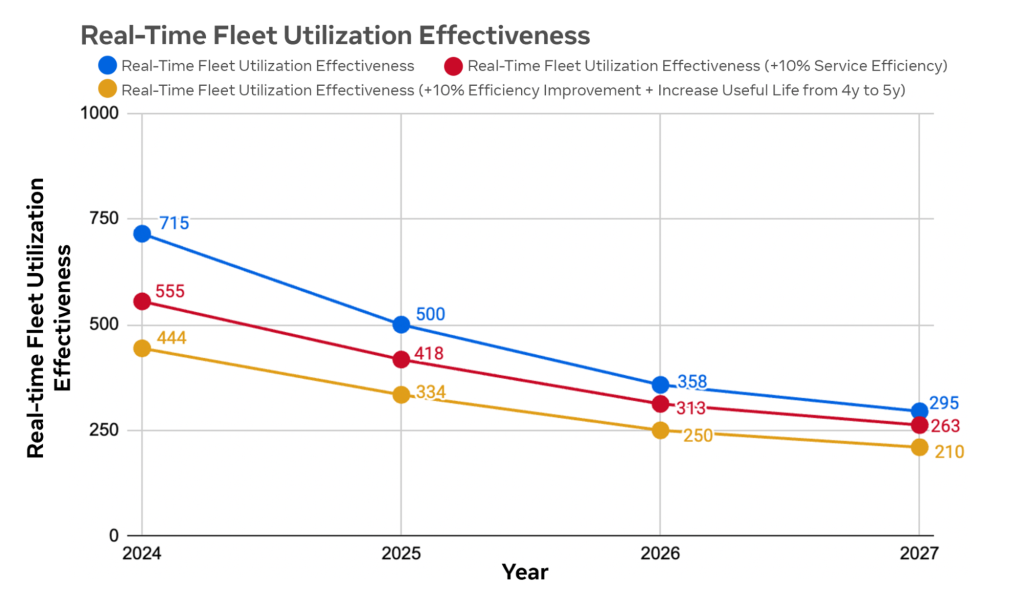
The goal is to consistently minimize the real-time server fleet utilization effectiveness. Utilization effectiveness should asymptotically approach 1 as available resources approach 100% utilization. Depreciating Scope 3 emissions over a longer useful life also pushes the metric down. Combining both effects gives a single basis for ranking different fleet initiatives—efficiency improvements, reliability work, component selection—against each other.
This comparison shows how the metric behaves under server life extension and efficiency improvements:
What the Metric Enables
The metric supports relative comparison of circularity strategies across the server fleet. It can be sliced horizontally, into any timescale from seconds to years, for fine-grained insights into a resource's embodied emissions attribution. It can also be sliced vertically, down to containers, production workloads, or application residencies for short durations, combining those with the associated resource availability.
Using the same example as above:
- Increasing server useful life from five years to seven years lowers the metric by 28% due to slower depreciation.
- Enabling component reuse, pursuing application efficiency improvements, or choosing server parts with lower emissions all contribute to the metric and enable cross-stack tradeoffs.
In this example, a single metric ties together different fleet operations toward a common goal of reducing embodied emissions. By integrating depreciation and utilization effectiveness into embodied carbon accounting, Meta's operational and fleet management teams can make data-driven decisions that address a meaningful portion of the company's Scope 3 footprint. The company is sharing these learnings with the expectation that the concepts will evolve through industry discussion—not as a replacement for global emissions accounting standards used in external reporting, but as an internal tool for driving decarbonization in real time.


