Quantifying AI model vulnerability to silent data corruptions
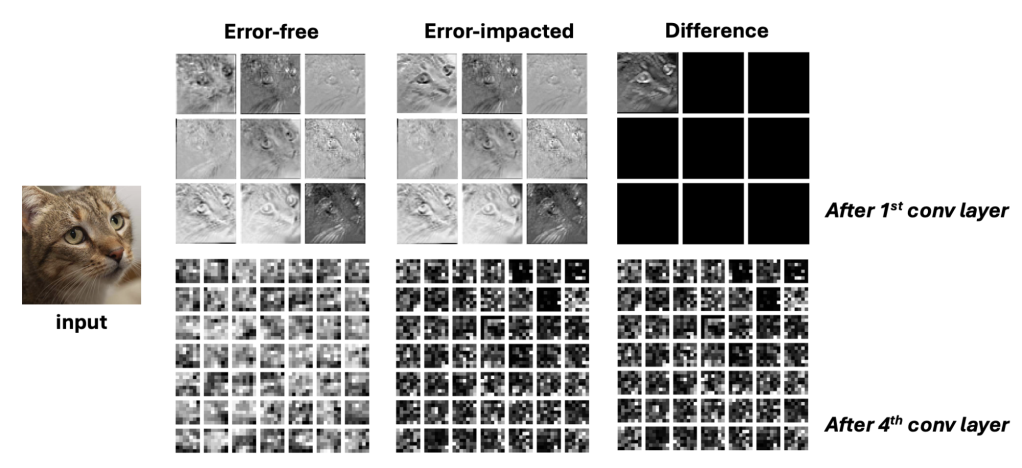
Hardware faults such as bit flips are an increasing concern for AI systems. Silent data corruptions (SDCs) occur when an undetected fault alters stored or processed data. In AI models, this manifests as corrupted parameters — with a single bit flip potentially changing model output entirely. During inference or serving, such corruption can degrade output quality for users.
To address two related questions — how vulnerable AI models are to parameter corruption, and which model components are most at risk — we introduced the parameter vulnerability factor (PVF). PVF provides a quantitative method for measuring the likelihood that a corrupted parameter produces an incorrect model output.
Defining parameter vulnerability factor
PVF borrows from the architectural vulnerability factor (AVF) concept used in computer architecture. It is defined as the probability that a corruption in a model parameter results in an incorrect output, derived statistically through fault injection (FI) experiments. The parameter in question can be scoped at different levels — an individual parameter or a group of them.
Quantitative, parameter-level assessment enables comparisons within and across models. Values can be tailored to a given model, task, or assumed hardware fault model. Since the underlying FI methodology stays the same, adapting PVF to different fault models only requires changing how faults are injected.
Beyond inference, PVF can extend to model training. Because training depends on iterative parameter updates, a corrupted parameter could disrupt convergence. Applying the PVF concept there means measuring the probability that a parameter corruption results in failure to converge.
Measuring PVF
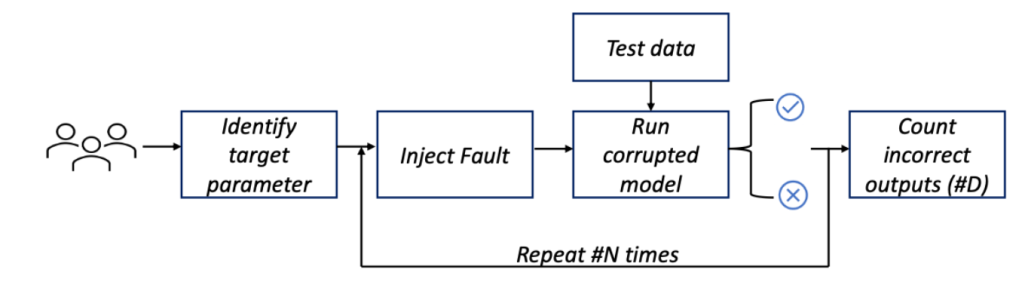
Like AVF, PVF requires enough FI experiments to yield statistically meaningful results. Figure 2 shows the full PVF computation flow.
In case studies using the open-source DLRM recommender model, model components displayed widely differing vulnerabilities. Under a single bit flip per inference, the embedding table exhibited relatively low PVF — because embedding tables are sparse and a corrupted parameter is only exercised when the corresponding sparse feature is activated. The top-MLP component, by contrast, showed 0.4% PVF under a single bit flip, meaning around four of every 1,000 inferences produced incorrect output.
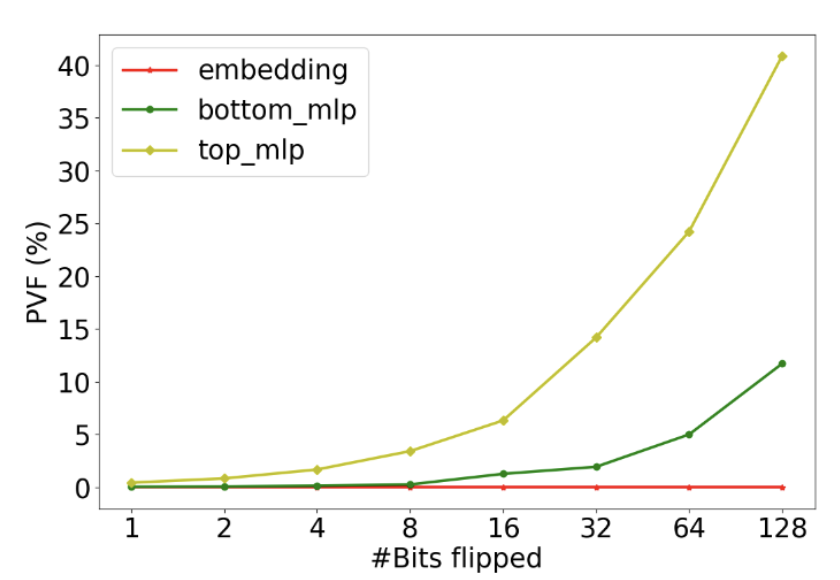
Increasing to 128 bit flips raised MLP PVF to roughly 40% for the top-MLP and 10% for the bot-MLP, in some cases yielding NaN outputs. The top-MLP was more vulnerable than the bot-MLP; its closeness to the final output means fewer intermediate neural layers can mask its errors.
Using PVF in system design
PVF can guide defensive design choices. Engineers could map parameters with higher PVF values to better-protected hardware, applying fault tolerance selectively instead of broadly. This allows explicit cost tradeoffs between latency, power, and reliability. A consistent, standard metric also makes it possible to compare reliability across different AI systems and foster shared progress in vulnerability evaluation.
Detecting and mitigating SDCs with Dr. DNA
A separate but complementary line of work addresses SDC detection and mitigation. Dr. DNA extracts signatures based on the distribution of neuron activations (DNA), identifying SDCs during deep neural network inference early enough to mitigate their effects. In evaluations across 10 DNN models — including ResNet, Vision Transformer, EfficientNet, YOLO — and four error models, Dr. DNA reported an average detection rate of 95% and over 90% across all tested cases. It also lowered error impact with under 1% memory overhead and under 2.5% latency overhead.


