
How Dropbox Shaves Minutes Off Its Incident Response
Dropbox treats incident management as a core piece of its reliability strategy, sitting alongside proactive measures like Chaos engineering. For a service handling exabytes of user data, every minute of an availability incident has direct business consequences: unhappy users, churn, lost signups, and reputational damage. The company also faces contractual obligations—an uptime SLA of 99.9% allows roughly 43 minutes of downtime per month, while an internal target of 99.95% leaves only 21 minutes.
The company’s incident response framework, called SEV (for SEVerity), shares the basic structure used by many SaaS providers. Every incident is categorized by type (Availability, Durability, Security, Feature Degradation) and leveled from 0 (most critical) to 3. Key roles include the IMOC (Incident Manager On Call), who coordinates the response and communications; the TLOC (Tech Lead On Call), who drives the technical investigation; and, for customer-impacting events, a BMOC (Business Manager On Call) who handles external updates, status pages, and regulatory notifications where necessary.
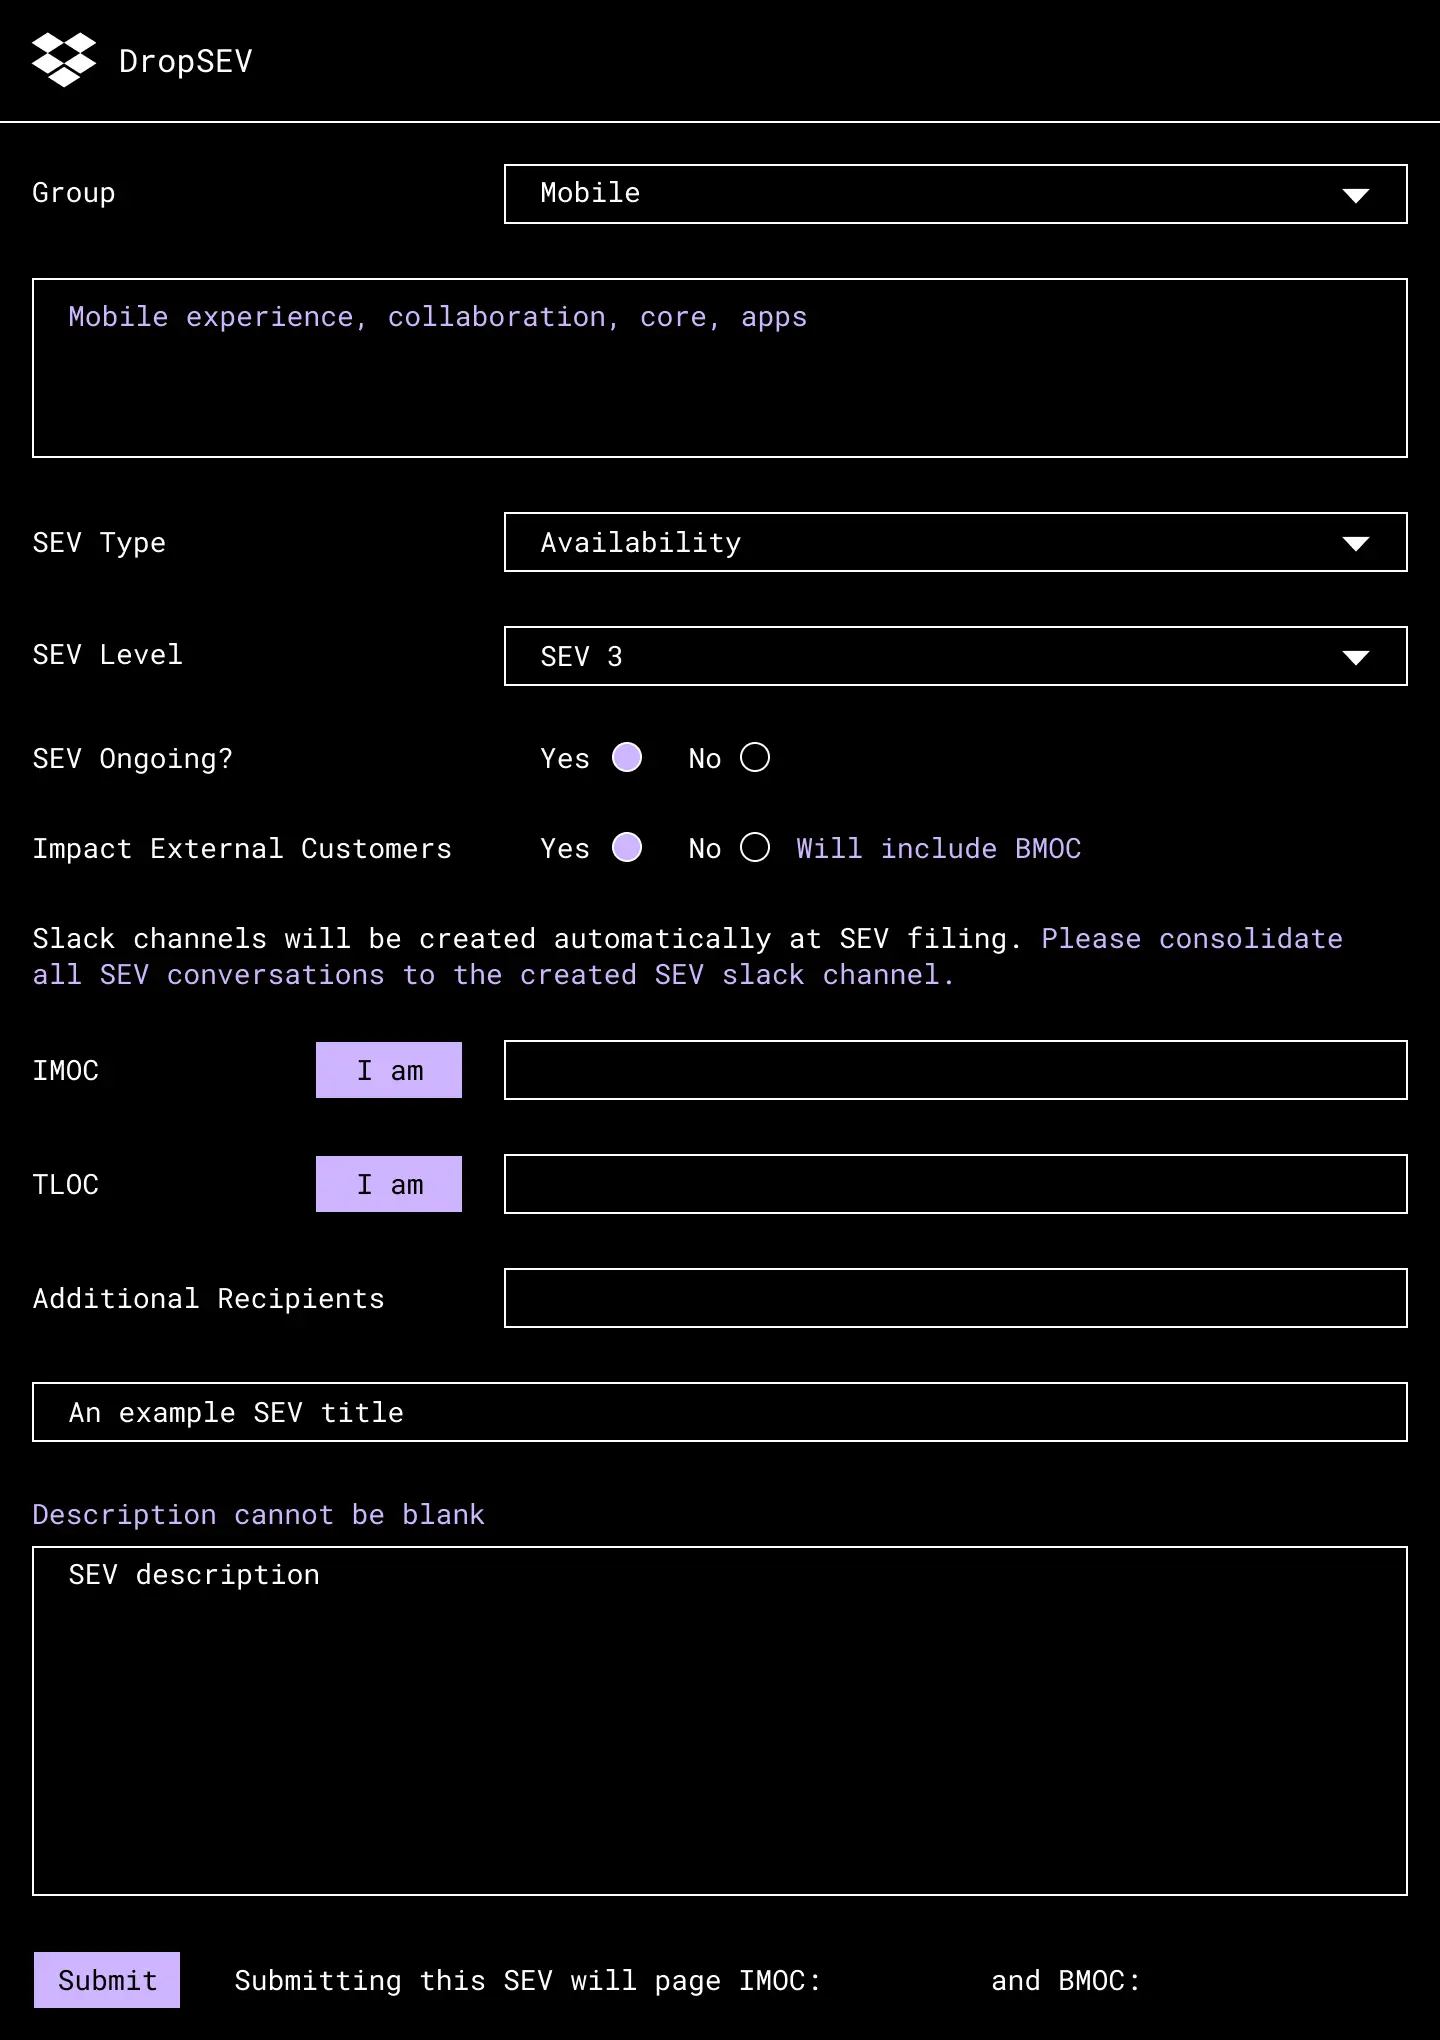
To operationalize this, Dropbox built DropSEV, an internal tool that lets any employee declare an incident, automatically spinning up the response roles and communication channels—Slack, email, a Jira ticket—plus a pre-populated postmortem document.
The Three Phases of Impact
While the full SEV lifecycle includes post-incident analysis, the critical period is before mitigation, when users are still affected. Dropbox breaks this into three phases:
- Detection: time to identify the issue and alert a responder
- Diagnosis: time to root-cause the issue and identify a resolution path
- Recovery: time to mitigate the issue for users once an approach is chosen
With a 21-minute monthly budget for downtime, optimizing each of these phases is not optional. The company found that automating detection and reducing human decision-making were the highest-leverage improvements.
Detection: Make Alerts Fast and Foolproof
Dropbox's monitoring infrastructure centers on Vortex, a server-side metrics and alerting system. It provides ingestion latency on the order of seconds, a 10-second sampling rate, and a straightforward interface for defining custom alerts. The 2018 redesign of Vortex was critical for reliability: if the system can't reliably signal responders within tens of seconds of an incident beginning, the entire response is delayed before it starts.
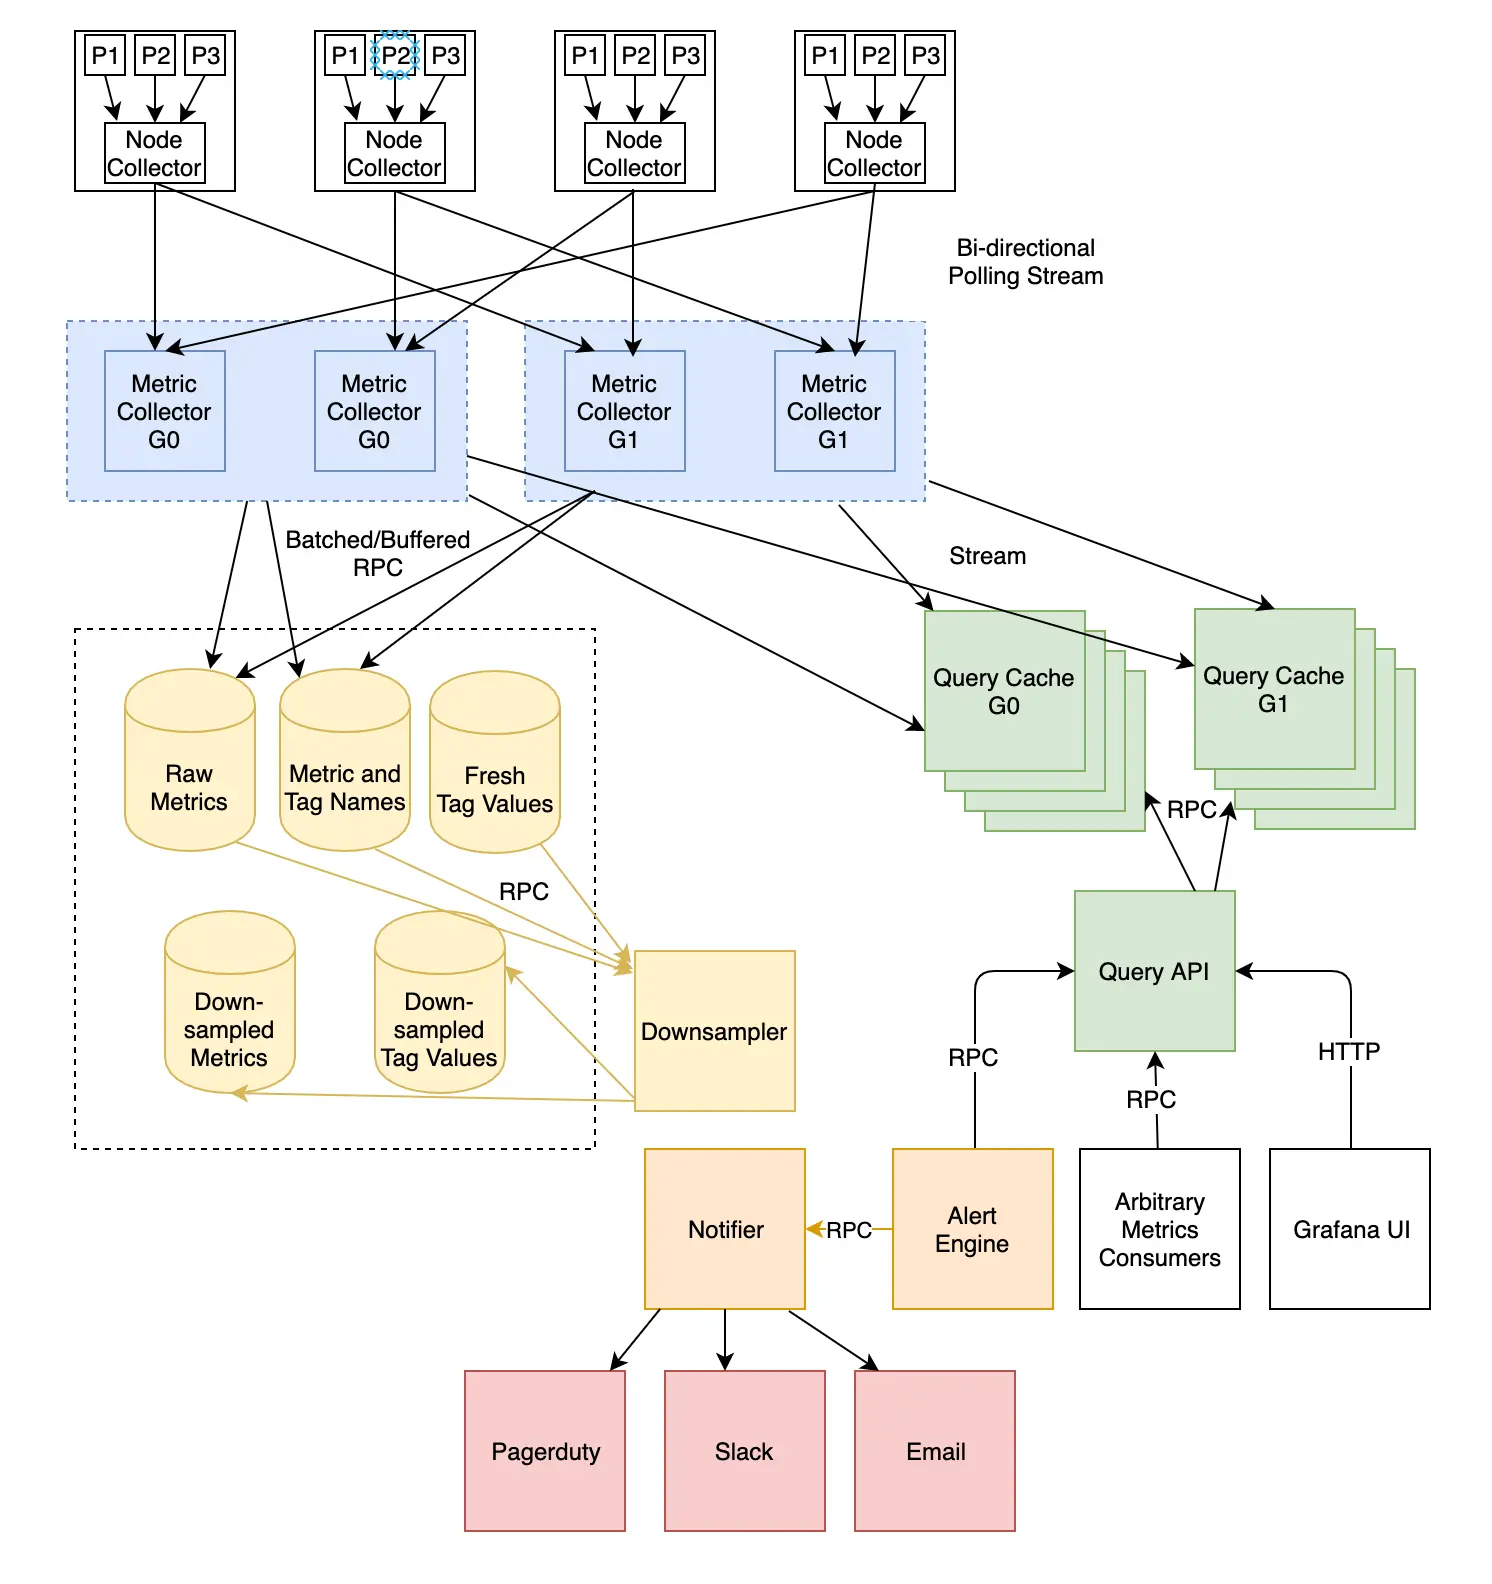
An overview of the Vortex architecture. Check out our detailed blog post for more on Vortex.
Fast alerting is only useful with well-defined metrics. Dropbox reduces the burden on service owners by baking a rich set of standard metrics into its RPC framework, Courier, and into host-level infrastructure. These metrics are consistent across Go, Python, Rust, C++, and Java, and Courier also provides distributed tracing and profiling for triage.
Noisy alerts are a persistent problem, so Dropbox implemented an alert dependency system. Service owners can tie their alerts to common dependencies and automatically suppress a page if the root cause lies elsewhere. This means teams only get paged for issues they can actually act on, speeding up true incident response.
Removing the Human From SEV Filing
Historically, the first responder receiving a page had to judge whether the issue was "SEV-worthy" and manually kick off the formal process. That decision—checking availability metrics, assessing global impact, mapping it against a SEV level table—could cost minutes and was prone to error. In the worst case, no SEV was filed at all, and the response lacked the IMOC and BMOC coordination.
DropSEV made this easier by surfacing SEV definitions directly in the tool, showing a table that maps global availability impact to a severity level.
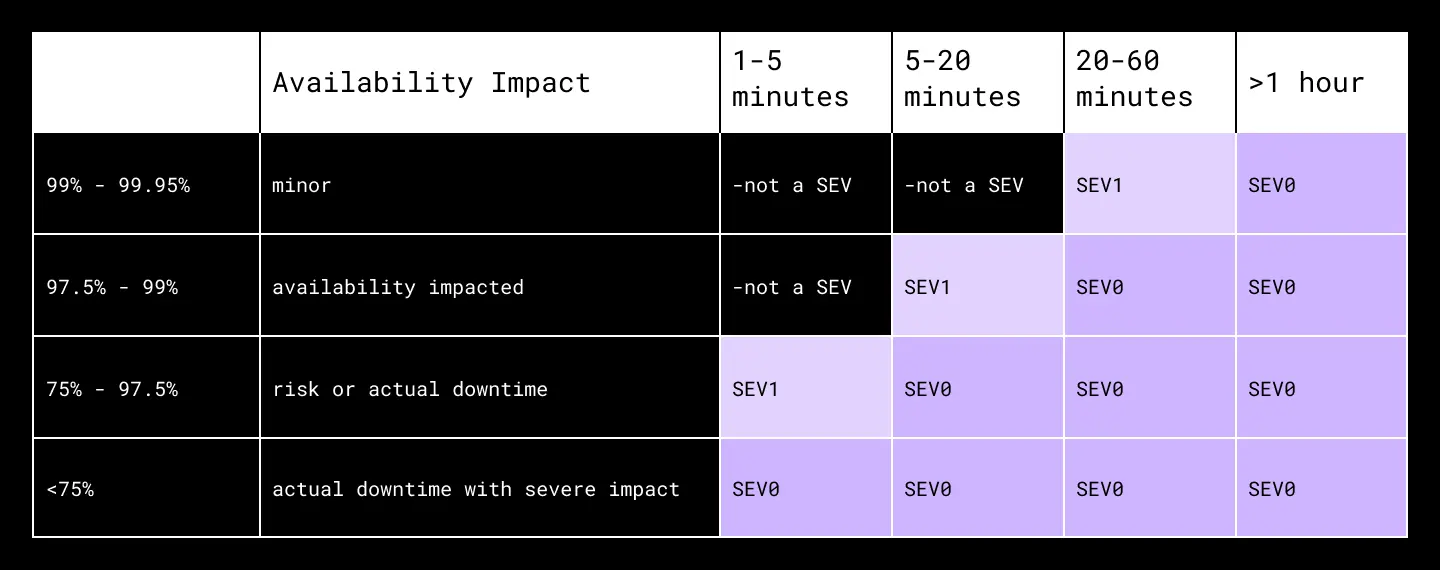
Even with that improvement, the decision point remained a bottleneck. So the team automated the process: all availability SEVs are now filed automatically. DropSEV detects impact that meets the SEV threshold and triggers the formal response without human input. Service owners get their own system alerts, but they no longer need to divert attention to filing an incident, and Dropbox gains higher confidence that all response roles are engaged.
The lesson is simple: look for where your own incident flow depends on a human making a judgment call under pressure, and ask whether that decision can be automated instead.
Diagnosis and Recovery: Reducing Cognitive Load
Auto-filing availability SEVs addresses detection, but diagnosis and recovery remain inherently human-intensive. The goal here was to minimize the structural overhead so the TLOC and other engineers can focus on the technical problem rather than administrative tasks.
DropSEV was rebuilt to streamline this ugly middle part of the process. Because the tool auto-generates communication channels and a central place for data collection, there's no wasted time deciding where to coordinate. The system pre-populates the postmortem document, ensuring that as engineers work through the incident, they can leave notes without being asked.
A key internal metric during an incident is time-to-mitigation. For availability SEVs, Dropbox treats every minute as a scarcity. The design philosophy across all of these tools is to shave off moments wherever possible—whether that's through a faster metrics pipeline, disciplined alert definitions that reduce noise, or removing the need for a human to decide whether an incident is severe enough to warrant formal management.
By taking a systematic approach to the entire response lifecycle, Dropbox has been able to move faster during the moments that matter most. The specific tools and thresholds they use may not fit every organization, but the principle is broadly applicable: measure where your response time goes, reduce the number of human decisions required, and let your monitoring carry the weight of judgment where it can.
Diagnosis: Root-Causing Under Time Pressure
The Diagnosis phase is where the clock is most unforgiving. Once the initial alert fires, responders need to find the root cause—and fast. At Dropbox, our internal service directory includes a “Page the on-call” button, letting any human reach another team quickly rather than hunting down contact details in a wiki. That’s a long-standing, proven pattern that leverages PagerDuty.
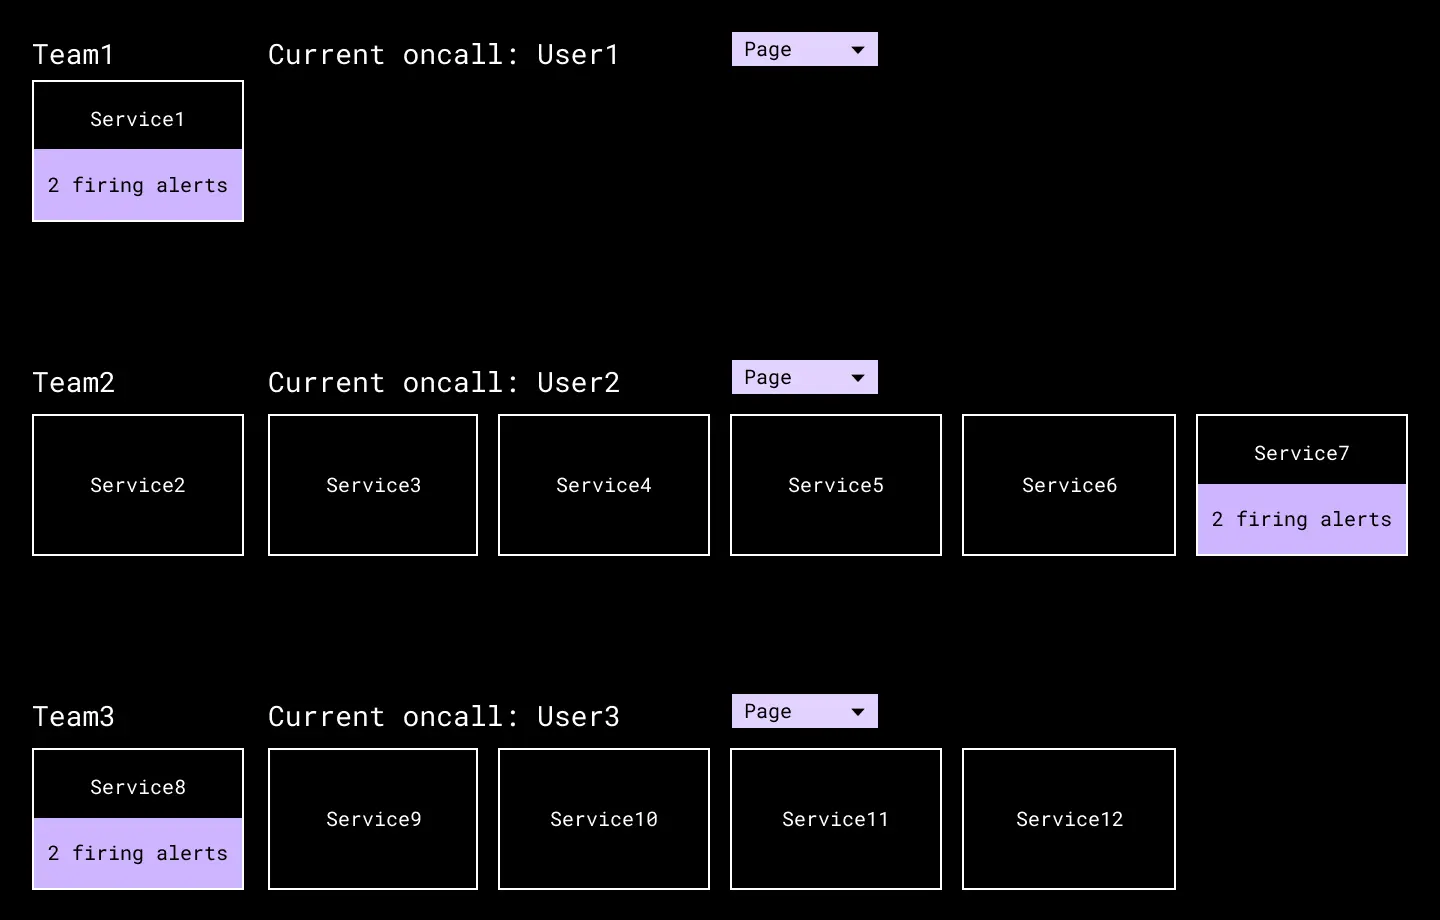
Our technical service directory includes a reference to each team’s on-call, and a button to quickly page them if needed in an emergency.
The problem we hit was a simple but deeply impactful one: every team had configured its PagerDuty setup differently. Escalation layers, delay between levels, and the channels on-calls received (push, SMS, phone) were designed in good faith—but inconsistently. No matter how well individual teams were covered, the variant behavior across teams made an outage beyond 21 minutes a recurring and unpredictable reality.
Inconsistent on-call setups naturally slow dispatch. After incident postmortems repeatedly surfaced this as a pain point, we built an internal service that queries the PagerDuty API to check configurations against common guidelines. We enforced these checks strictly, with zero exceptions. It was a hard shift for teams used to their own norms, but the predictability that followed was worth the friction. As patterns emerged, we found ways to nuance the initial rules, adjusting standards based on service criticality, and the check framework made it easy to iterate without reinventing the process each time. The core takeaway is to design on-call guidelines around your organization’s specific incident-response business requirements. Note that PagerDuty has since shipped its own On-Call Readiness Report—similar, though not identical, to what we built internally.
Triage dashboards and common ground
For the most critical services—like the one driving dropbox.com—we built triage dashboards that bundle all high-level metrics into one view. When you’re paged for an availability-page failure, the distance between that alert and the system at fault is crucial. These dashboards reduce that distance, allowing responders to bounce from general outage to likely culprit quickly.
No two incidents are alike, but the same signals help repeatedly. Across our backend services, we consistently find these variables useful during diagnosis:
- Client- and server-side error rates
- RPC latency
- Exception trends
- Queries per second (QPS)
- Outlier hosts, e.g. those with higher error rates
- Top clients
We don’t want engineers wasting minutes hunting for these during a war room. So we built an out-of-the-box dashboard showing all of the above and more—no setup burden for a service owner unless they want a team-specific, deeper-dive board.
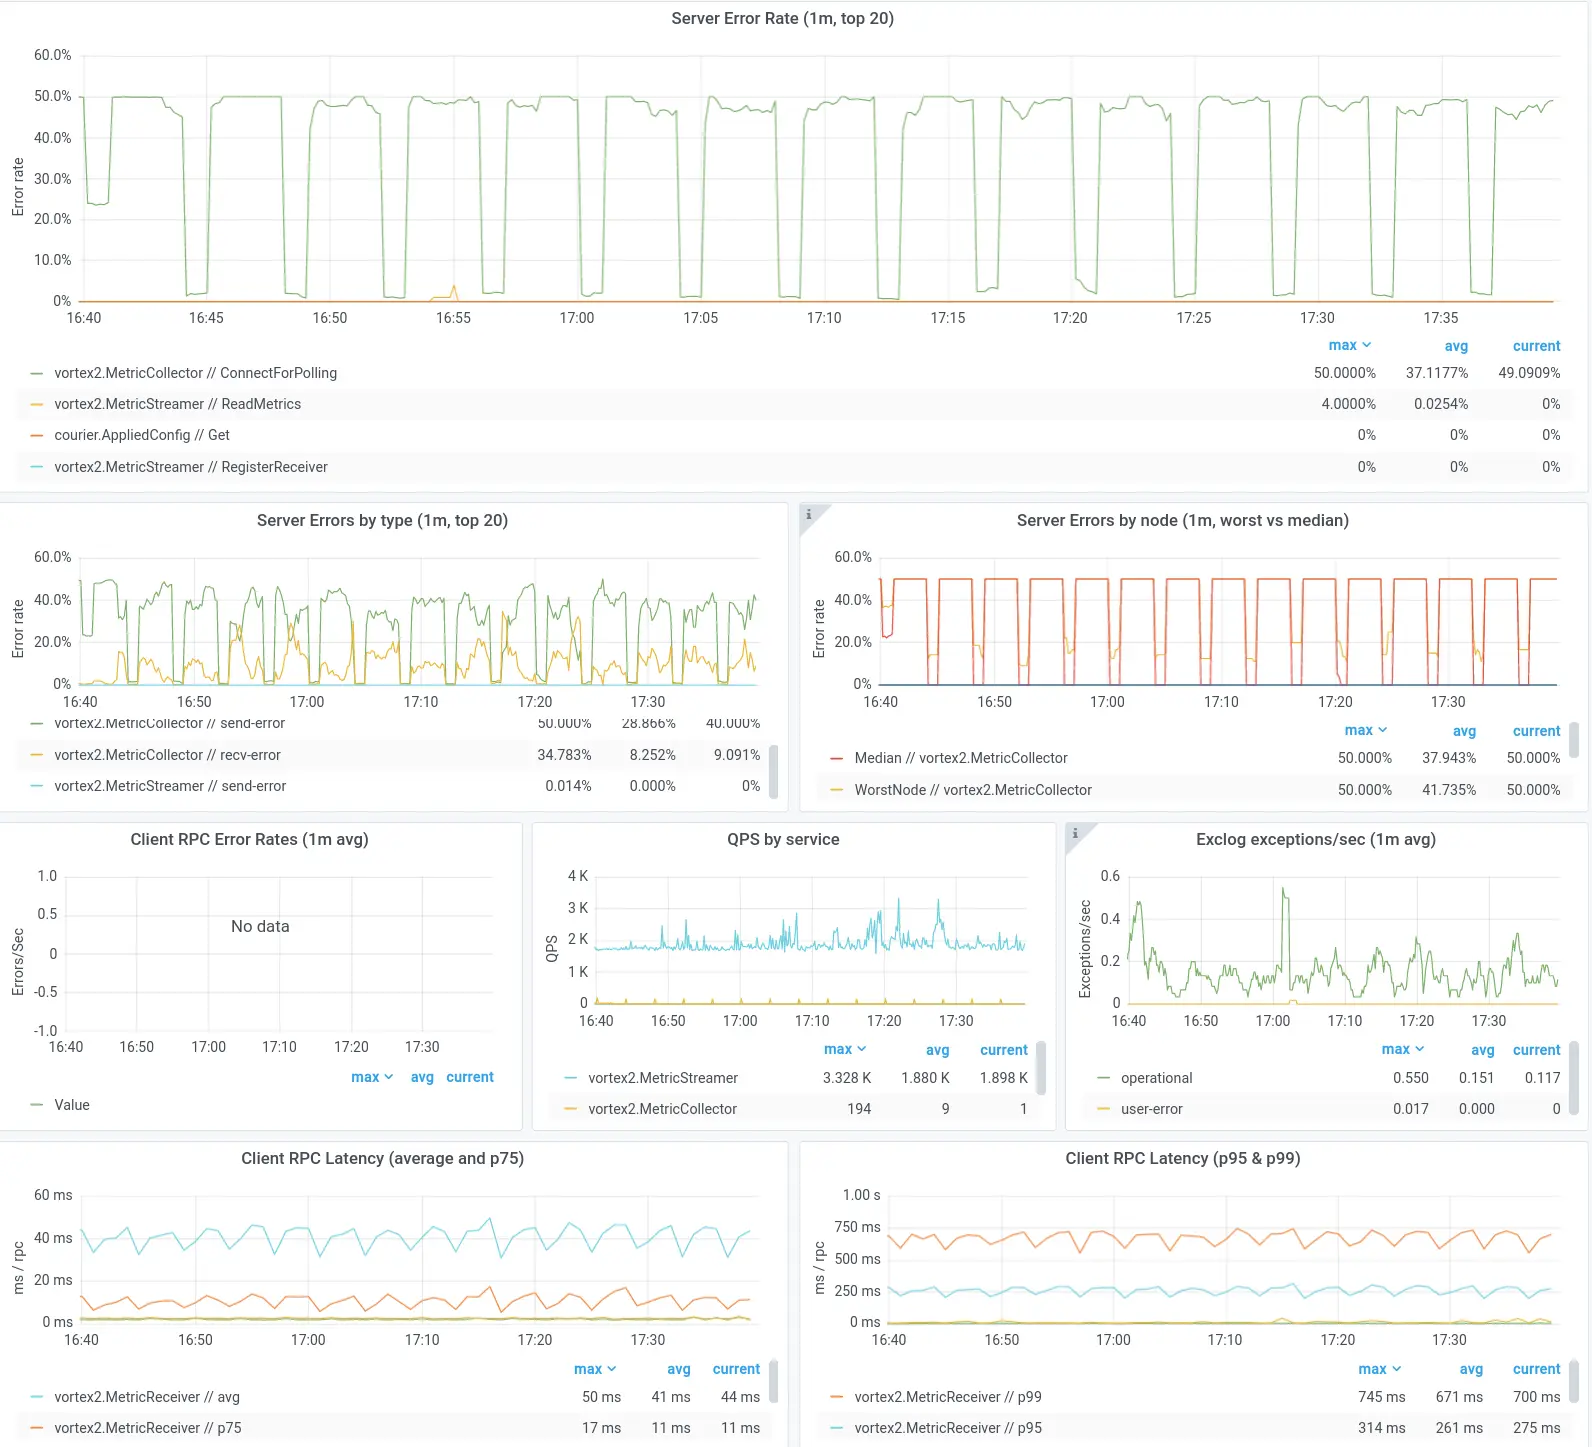
A segment of the Grafana-based Courier dashboard that service owners receive out-of-the-box.
A shared platform like that only grows better with iteration. New root-cause patterns show up in incidents—great, we add a panel. We also invested in annotations in Grafana to overlay critical events, such as code pushes or disaster recovery tests (DRTs). Seeing the push that caused the spike lets responders correlate the change with the failure; every small iteration shortens diagnosis company-wide.
Exception tracking as an early signal
One of our strongest diagnostic tools is exception tracking: any service can emit stack traces to a central store, tag them, and in the frontend explore how those exceptions trend over time. The ability to dive into where, when, and how often code is failing is immediately useful when troubleshooting larger Python-based applications.
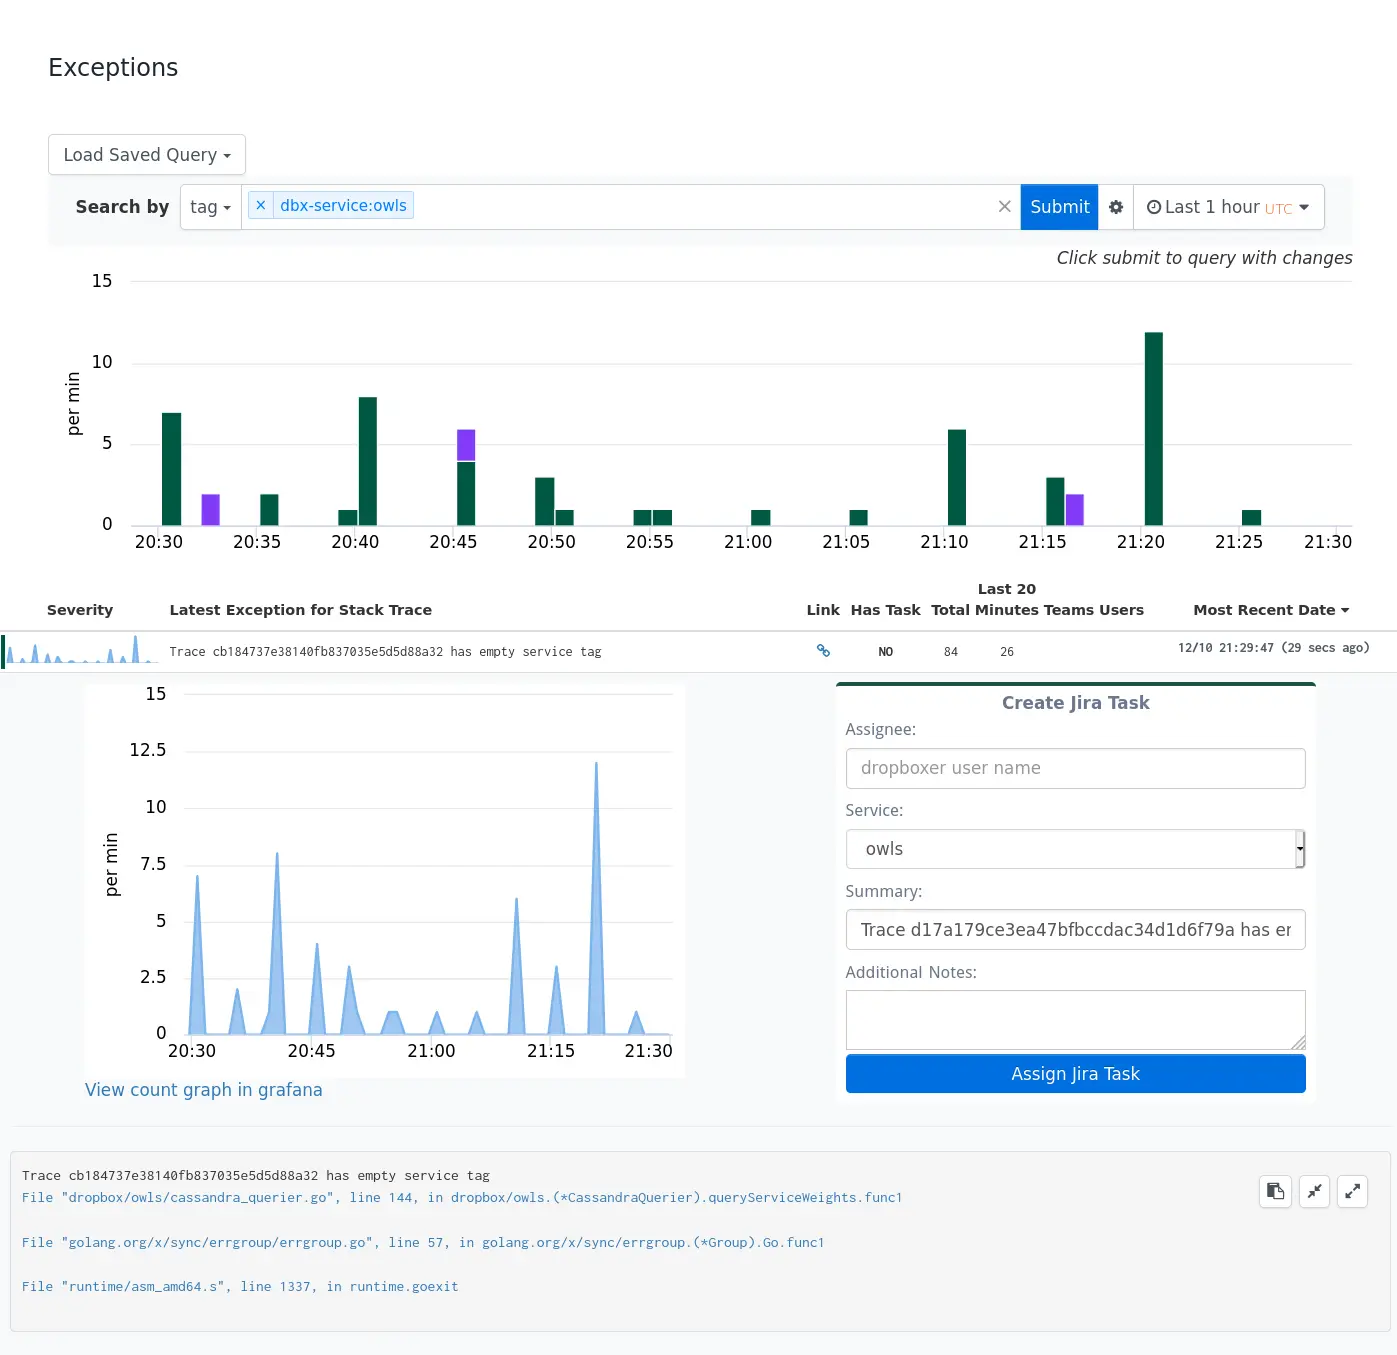
The Incident Manager’s filter
The SEV team trying to diagnose an issue faces a barrage of interest. Customer-facing people demand an ETA; owners within the blast radius want the technical scope; accountable senior leaders want to inject urgency; and senior engineering leaders sometimes start trying to solve the problem themselves. The remote-work shift in 2020 only worsened the cross-chatter in Slack war rooms.
Dropbox’s incident command structure has an Incident Manager (IMOC) and a Tech Lead (TLOC).
There’s a stark difference between knowing the process—PagerDuty, postmortems, terminology—and knowing how to run a room with people typing from their kitchens. Engineer feedback told us clearly: our typical IMOCs may have known the playbook, but they were not protecting the team from the noise. They were not clearing the distraction path. The gap we found was a lingering, implicit role mismatch: our training didn’t spell out that an IMOC’s prime directive is to set urgency, keep the focus in one channel, and block all incoming side-questions from the SEV team.
Since then, we updated cadence and expectations in our training to explicitly cover distraction-shielding and consolidating communication in a single war room. We now plan to shift from checkpointing theory to practicing it using game-like SEV scenarios. Tabletop exercises will engage more IMOCs and raise, site reliability–wide, the bar for readiness.
We also introduced a Backup Response Team of senior IMOCs and TLOCs, pullable into only our most severe incidents. Given a clear playbook—tuning in, assessing the state of the room, and coordinating with the existing lead about switching ownership—senior responders became an on-demand support layer rather than unguided extras shouting into the ether.
Our clear lesson from all this is to weigh yourself on the gap between how your response process design document reads and how your incident team actually behaves when the pressure hits. If the right channels exist but nobody is watching the chatter, own that in your next update to the process.
Operating Under a Strict Availability Target
A 99.9% uptime SLA leaves little room for error: roughly 43 minutes of downtime per month. That constraint forced Dropbox to rethink how it approached recovery time and how it identified the risks that could push it past its limit.
The 20-Minute Rule
As part of quarterly reliability risk assessments, Dropbox's infrastructure teams ran a bottom-up brainstorming exercise focused on a single question: which incident scenarios for their systems would take more than 20 minutes to mitigate? Anything exceeding that threshold posed a genuine threat to the SLA.
The exercise surfaced a wide range of theoretical incidents. Teams then stacked them by likelihood and worked to eliminate the worst offenders. A few concrete examples:
- Pushing the monolithic backend service took longer than 20 minutes. The owning team optimized the deployment pipeline and started running regular disaster recovery tests (DRTs) to keep push time below the threshold.
- Promoting standby database replicas could exceed 20 minutes during a single-rack failure. The metadata team improved rack diversity and strengthened its database promotion tooling.
- Changes to experiments and feature gates were difficult to trace, and core teams couldn't roll them back quickly in an emergency. The experimentation team added better change visibility, assigned clear owners, and provided central on-calls with rollback capabilities and a playbook.
The effort paid off: the number of lengthy availability incidents dropped sharply. Dropbox continues to use the "20-minute rule" as a benchmark for any new scenario it uncovers, and expects to tighten the threshold over time.
Teams outside Dropbox can adopt a similar approach: list the potential incidents that would take longest to handle, rank them by likelihood, improve the top items, and then validate the fixes with DRTs or "wheel of misfortune" exercises.
Guarding the Critical Path
Two authoritative data sources help Dropbox hold the line at 99.9%:
- A single source of truth for the SLA and which incidents have affected it.
- A dashboard tracking the relative impact of services in the critical path.
The single SLA source removes any ambiguity about how internal team contributions roll up to the customer-facing guarantee.
For the critical-path dashboard, Dropbox uses distributed tracing to calculate a weight for each service — an approximation of that service's overall importance. When a service's weight crosses a threshold, it triggers additional operational requirements. These weights serve a dual purpose: they provide another data point for risk assessments (letting teams compare risks across systems of differing importance), and they ensure that no newly critical service goes unnoticed. At Dropbox's scale, manually tracking every new service is infeasible, so automated critical-path tracking catches what humans would miss.
From Availability Numbers to User Impact
Traditional availability metrics can mislead. Dropbox has seen SEVs with a steep availability drop but almost no real customer impact — and, more troublingly, availability dips that barely qualified as SEVs but made dropbox.com completely unusable. The latter scenario is the dangerous one, because it risks under-serving and under-communicating to users.
The tactical fix focused on the website, which sees lower traffic than the desktop and mobile apps and therefore can hide availability problems in aggregate numbers. Engineering teams identified roughly 20 web routes corresponding to key webpages and components, and began monitoring availability for each route individually. Those metrics were added to dashboards, alerts, and SEV criteria. Incident managers were trained to interpret the data, map a dip to specific user impact, and communicate with customers — and the process was practiced via tabletop exercises.
The result: in subsequent incidents affecting the website, response teams could quickly determine whether core user workflows were broken and engage with customers accordingly.
This is still an open problem. Future work includes classifying all routes across platforms into criticality buckets, using direct signals of customer impact (help-center traffic, ticket inflow, social media reaction) to trigger engineering response, and estimating distinct affected users in real time. Client-side instrumentation may also play a role in measuring customer experience end-to-end.
Continuous Improvement Through Blameless Review
Dropbox does not claim perfection in incident management. Each lesson in its process came from real incidents — and usually a bad one or two — that exposed where the response was lacking. The gaps revealed in incident reviews are the raw material for improvement. You cannot prevent every critical incident, but you can stop the same contributing factor from recurring.
The foundation of this is a blameless culture. When a responder makes an error, the review does not assign fault. Instead, it asks three questions: what guardrails were missing from the tooling to prevent human error, what training failed to prepare the responder, and whether automation could have removed the responder from the loop entirely.
This culture lets everyone confront hard lessons openly. And just as no one individual is blamed for an SEV, no single person can take credit for the organization-wide improvements to incident management at Dropbox. The changes have come from sustained coordination across the Reliability Frameworks, Telemetry, Metadata, Application Services, and Experimentation teams.


