

A Deployment Pipeline That Doesn’t Need a Babysitter
GitHub.com’s engineering team doubled over the past year, and the chatops-based deployment process that worked for a smaller group quickly became a liability. Deploys were coordinated in a single Slack room, #dotcom-ops, where a deployment’s lifecycle was scattered across hundreds of messages. Developers lost the ability to track their changes, which slowed them down and increased the risk of mistakes during rollouts.
The old model was a branch deploy: changes were queued, deployed, and merged from chatops before landing on the main branch. It was simple, but the information density of the channel made it nearly impossible to validate the state of a deploy at a glance.
This is just one step of about a dozen spread across hundreds of messages — hard to keep track of and validate.
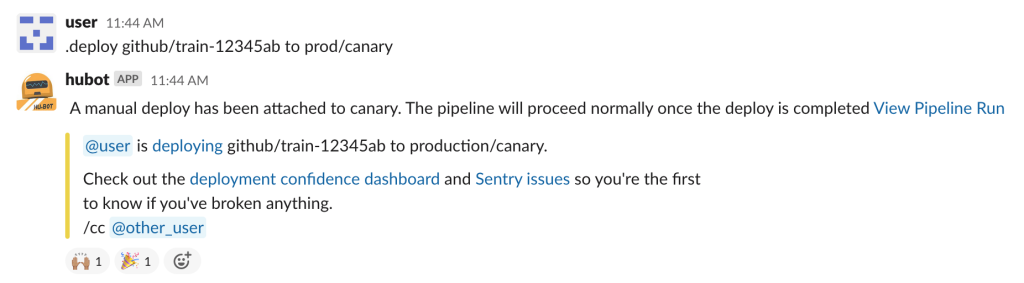
The team set out this summer to rebuild how deploys are monitored and executed. Three specific problems drove the work: deploys were fragmented across messages, the canary stage only saw a small fraction of traffic, and developers had to manually shepherd each deploy through multiple chatops commands.
Higher-Traffic Canary
The existing canary deployed to at most 2% of GitHub.com traffic. That meant issues that only manifested at higher load or broader request patterns would slip through and force a rollback after a full production rollout. The fix was to add a second canary stage at 20% of traffic.
The split now works like this:
- The first canary runs at 2% and catches the bulk of regressions with minimal risk.
- The second canary, at 20%, exposes a much larger slice of traffic to the new build while still remaining in a controlled stage.
That second stage carries more risk, but the initial 2% gate filters out the most obvious problems first, making the jump to 100% production less of a gamble.
Automation
Even after the canary improvements, each deploy required developers to run separate chatops commands for queueing, canary deployment, and production — with judgment calls at every step. Mistakes were common.
The goal became: one command, everything else follows automatically. The team built on the existing internal deployment software, which had already proven capable of tracking individual stages. The new work linked those records together and let the whole sequence run from a single chatops command.
The design rests on two concepts:
- A deploy is made up of many stages (canary, production, etc.).
- Gates between stages perform checks that must pass before moving on.
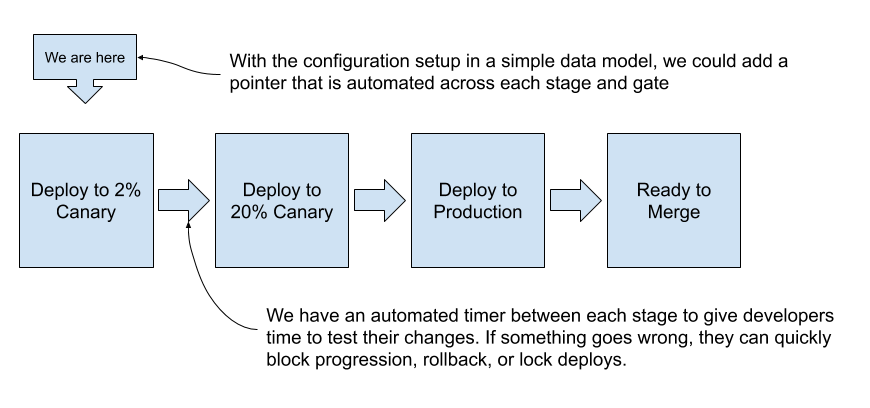
That resulted in a state-machine-like flow moving from 2% canary to 20% canary to production to ready-to-merge, with automated five-minute timers as the gates:
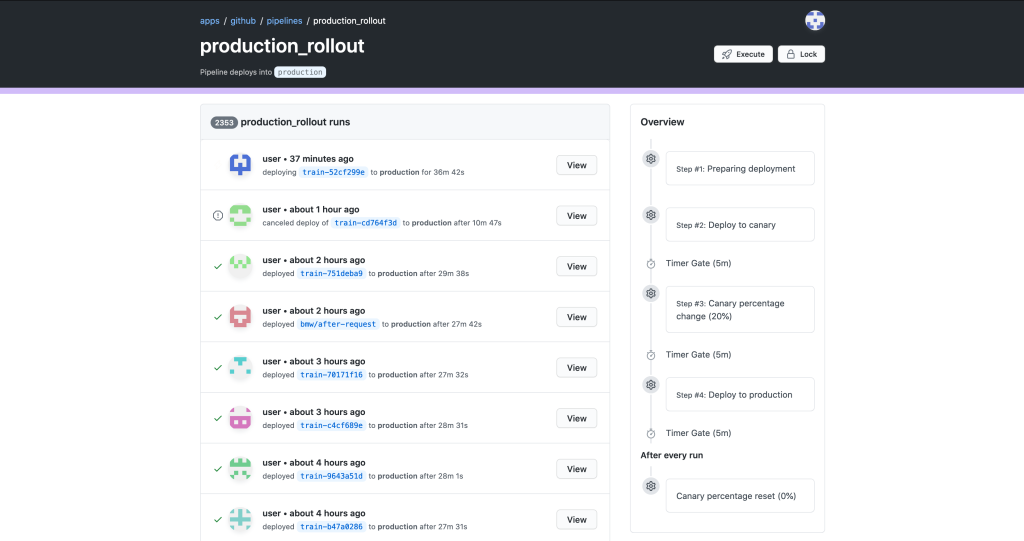
A consolidated UI now shows the progression of recent deploys. Rather than digging through Slack history, developers can see the state machine at a glance:
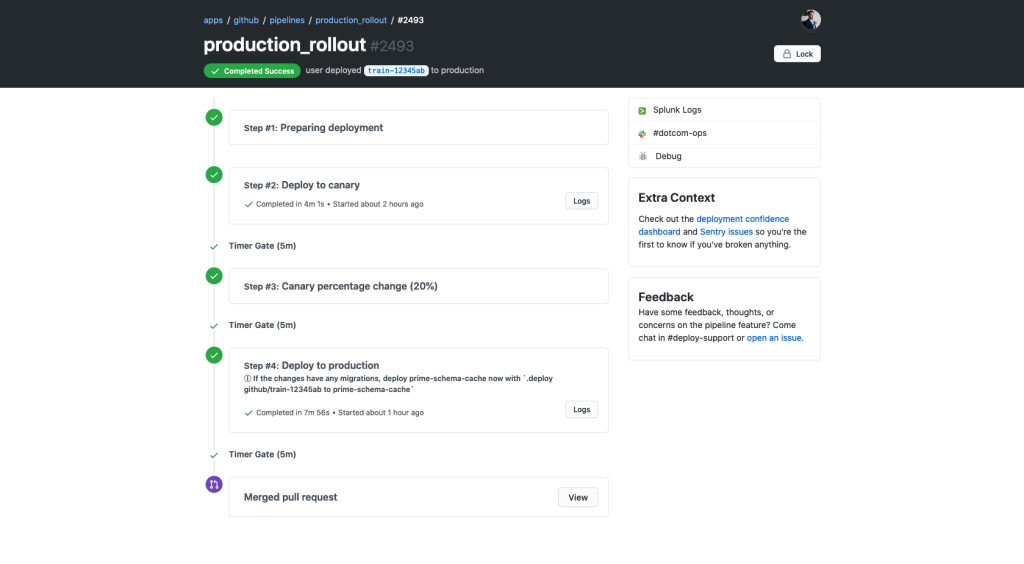
Drilling into a single deployment shows every stage, each with its automatic timer and a pause option for extra testing. A dropdown in the corner provides a quick rollback or revert path if something looks off:
Slack remains the entry point for starting a deploy, but the UI is now the monitoring surface:
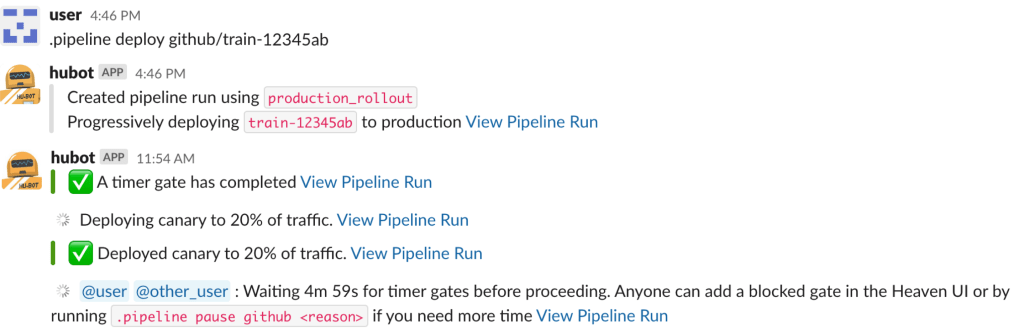
Results
The change removed the friction and confusion from the deploy process. Feedback internally has been strongly positive, and the work influenced the GitHub Actions CD feature announced at Universe 2020. Engineers no longer have to babysit a rollout; the system moves through its stages on timers, pausing only when a developer needs more time.


