Why eBPF Tools Make a Fast Observability Win
Adding eBPF-based observability to a commercial product usually starts with the same question: how do we get the most value for the least engineering effort? For in-house monitoring stacks, the answer is the same. The fastest path isn't building custom BPF programs from scratch. It’s wrapping the existing, battle-tested command-line tools from the bcc and bpftrace projects and feeding their output into whatever aggregation pipeline you already have.
The key is accepting that "version 1" is a thin wrapper around standard tools, not a from-scratch implementation. Get that working first. Once the plumbing is in place, you can start swapping in more sophisticated agents.
Start With a Working Tool
Install bcc or bpftrace on a target system. On Ubuntu, bcc is a simple package install:
# apt-get install bpfcc-tools
Then verify the plumbing with a tool that has already debugged countless production systems. For example, execsnoop (8) prints every new process with a timestamp:
# execsnoop-bpfcc -T
TIME     PCOMM            PID    PPID   RET ARGS
19:36:15 service          828567 6009     0 /usr/sbin/service --status-all
19:36:15 basename         828568 828567   0
19:36:15 basename         828569 828567   0 /usr/bin/basename /usr/sbin/service
19:36:15 env              828570 828567   0 /usr/bin/env -i LANG=en_AU.UTF-8 LANGUAGE=en_AU:en LC_CTYPE= LC_NUMERIC= LC_TIME= LC_COLLATE= LC_MONETARY= LC_MESSAGES= LC_PAPER= LC_NAME= LC_ADDRESS= LC_TELEPHONE= LC_MEASUREMENT= LC_IDENTIFICATION= LC_ALL= PATH=/opt/local/bin:/opt/local/sbin:/usr/local/git/bin:/home/bgregg/.local/bin:/home/bgregg/bin:/opt/local/bin:/opt/local/sbin:/ TERM=xterm-256color /etc/init.d/acpid
19:36:15 acpid            828570 828567   0 /etc/init.d/acpid status
19:36:15 run-parts        828571 828570   0 /usr/bin/run-parts --lsbsysinit --list /lib/lsb/init-functions.d
19:36:15 systemctl        828572 828570   0 /usr/bin/systemctl -p LoadState --value show acpid.service
19:36:15 readlink         828573 828570   0 /usr/bin/readlink -f /etc/init.d/acpid
[...]
That output alone has exposed misconfigured systems running shell scripts that loop on failing processes, and minor services crash-looping unnoticed every few minutes.
Integrating Into Your Product
Your agents likely already have a mechanism to run a command and capture the stdout, or stream it to a data store like S3, Hive, or Druid. If so, you already have the hardest part built. Treat execsnoop (8) as just another command to run. Capture its output for a short window — 10 to 60 seconds is a sensible first pass. Since execsnoop (8) lacks a built-in duration flag, wrap it with watch -s2 60 execsnoop-bpfcc for a one-minute run.
Process execution is a low-frequency event; sampling it continuously has negligible overhead. Still, before flipping any tool on 24x7, study its cost profile. The 10-to-60-second window is a safe default until you have real utilization data.
The bpftrace versions of the same tools lack canned CLI options like -v or -l, but they offer a JSON output mode designed specifically for programmatic consumption:
# bpftrace -f json execsnoop.bt
{"type": "attached_probes", "data": {"probes": 2}}
{"type": "printf", "data": "TIME(ms)   PID   ARGS\n"}
{"type": "printf", "data": "2737       849176 "}
{"type": "join", "data": "ls -F"}
{"type": "printf", "data": "5641       849178 "}
{"type": "join", "data": "date"}
Handling Dependencies Now and Later
The current bcc and bpftrace packages pull in LLVM runtime dependencies, adding tens of megabytes per install. That is a real constraint in embedded scenarios. The fix is already on the roadmap: bcc's libbpf-tools drop the Python layer and use BTF and CO-RE. The same approach can yield a dependency-free, roughly 100-Kbyte binary for bpftrace.
That path requires a Linux 5.8+ kernel to work cleanly. If most of your fleet is older, do not block your "version 1" on this migration. Ship the LLVM-based tools now and plan the swap later.
One configuration flag matters for the future: CONFIG_DEBUG_INFO_BTF=y (and its modules counterpart) must be enabled in the kernel. It is already set in Ubuntu 20.10, Fedora 30, and RHEL 8.2. If any customer runs a less mainstream distro, verify that setting with them to avoid a dead end down the road.
The Version 1 Dashboard
Once one tool is in production, build out the dashboard. A pragmatic top-ten list can be lifted straight from the bcc tutorial. These cover the most common performance culprits with the fewest tools:
| Tool | Shows | Visualization | |
|---|---|---|---|
| 1. | execsnoop | New processes (via exec(2)) | table |
| 2. | opensnoop | Files opened | table |
| 3. | ext4slower | Slow filesystem I/O | table |
| 4. | biolatency | Disk I/O latency histogram | heat map |
| 5. | biosnoop | Disk I/O per-event details | table, offset heat map |
| 6. | cachestat | File system cache statistics | line charts |
| 7. | tcplife | TCP connections | table, distributed graph |
| 8. | tcpretrans | TCP retransmissions | table |
| 9. | runqlat | CPU scheduler latency | heat map |
| 10. | profile | CPU stack trace samples | flame graph |
Split them by overhead profile. runqlat and profile sample hot paths and can be costly; keep those on short, 10-to-60-second-on-demand runs. The rest — execsnoop, biolatency, tcplife, tcpretrans — capture discrete events and are safe to leave on continuously.
You do not need to write user documentation. Both bcc and bpftrace ship man pages and example files that describe output semantics. Link to them from your product UI.
Warning: run these tools only in on-demand or sampled mode — not 24x7 — until you measure the overhead of the heavy hitters like runqlat and profile.
Choosing bcc vs. bpftrace
Stick with bcc if your team is new to tracing; its CLI is mature and option-heavy. Choose bpftrace when you want to edit and customize the tools themselves, and especially if the consumption target is a structured pipeline, since its JSON output mode ships as a first-class feature.
Architecture in the Field: Netflix
Netflix is building its next GUI on the bpftrace tool versions. The architecture keeps a single copy of the tool scripts on a web server; the bpftrace binary lives on each target. Agents pull the current script from that central server only when a run is requested.
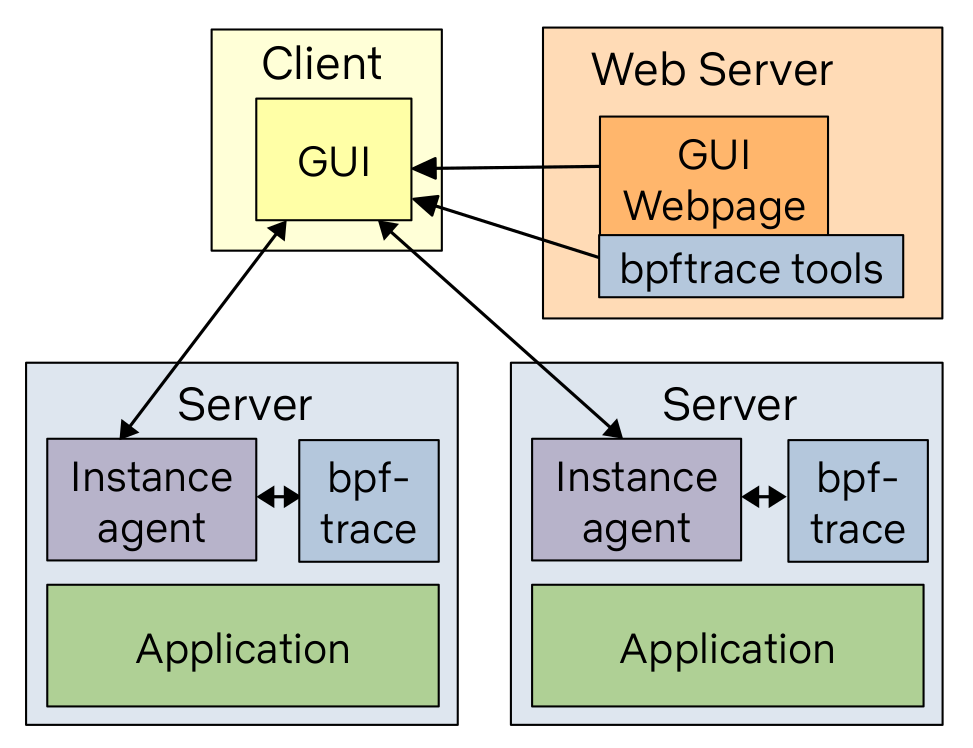
Pushing tools from that single location means Netflix always runs the latest versions. That GUI is part of FlameCommander, which already spans their cloud fleet for flame graph analysis. The prior GUI, built into the Vector agent, used bcc but is now deprecated. For internal observability stacks, this "service the tools centrally" pattern is worth copying.
Class of Bugs: Version Skew
The universal failure mode is porting a BPF tool into a different language and then failing to keep it in sync with kernel and library changes. BPF tools are like kernel patches: they must evolve as the kernel does. A tool written against kernel 4.15 semantics may refuse to load on 5.12 — the lucky case.
The worse scenario is silent corruption. A cachestat (8) written in 2014 for Linux 3.2 used then-available Ftrace hooks. That implementation was inherently brittle — a sandcastle that required active upkeep. Though later ports to BPF kprobes worked, newer kernels have again broken its output with nonsensical numbers. Every vendor that forked its own cachestat must re-apply that fix by hand; users pulling from the bcc repo get it automatically when the maintainers update it. Expect the forked, unmaintained copies to surface as customer tickets for years.
This is specific to tracing code that must change with the kernel. A flame graph renderer is a finished, simple algorithm; rewriting it in another language is harmless. A kprobe-or uprobe-based tool is not. There is no patch-and-forget strategy for those. The longer the gap between kernel releases and your tool version, the more likely you are debugging an issue that is actually a stale BPF program.
Adopt the Right Engineering Mindset
The fastest path to adding eBPF observability to your product isn't necessarily writing new code. If your monitoring stack doesn't already have an agent, look at the existing bcc or bpftrace toolkits first. Building on these—approaching the task like a sysadmin integrating and maintaining packaged software rather than a programmer writing everything from scratch—will produce a usable version one in days rather than weeks.
The Cost of Rewriting from Scratch
A common mistake is assuming that serious BPF work means mastering the underlying C or Python APIs. That path is steep: understanding the internals of bcc and BPF takes weeks as a standalone skill, and the subtleties of system tracing—kprobes, function signatures, and runtime behavior—can take months or even years to truly internalize.
Beyond the upfront learning, there's a perpetual maintenance burden. Tools that rely on kprobes are especially fragile: a kernel function that exists in Linux 5.3 might be renamed, inlined, or replaced with a new code path in 5.4, silently breaking the probe. The BPF ecosystem is also actively evolving with BTF and CO-RE, which change how libraries and frameworks are constructed.
This means choosing a porting effort also means committing to replicate every update in the upstream projects. If you don't plan for continuous integration of those updates, your rewritten stack will become stale. Pulling in upstream updates of bcc and bpftrace is considerably easier than maintaining your own version of a moving target.
What to Keep in Mind for the Future
If you have a compelling idea for a better BPF library or framework, one that improves on what bcc and bpftrace offer, that kind of innovation is welcome—the BPF ecosystem is still in its early phase. But before committing, ensure you understand the existing tooling and the maintenance load it already represents. Contributions that extend what exists tend to be more valuable than re-implementations of the status quo.


