

Anatomy of the GitHub Advisory Database
The GitHub Advisory Database is a catalog of known security vulnerabilities and malware affecting open source packages. It organizes its content into three categories:
- GitHub-reviewed advisories: Manually reviewed vulnerabilities mapped to packages in supported ecosystems.
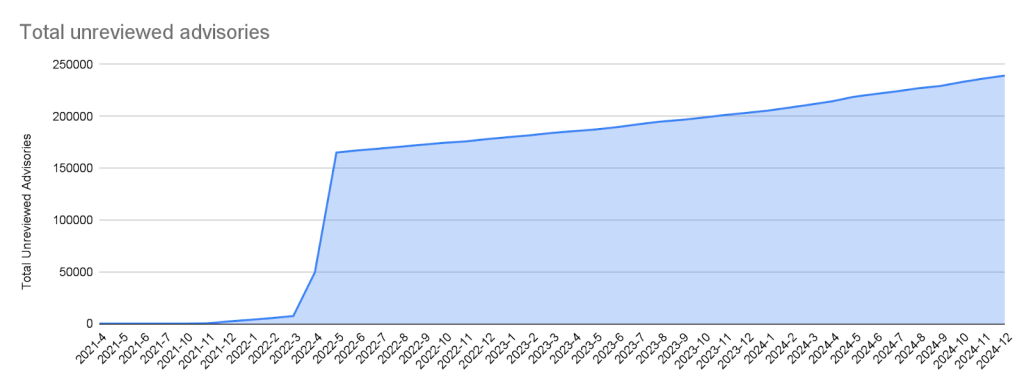
- Unreviewed advisories: Automatically ingested from the National Vulnerability Database (NVD). Despite the name, many are reviewed by GitHub analysts, but they don’t qualify as reviewed advisories because they either aren’t in a supported package ecosystem or don’t describe a valid vulnerability.
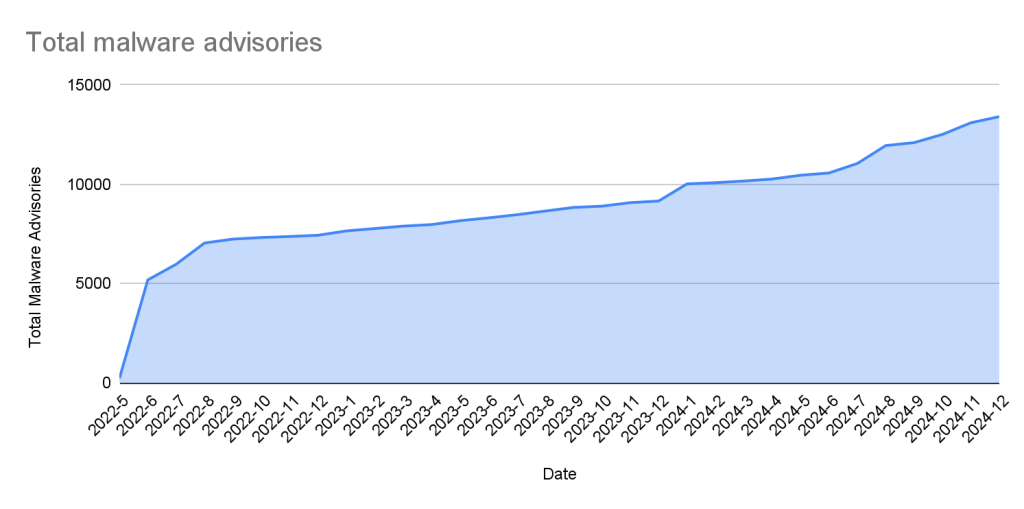
- Malware advisories: Threats identified by the npm security team, currently exclusive to the npm ecosystem. GitHub doesn’t edit or accept community contributions for this category.
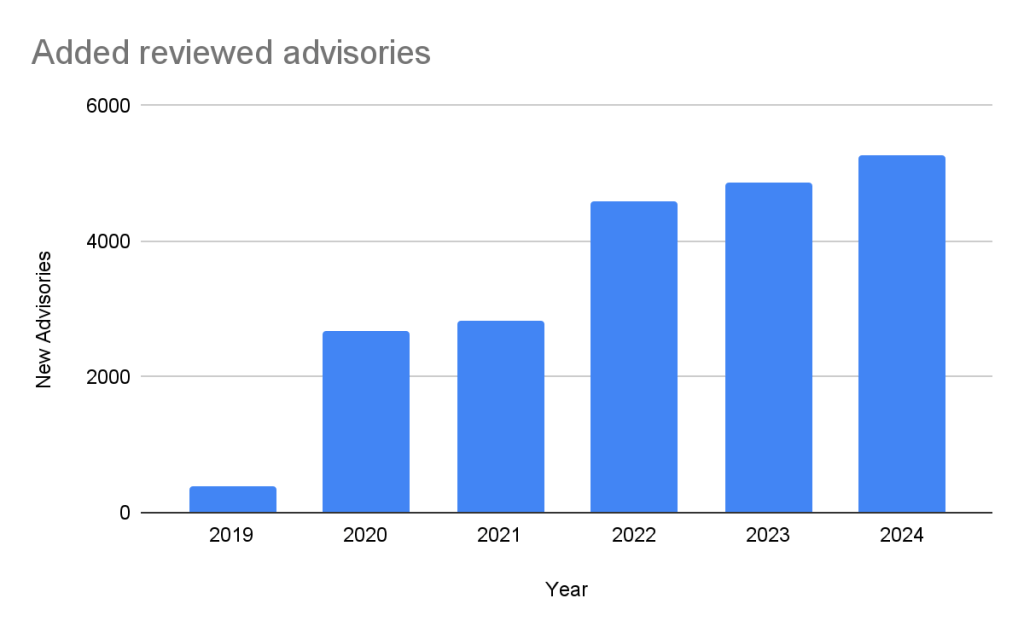
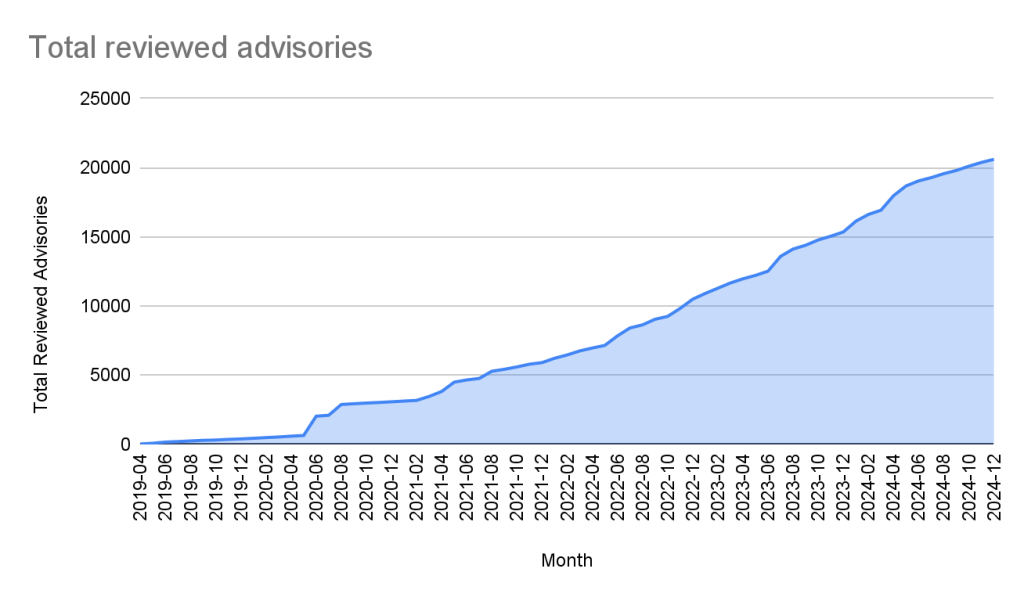
The database has grown from fewer than 400 reviewed advisories five years ago to more than 20,000 as of October 2024. That growth stems from more incoming reports, expanded ecosystem support, and campaigns to review advisories published before the database existed.
Ecosystem Distribution
Reviewed advisories are restricted to vulnerabilities in packages that come from supported registries, which are generally named after the associated programming language’s package registry.
| Ecosystem | Total advisories | Vulnerable packages | First added |
|---|---|---|---|
| pip (registry: https://pypi.org/) | 3378 | 1044 | 2019-04-19 |
| Maven (registry: https://repo.maven.apache.org/maven2) | 5171 | 955 | 2019-04-22 |
| Composer (registry: https://packagist.org/) | 4238 | 812 | 2019-04-26 |
| npm (registry: https://www.npmjs.com/) | 3653 | 2652 | 2019-04-26 |
| RubyGems (registry: https://rubygems.org/) | 840 | 371 | 2019-04-26 |
| NuGet (registry: https://www.nuget.org/) | 651 | 489 | 2019-04-26 |
| Go (registry: https://pkg.go.dev/) | 2011 | 865 | 2021-04-01 |
| Rust (registry: https://crates.io/) | 857 | 553 | 2021-05-25 |
| Erlang (registry: https://hex.pm/) | 31 | 26 | 2022-01-27 |
| GitHub Actions (https://github.com/marketplace?type=actions/) | 21 | 21 | 2022-07-29 |
| Pub (registry: https://pub.dev/packages/registry) | 10 | 9 | 2022-08-04 |
| Swift (registry: N/A) | 33 | 21 | 2023-05-10 |
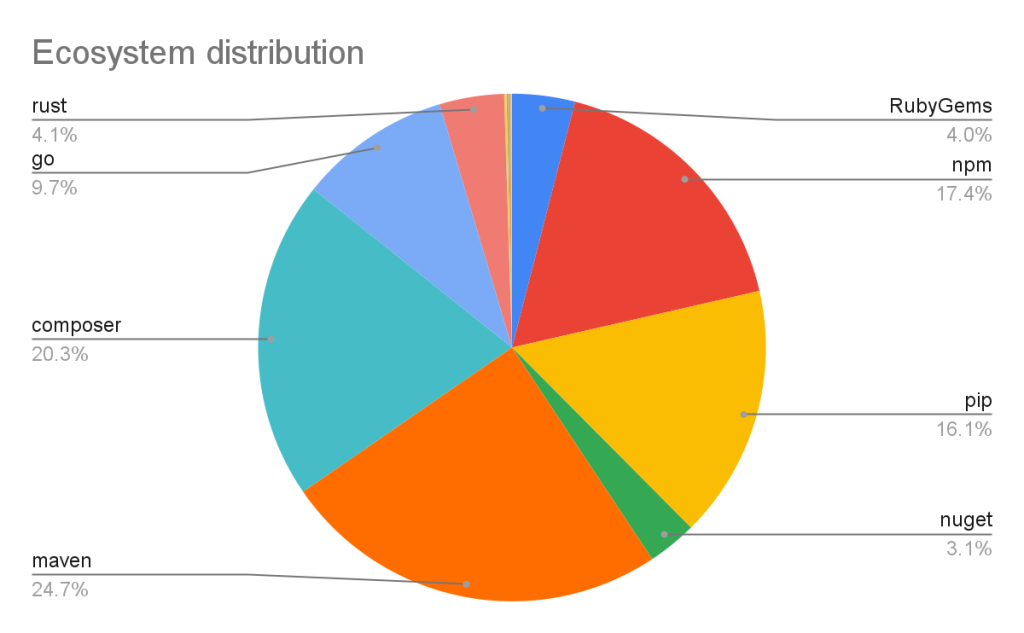
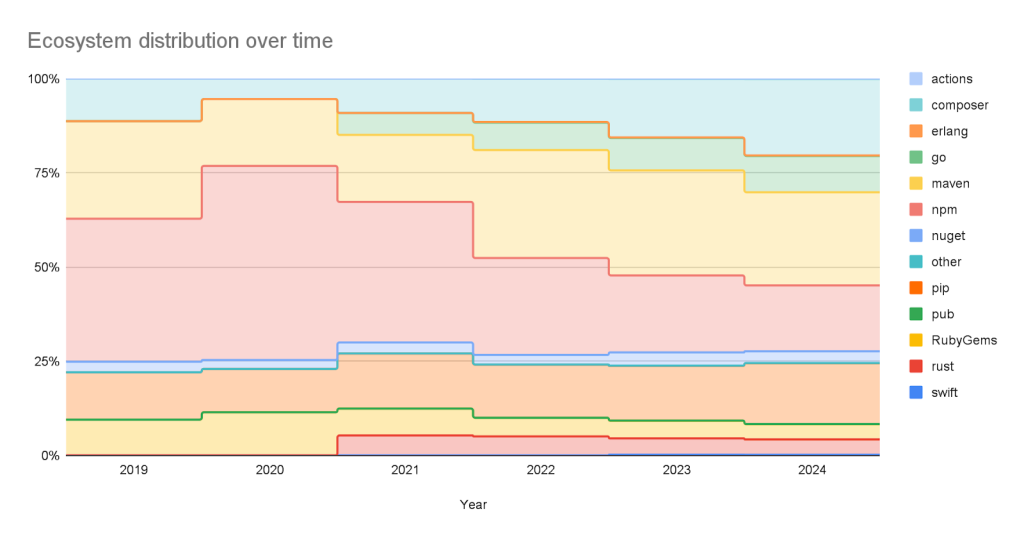
Maven and Composer packages account for nearly half of all advisories. npm, pip, and Go contribute much of the remainder, while the remaining ecosystems hold a much smaller share. That distribution has shifted considerably since launch—npm originally dominated the database, but broader ecosystem coverage has rebalanced the mix.
Where Advisories Come From
Advisories enter the database through four main channels:
| Source | Advisories | Reviewed advisories | Sole source | Coverage |
|---|---|---|---|---|
| NVD | 267429 | 18295 | 7450 | 6.84% |
| GitHub Repository Advisories | 12247 | 5311 | 564 | 43.37% |
| Community Contributions | 4512 | 4160 | 10 | 92.20% |
| PyPA Advisories | 3040 | 2739 | 14 | 90.10% |
| Go Vulncheck | 1581 | 1528 | 7 | 96.65% |
| NPM Advisories | 1411 | 1408 | 629 | 99.79% |
| FriendsOfPHP | 1406 | 1396 | 400 | 99.29% |
| RustSec | 943 | 849 | 171 | 90.03% |
| RubySec | 873 | 861 | 4 | 98.63% |
- NVD: The largest single source, covering all software types. GitHub publishes every NVD advisory but only reviews ones relevant to supported ecosystems.
- GitHub Repository Advisories: The second-largest source, originating through GitHub’s repository security advisory feature. These focus exclusively on open source software, so coverage is better even though they aren’t restricted to supported ecosystems.
- Community Contributions: Reports from users, nearly all requesting updates to existing advisories.
- Other Specialized Sources: Ecosystem-specific feeds such as PyPA Advisories for Python and Go Vulncheck for Go. Because these only cover packages within supported ecosystems, most qualify for review.
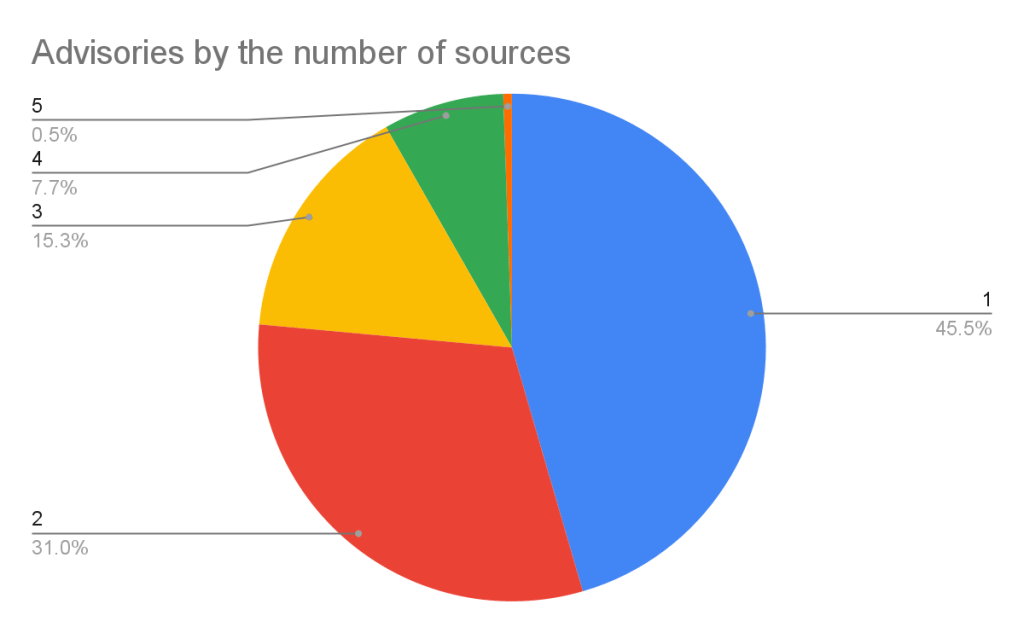
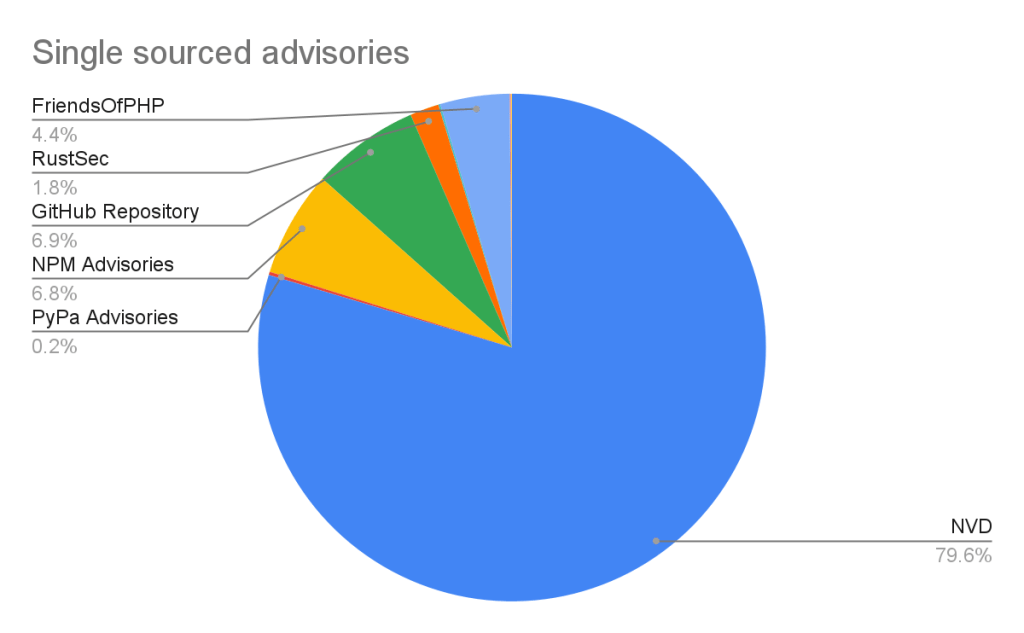
Summing the reviewed advisories from each source yields a total larger than the actual reviewed count. That’s because multiple sources often flag the same vulnerability—over half of advisories have more than one source. Of those with just one source, the overwhelming majority come from NVD/CVE, the noisiest source, which still justifies its inclusion.
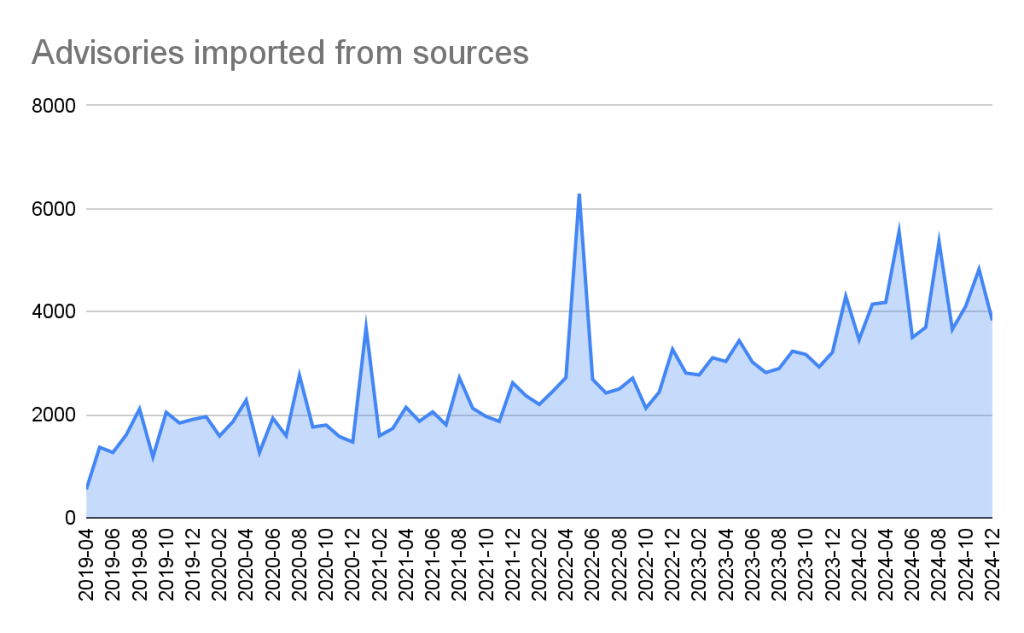
Imports from all sources rose 39% in 2024, driven mainly by an increase in published CVE records.
CVE Numbering Authority Role
Beyond the Advisory Database, GitHub operates as a CVE Numbering Authority (CNA) for any repository hosted on the platform. This lets GitHub issue CVE IDs for vulnerabilities reported by maintainers and publish the records to the broader CVE database once a repository advisory goes live.
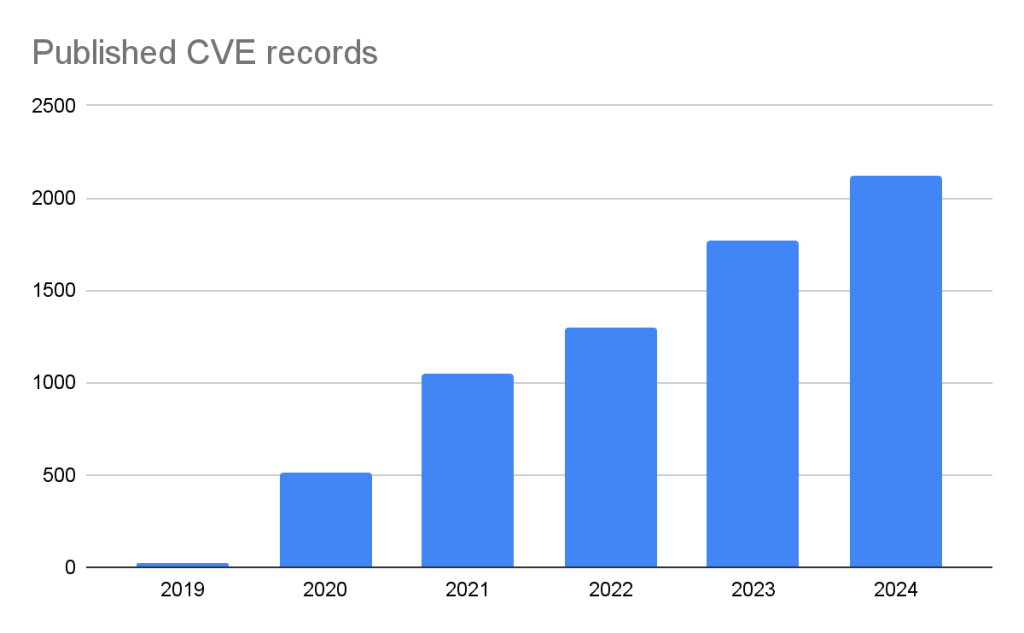
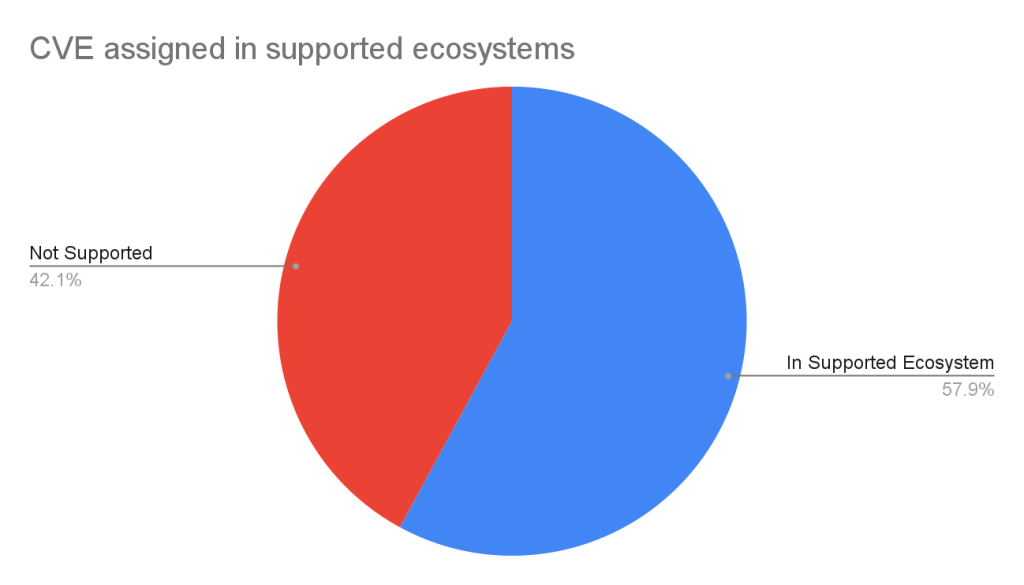
GitHub published more than 2,000 CVE records in 2024, making it the fifth-largest CNA in the CVE Program. This CNA service is open to all repositories, not just those in supported ecosystems.
Prioritizing with CVSS, CWE, and EPSS
The volume of reported vulnerabilities makes prioritization essential. GitHub supplements each advisory with three data points to help triage:
- Severity Rating/CVSS: A rating from low to critical, with a corresponding CVSS score and vector.
- CWE: Identifiers that programmatically classify the type of vulnerability.
- EPSS: The Exploit Prediction Scoring System, devised by FIRST, which scores the likelihood a vulnerability gets exploited within 30 days.
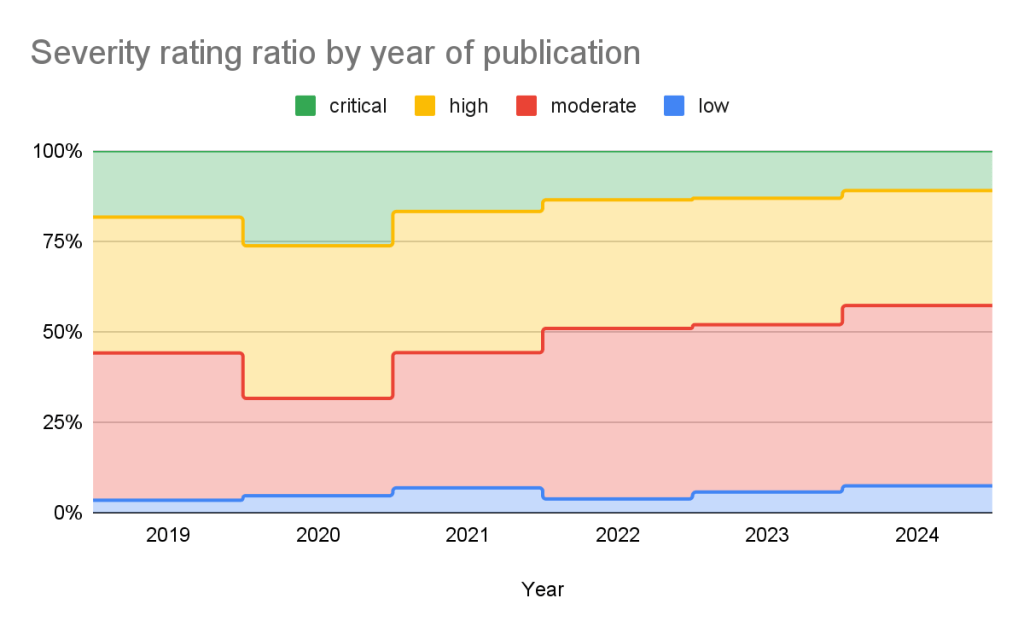
Every advisory gets a severity rating drawn from the four levels defined in the Common Vulnerability Scoring System: Low, Medium/Moderate, High, and Critical. According to these ratings, half of all vulnerabilities—15% Critical and 35% High—warrant immediate or near-term remediation attention.
CVSS base scores reflect intrinsic characteristics constant over time and assume a reasonable worst-case impact across varied environments. Your own worst case might differ, though—a crash in a word processor isn’t as severe as one in a server. To filter alerts by vulnerability type, GitHub supports CWE identifiers. That allows filtering out recurring issues like regular expression denial of service (CWE-1333) or always surfacing SQL injection (CWE-89).
| Rank | CWE ID | CWE name | Number of advisories in 2024 | Change in rank from 2023 |
|---|---|---|---|---|
| 1 | CWE-79 | Improper Neutralization of Input During Web Page Generation (‘Cross-site Scripting’) | 936 | +0 |
| 2 | CWE-200 | Exposure of Sensitive Information to an Unauthorized Actor | 320 | +0 |
| 3 | CWE-22 | Improper Limitation of a Pathname to a Restricted Directory (‘Path Traversal’) | 259 | +2 |
| 4 | CWE-20 | Improper Input Validation | 202 | +0 |
| 5 | CWE-94 | Improper Control of Generation of Code (‘Code Injection’) | 188 | +2 |
| 6 | CWE-89 | Improper Neutralization of Special Elements used in an SQL Command (‘SQL Injection’) | 181 | +3 |
| 7 | CWE-352 | Cross-Site Request Forgery (CSRF) | 161 | -4 |
| 8 | CWE-284 | Improper Access Control | 153 | +4 |
| 9 | CWE-400 | Uncontrolled Resource Consumption | 149 | -3 |
| 10 | CWE-287 | Improper Authentication | 124 | +11 |
When that’s insufficient, EPSS can help narrow the field further. It synthesizes data from multiple sources into a probability that a given vulnerability faces exploitation attempts in the next 30 days. Focusing on vulnerabilities with an EPSS score of 10% or higher—about 7% of all entries in the Advisory DB—covers nearly all vulnerabilities likely to see active exploit traffic.
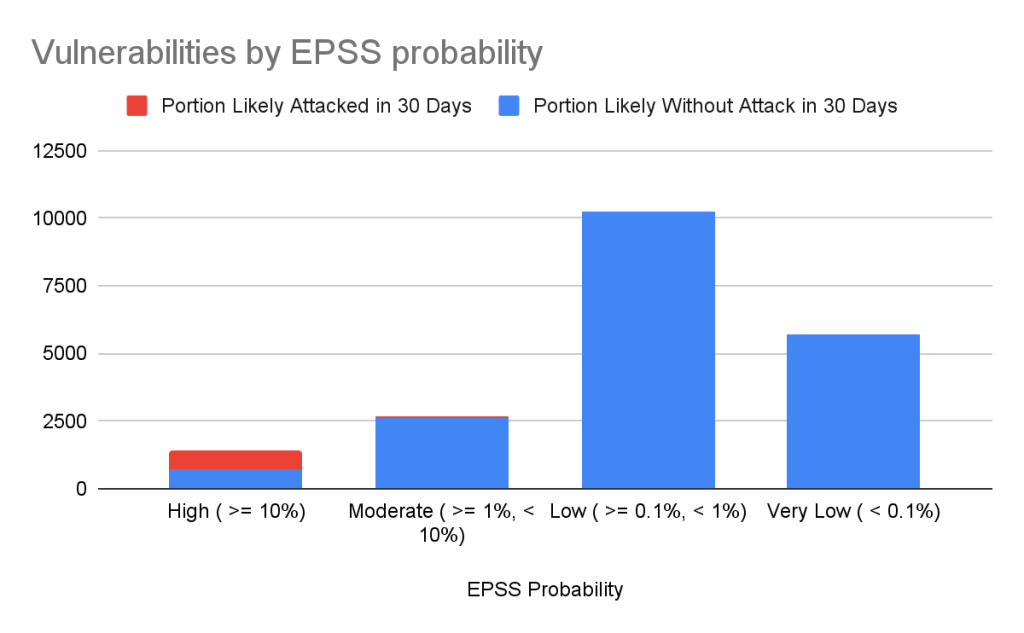
| EPSS probability | Vulnerabilities in range | Percentage of overall vulnerabilities | Expected vulnerabilities in range attacked within the next 30 days | Percentage of total attacked vulnerabilities |
|---|---|---|---|---|
| High ( >= 10%) | 1440 | 7.17% | 741 | 85.96% |
| Moderate ( >= 1%, < 10%) | 2687 | 13.37% | 84 | 9.74% |
| Low ( >= 0.1%, < 1%) | 10264 | 51.09% | 35 | 4.06% |
| Very Low ( < 0.1%) | 5701 | 28.37% | 2 | 0.23% |
EPSS comes with caveats worth remembering:
- Low-probability events still occur.
- EPSS measures likelihood, not confirmed exploitation.
- Scores update daily and shift as new information emerges; today’s low-probability vulnerability could become high-probability tomorrow.
How Dependabot Uses the Data
The Advisory Database powers more than just a reading list. Services like Dependabot leverage it to automate dependency security:
- Identify vulnerabilities: Flag projects using affected package versions.
- Suggest fixes: Recommend updated versions that resolve the vulnerability.
- Reduce noise: Alert only when the installed version is actually impacted.
For maintainers, publishing a repository security advisory is the direct path to tap both the Advisory Database and GitHub’s CNA services, ensuring vulnerabilities reach the broader CVE community.



