
Picking a target worth auditing
Before diving into code, you need a clear idea of what you’re looking for. “Interesting” varies by research goal, but several concrete filters help narrow things down: language, project type, update frequency, contributor activity, and adoption. For vulnerability research, the number of affected users matters, and GitHub’s dependency graph is a quick way to gauge that — you can see who depends on a project directly from its repository page. Stars and recent commits give a secondary signal of health and community size.
The Open Source Security Foundation (OpenSSF) has done most of this filtering work for you. Their Criticality Score assigns projects a number from 0 (least-critical) to 1 (most-critical), based on factors like repository age, code review activity, and dependent count. GitHub Security Lab uses this score to build its target lists. A spreadsheet with scores for the top 100k GitHub repositories, collected by Google, is publicly available and a good starting point.
|
The original issue We won’t be finding new vulnerabilities in this blog post. Instead, we will use the deserialization of user-controlled data issue we reported to illustrate this post. |
For a hands-on example, consider Frigate — an open source NVR application. It ranked around 16k with a criticality score of 0.45024 nearly two years ago. While not “critical” (threshold is >0.8), it has over 1.6 million container downloads, making it a worthwhile subject. Its previous audit, published as the Frigate Code Review, uncovered a PyYaml deserialization flaw, and it works well as a model for the whole workflow.
Setting up a clean audit environment
Once you’ve picked a target, fork it through either the GitHub UI or the CLI:
gh repo fork blakeblackshear/frigate --default-branch-only
Because you are auditing a specific commit, reset your fork to that state. If the audit commit is 9185753322cc594b99509e9234c60647e70fae6f, you can point the fork’s main branch to it using the GitHub API’s update a reference endpoint:
gh api -X PATCH /repos/username/frigate/git/refs/heads/dev -F
sha=9185753322cc594b99509e9234c60647e70fae6f -F force=true
Or you can do the same locally with git:
git clone https://github.com/username/frigate
cd frigate
git checkout 9185753322cc594b99509e9234c60647e70fae6f
git push origin HEAD:dev --force
With your fork pinned to the right commit, you’re ready to scan.
Enabling code scanning with CodeQL
Code scanning is GitHub’s in-repository alerting system: it surfaces findings, helps with triage, and tracks fixes. Combined with a static analysis engine like CodeQL, it lets you run semantic and dataflow analysis across your code. CodeQL treats code as data, so you query it for patterns — sinks, sources, and the paths between them.
|
Learning CodeQL If you are interested in learning more about the world of static analysis, with exercises and more, go ahead and follow @sylwia-budzynska’s CodeQL zero to hero series. You may also want to join GitHub Security Lab’s Slack instance to hang out with CodeQL engineers and the community. |
A one-click default setup exists, but manual configuration teaches you what’s happening underneath. To do it:
- Prepare your fork. Remove existing workflows to avoid running anything unwanted. You can do this from the browser: navigate to
/.github/workflows, press.to open the web-based VS Code editor (github.dev), delete files, commit and push. - Enable Actions. If prompted, go to the Actions tab and enable workflows.
- Configure scanning. In the Security tab, choose “Code scanning,” then “Configure scanning tool.”
- Use advanced setup. For CodeQL analysis, click “Set up,” then “Advanced.” GitHub opens the file editor with a generated workflow based on the CodeQL starter workflow, pre-filled with your repository’s branches and languages.
|
Actions documentation |
The workflow defines an analyze job per language. Each job clones the repo, initializes CodeQL (which downloads the latest binaries or packs), attempts an autobuild to populate a database, and runs analysis. For interpreted languages autobuild just passes through. The final step finalizes the database and executes the query suite; this is the slowest part.
Going beyond default queries
Default CodeQL queries are tuned for low false-positive rates so they’re safe for CI pipelines. Security researchers may prefer the opposite trade-off, favoring lower false-negative rates. That’s where the Security Lab’s Community Packs come in. They contain audit models and community-contributed queries not shipped by default. The integration is one line in the Initialize step:
- name: Initialize CodeQL
   uses: github/codeql-action/init@v2
   with:
     languages: ${{ matrix.language }}
     packs: githubsecuritylab/codeql-${{ matrix.language }}-queries
More granular control is available through a custom configuration file, which lets you select paths, disable queries, and add pack-based queries selectively.
Understanding alerts
When the run completes, results appear in the Security tab. A single alert page gives you the “what, where, when, and how” at a glance — the finding title, affected file and line, when it was introduced, and a code excerpt around the sink.
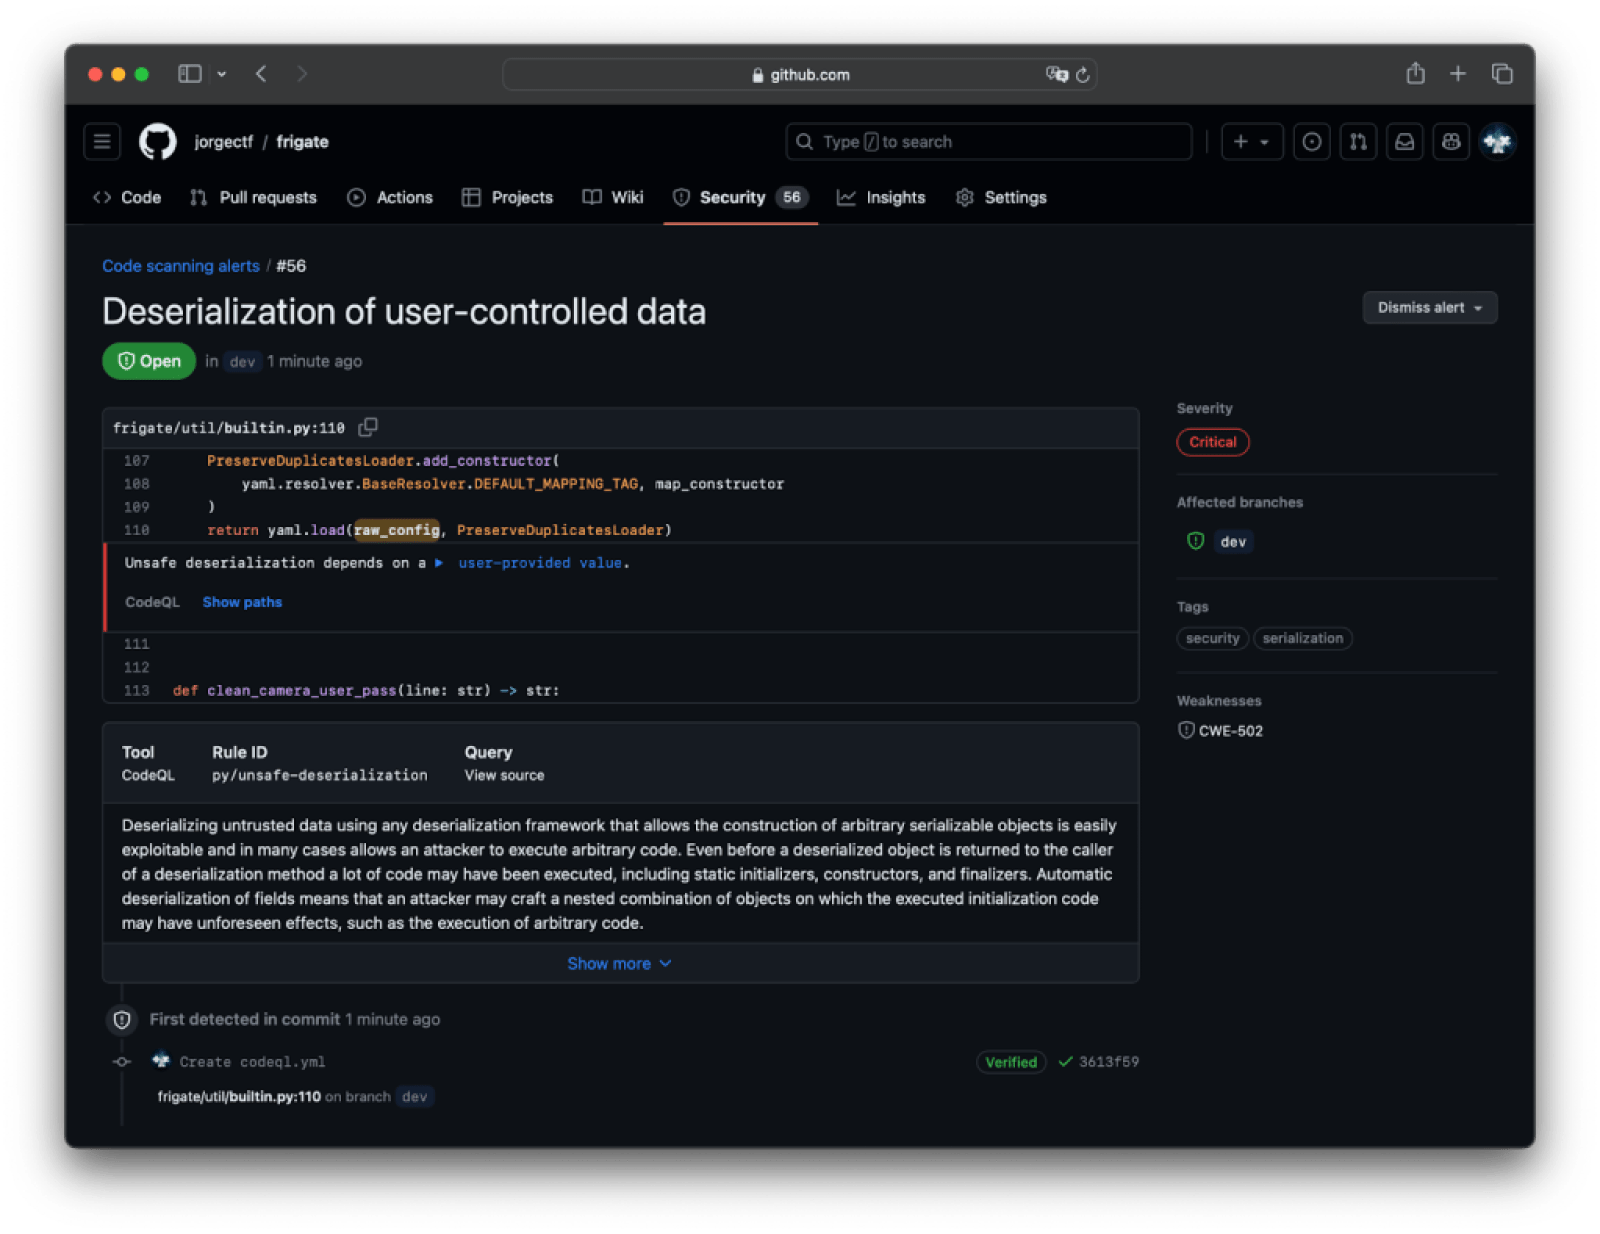
Code excerpts are only the last mile, though. To judge exploitability you need the whole flow. Click “Show paths” to see where the data starts, what it passes through, and where it lands.
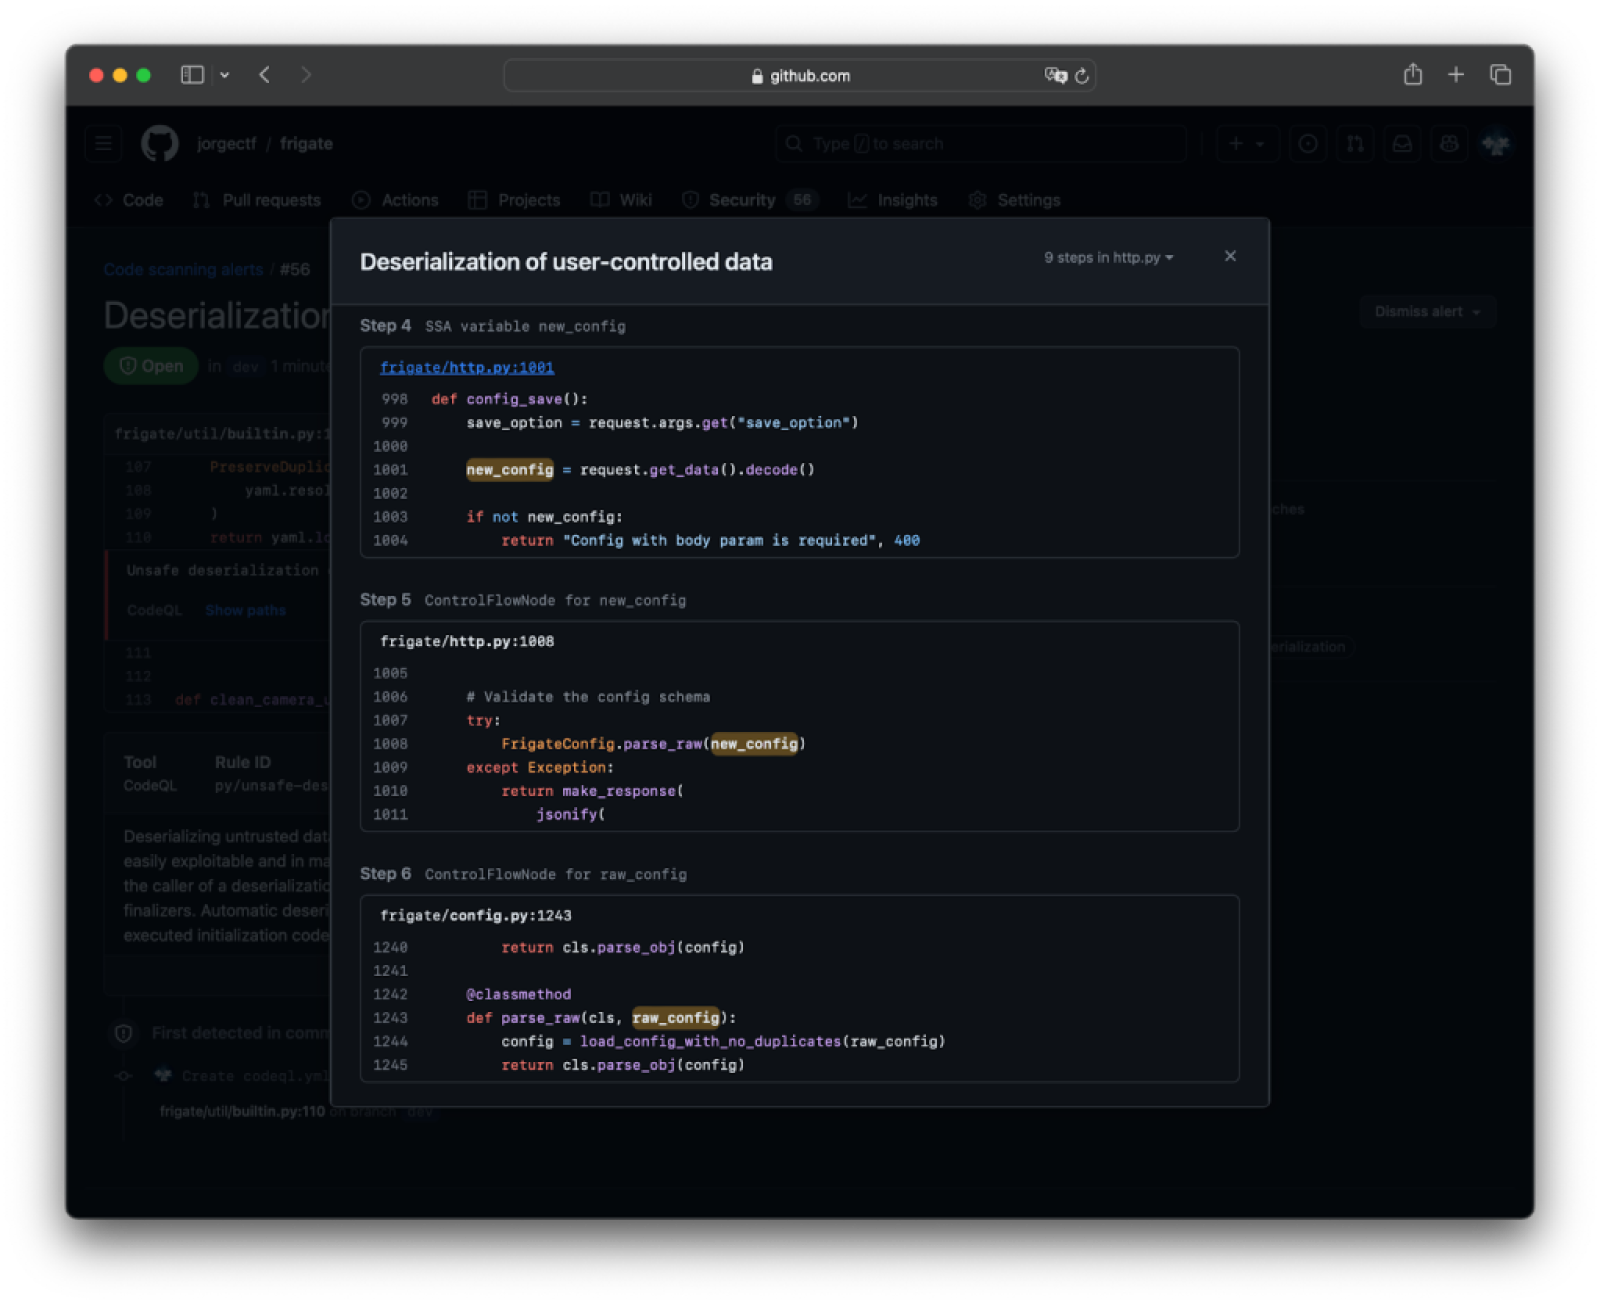
In the Frigate alert, the flow began with user-controlled input — a remote flow source in CodeQL terminology — traveling without sanitizers to a PyYaml load() sink. But the alert alone didn’t tell us whether the Loader instance is exploitable — i.e., whether it permits custom constructors. You need to know which Loader class is in use and what it inherits.
Here, static analysis has limits. CodeQL’s PyYaml model covered a small set of known safe loaders at the time, but it missed classes that inherit from risky ones. The Frigate audit initially suggested switching from yaml.loader.Loader to yaml.loader.SafeLoader. Yet the corresponding code scanning alert stayed open: the query didn’t understand that the fix required inspecting the inherited loader type.
The feedback loop that improves CodeQL
Finding a false negative demonstrates why the security ecosystem works better when findings flow back. There are two high-leverage ways to contribute:
- Report false positives and false negatives in github/codeql. For the Frigate case above, the issue was raised as github/codeql#14685 and was monitored by engineers and maintainers.
- Contribute new models or queries to the Community Packs. Pull requests with new models, or issues describing them, benefit other researchers — and since CodeQL engineers monitor the repo, well-received suggestions can make it into the main query suite and reach a much wider audience.
|
CodeQL model editor If you are interested in learning about supporting new dependencies with CodeQL, please see the CodeQL model editor. The model editor is designed to help you model external dependencies of your codebase that are not supported by the standard CodeQL Libraries. |
Once you have tracked the data flow, confirmed the loader behavior, and verified the vulnerability is exploitable, you can move to the next phase: reproducing it in an isolated environment before reporting privately.
Running the vulnerable target in Codespaces
For the exploitation phase, we use Codespaces as our environment. It gives us an isolated, ephemeral cloud development environment based on Visual Studio Code, which we can spin up or tear down with one click. The free tier includes 120 core hours per month, which is plenty for this kind of research.
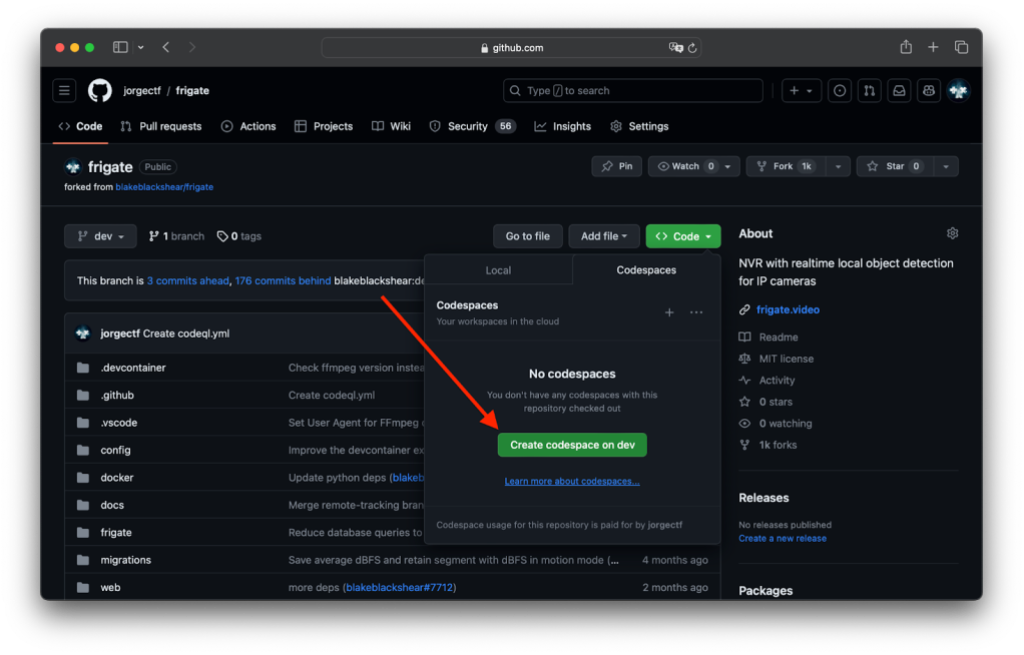
Creating a codespace is straightforward: open the repository on GitHub, click the "Code" button, and select "Create codespace on dev." The Frigate project ships a custom devcontainer configuration, so the environment is largely pre-configured for VSCode integration.
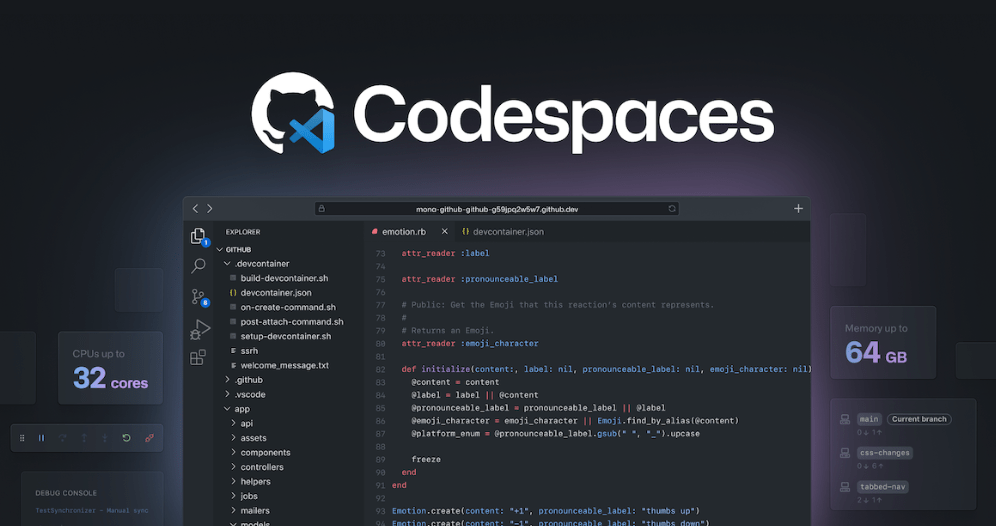
Once the codespace is up, close the browser tab and connect through the Remote Explorer extension in your local VSCode. That gives you a fully integrated environment with built-in port forwarding.
Preparing the environment for debugging
Security research without a working debugger is often guesswork. You need to observe how the application reacts to your inputs, so getting the debugger running is the first task after the codespace is created.
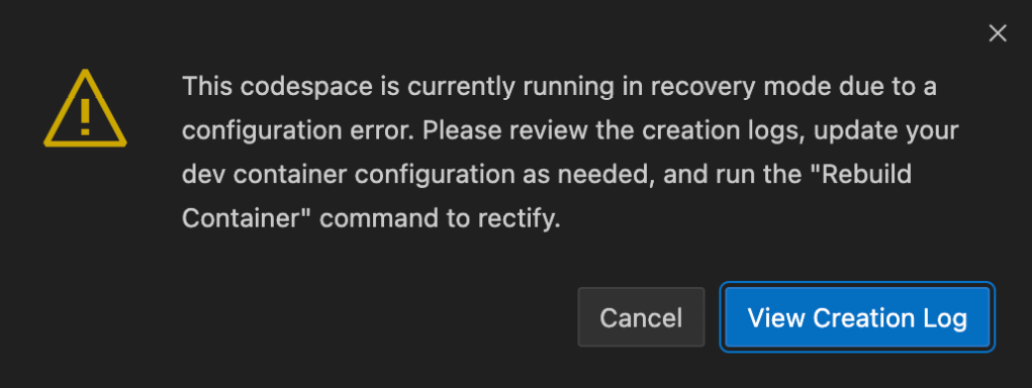
The initial container build will fail:
|
Customizing devcontainer configuration For more information about .devcontainer customization, refer to the documentation.
|
The custom devcontainer configuration was built for a local VSCode installation, not for a cloud environment. Checking the "View Creation Log" reveals that Docker is looking for a device that doesn't exist in the Codespaces VM:
To fix the build, edit /workspaces/frigate/docker-compose.yml and comment out three things:
- The
devicesproperty - The
deployproperty - The
/dev/bus/usbvolume
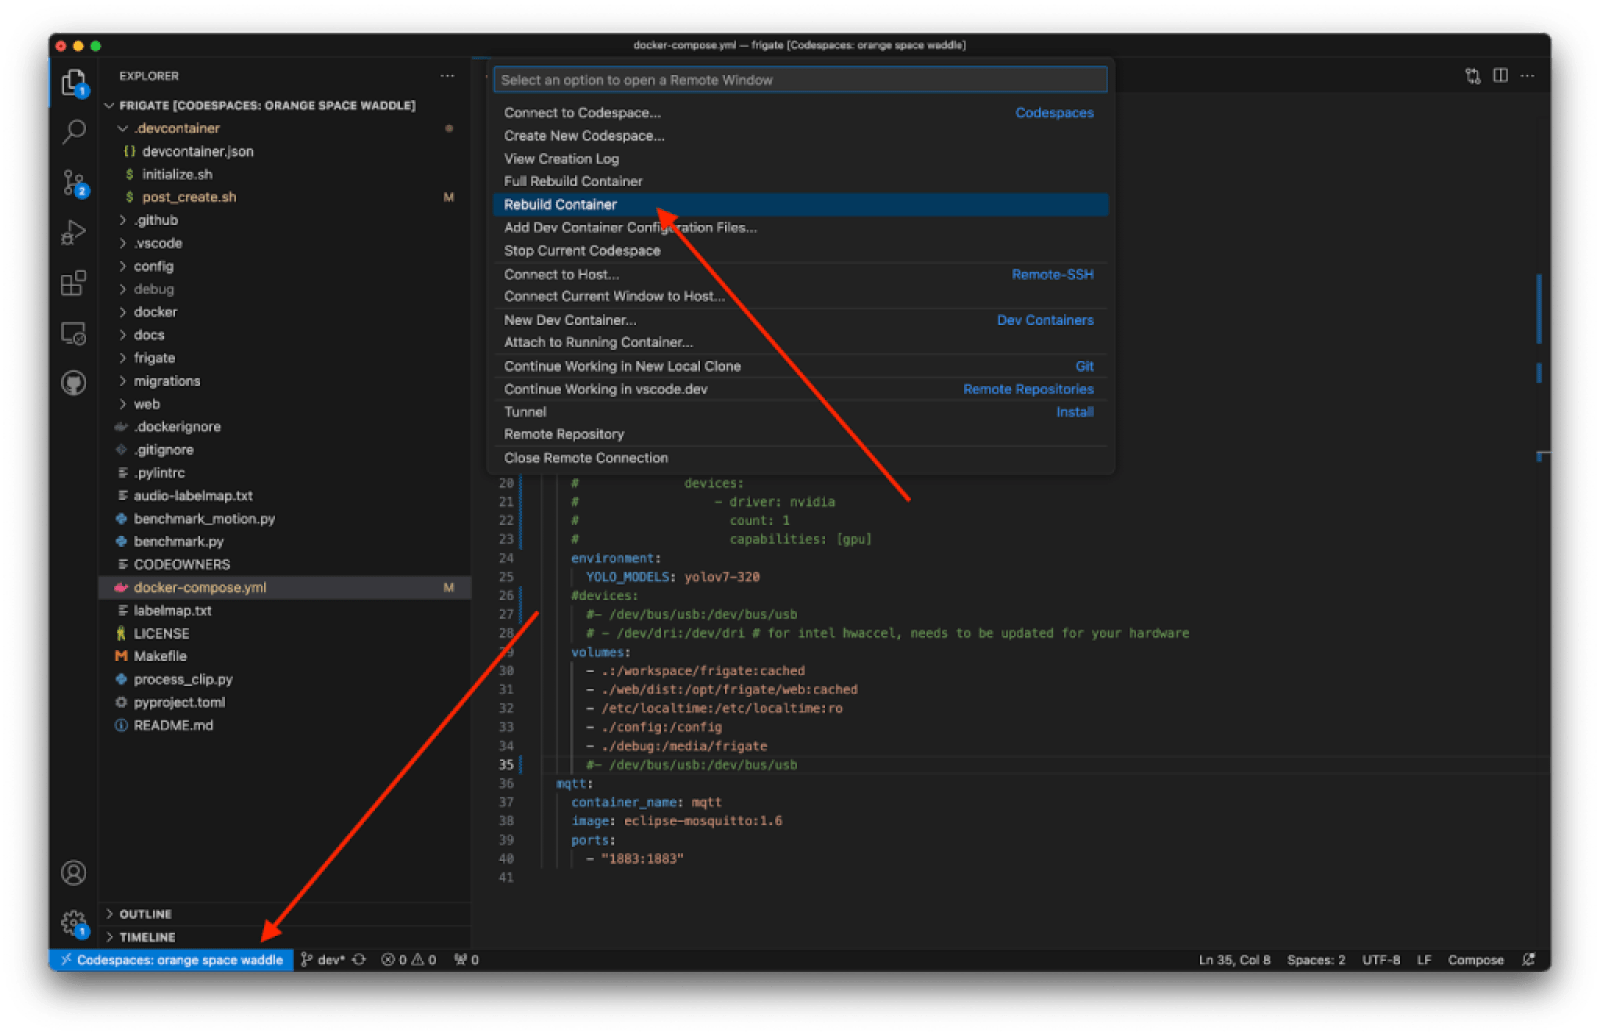
Then open /workspaces/frigate/.devcontainer/post_create.sh and remove lines 5-9. After those changes, rebuild the container:
ERROR: for frigate-devcontainer - Cannot start service devcontainer: error gathering device information while adding custom device "/dev/bus/usb": no such file or directory
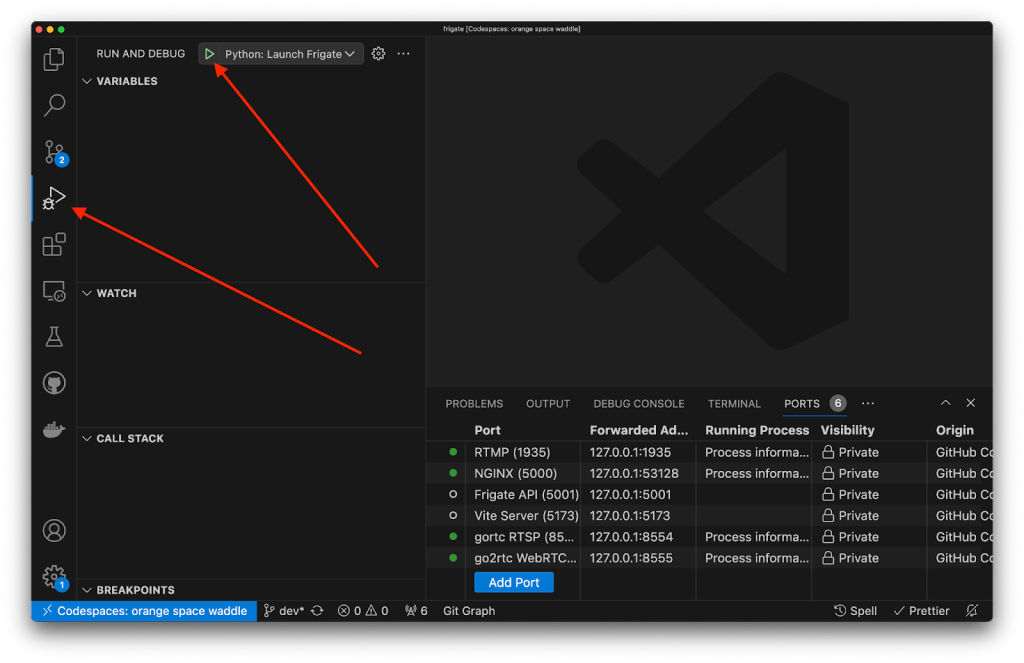
The rebuilt environment shows six forwarded ports, but the Frigate API we want to target through nginx is not running yet. To start it, go to the "Run and Debug" panel and click the green play button to launch Frigate under the debugger:
With port forwarding active, you can use network tooling such as Burp Suite or Caido from your native host. Send the proof-of-concept request:
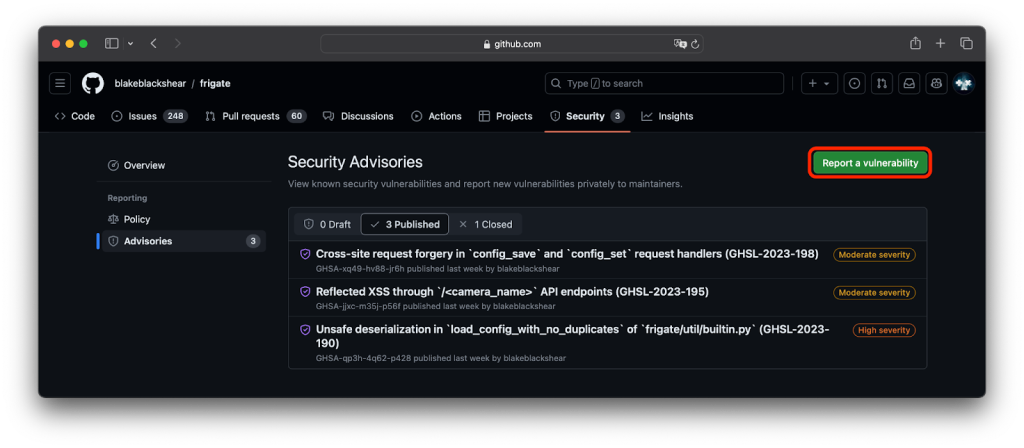
The debugging session lets you trace how new_config flows into yaml.load and eventually creates the /tmp/pwned file, confirming the exploit works:
POST /api/config/save HTTP/1.1
Host: 127.0.0.1:53128
Content-Length: 50

!!python/object/apply:os.popen
- touch /tmp/pwned
Reporting through private vulnerability reporting
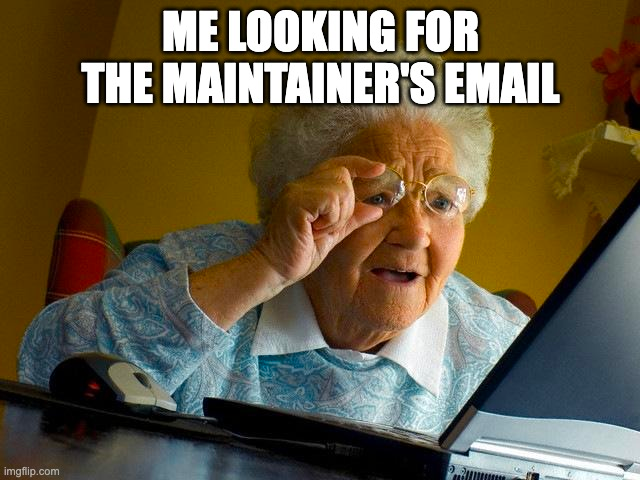
Coordinating a fix with open source maintainers has always been awkward: finding a private channel, keeping the conversation focused, and agreeing on severity and scope over text. Private vulnerability reporting (PVR) gives researchers and maintainers a single, interactive space to work through those details and keep downstream consumers informed.
PVR is opt-in, so maintainers must enable it on their repositories. When a project doesn't offer a secure reporting channel, we open issues like this one to nudge them toward enabling it.
Filing the report
With the PoC confirmed against Frigate, we file the report through PVR. The form supports structured metadata: affected products, a custom CVSS score, a linked CWE, and credit assignment with defined roles:
That structure ensures precise documentation and proper recognition for everyone involved.
|
Closing the loop Published advisories resulting from private vulnerability reports can be included in the GitHub Advisory Database to automatically disclose your report to end users using Dependabot! |
Once the report is in, both sides can collaborate in a chat thread and work on a temporary private fork. The maintainer, in turn, can request a CVE identification number directly from the advisory — GitHub typically issues the CVE within about two days. Full documentation on the workflow is available in the PVR docs.
GitHub as an end-to-end research platform
GitHub ties the whole vulnerability lifecycle together: code scanning surfaces candidate flaws during development, Codespaces provides a disposable environment for reproducing and debugging them, and private vulnerability reporting turns a confirmed issue into a coordinated, credited disclosure with a CVE attached. That end-to-end workflow lowers the barrier for researchers and gives maintainers the structure they need to respond quickly.



