
Start with the Network panel
Before you can design a sensible caching strategy, you need a clear picture of what your web app actually requests from the network. The Network panel in your browser's DevTools gives you exactly that: every row corresponds to a specific URL your app loaded, along with timing details for that request.
A simple site with a handful of static HTML, CSS, JavaScript, and image files may make it easy to keep track of everything. But the picture gets complicated quickly once you introduce third-party resources from content delivery networks, dynamic API calls, and server-generated responses. A caching approach that works well for a few small stylesheets is unlikely to suit hundreds of large images.
Know what you load and when
Two dimensions matter when analyzing network activity: what gets loaded and when it gets loaded.
Some requests are unconditional. The navigation request for your initial HTML, for example, fires the moment a user visits a URL. That HTML may contain hardcoded references to critical CSS or JavaScript files, and those must load before your page becomes interactive. Treat these as part of the critical loading path, and cache them aggressively to keep things reliably fast.
Other requests—API calls, lazy-loaded assets, and the like—may not start until well after the initial load finishes, sometimes only after a specific sequence of user interactions. Because those requests can vary from visit to visit, a less aggressive caching strategy is usually appropriate for anything you identify as outside the critical path.
Use the Name and Type columns for the "what"
The Name and Type columns give you a concrete view of what your app loads. The Name column shows the last portion of the requested URL's path—https://example.com/main.css appears simply as main.css.
The characters after the final period in that path, such as css, are the URL's extension, and they generally map to the resource type shown in the Type column. So v2.html is listed as a document, while main.css is a stylesheet.
Use the Waterfall column for the "when"
The Waterfall column shows timing, and reading it from top to bottom reveals a lot about load order. The length of each bar reflects the total time spent loading that resource. The first request is always for the HTML document—v2.html in the examples above. All subsequent requests flow from that initial navigation, based on which images, scripts, and styles the document references.
Once the HTML finishes loading, the requests for its referenced subresources begin. The browser can fetch multiple subresources concurrently, which is why the bars for main.css and logo.svg overlap in the waterfall. In a typical sequence, the JavaScript file—main.js here—starts last and finishes after the other resources have completed.
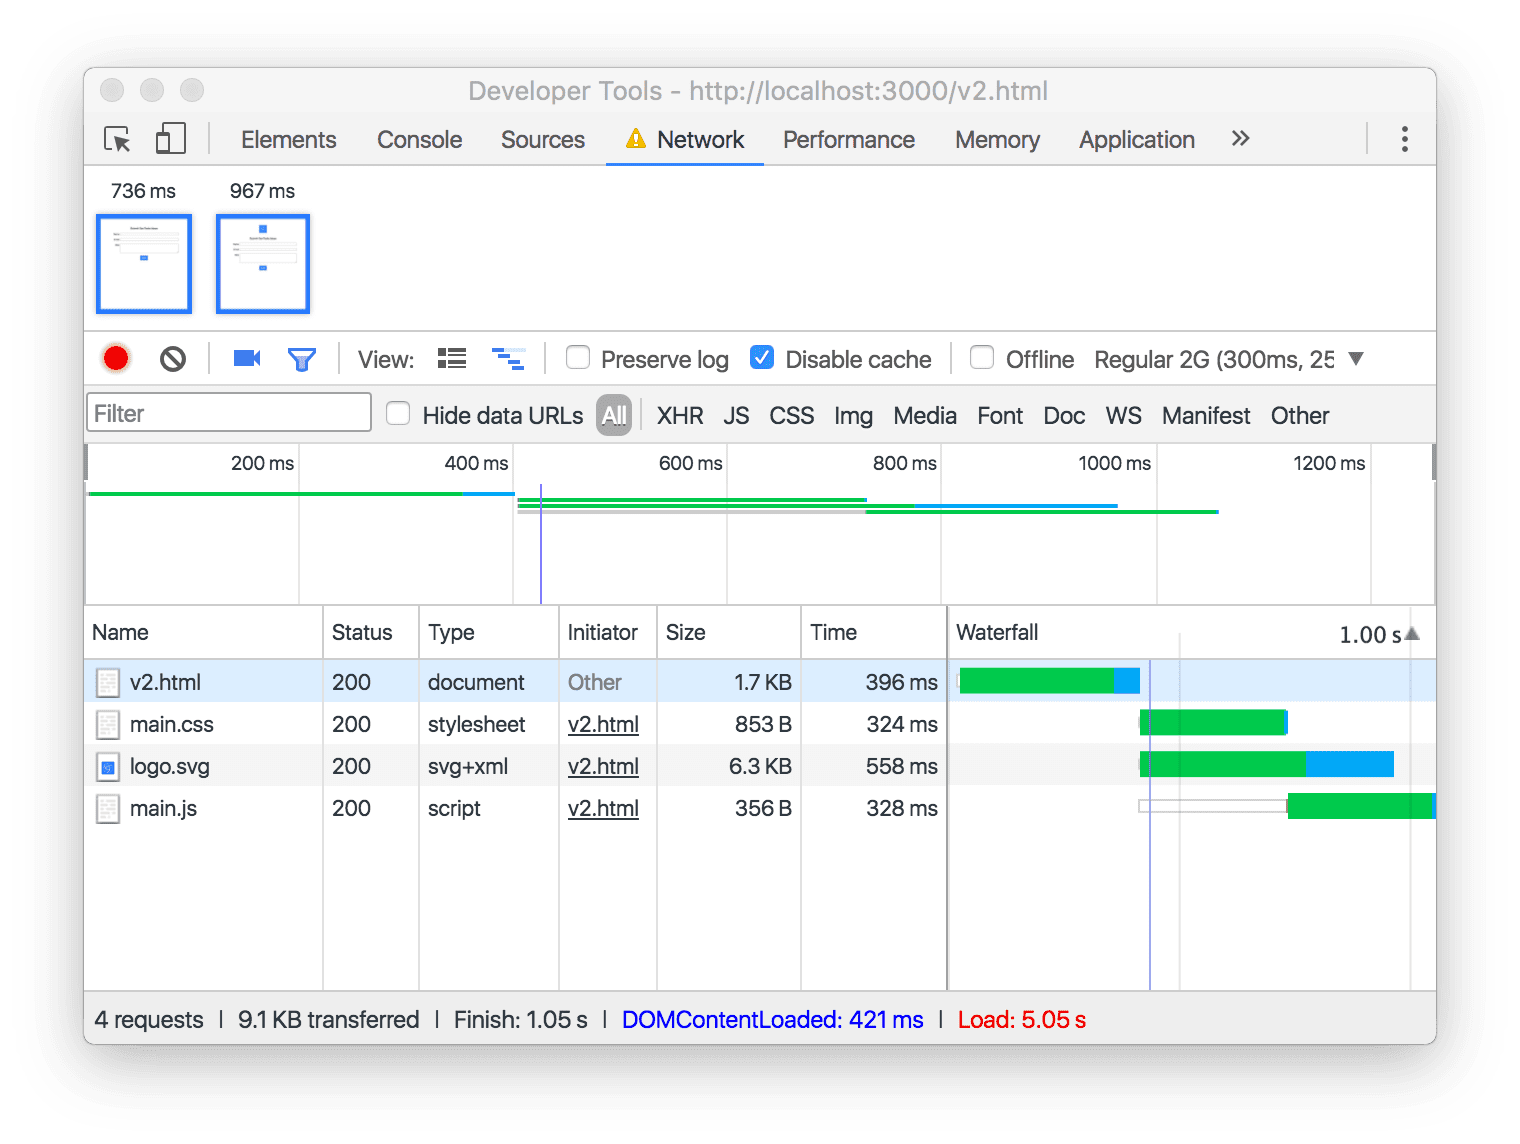
By pairing what each row in the Network panel represents with when its request fires, you can start separating the resources that demand aggressive caching from those that can tolerate a lighter touch.



