

Observability Hits a Protocol Wall
Slack’s network monitoring once ran on a comfortable hybrid model: commercial SaaS products for external traffic into its edge, custom-built tools for internal paths between Availability Zones. It worked — until HTTP/3 changed the rules.
HTTP/3 runs on QUIC, which uses UDP rather than TCP. That distinction broke virtually everything in the monitoring stack. No SaaS observability tool Slack investigated supported HTTP/3 probing out of the box. And the internal Blackbox Exporter (BBE), the backbone of its Prometheus-based monitoring, had no QUIC support either.
The scale of the problem was the hard part. Without the ability to probe hundreds of thousands of HTTP/3 endpoints, the team couldn’t detect regressions to HTTP/2 or measure accurate round-trip times from the client side.
QUIC Support, Landed By an Intern
The fix came from an unexpected place: Sebastian Feliciano, an intern on the team, scoped and implemented QUIC support for Prometheus BBE, then open-sourced the contribution.
The central design decision was picking an HTTP client. Feliciano chose quic-go as the foundation, based on its adoption across other open source projects and its first-class support for building HTTP clients in Go.
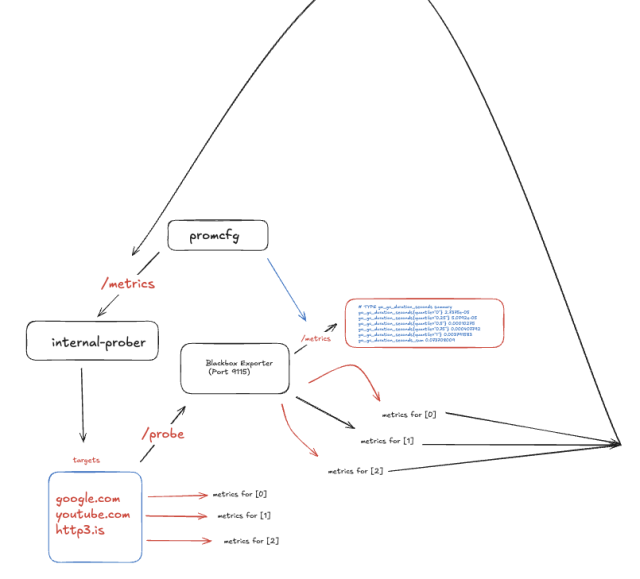
The integration followed BBE’s existing architecture:
http3Transport := &http3.Transport{
    TLSClientConfig: tlsConfig,
    QUICConfig:      &quic.Config{},
}

client = &http.Client{
    Transport: http3Transport,
}
The result is a functional and configurable HTTP/3 probe inside Prometheus that follows BBE’s established configuration patterns.
Open-sourcing the work was one hurdle; getting it merged was another. Maintainers don’t always merge PRs fast, and an internship timeline is limited. Feliciano architected an in-house system that used the new upstream code, keeping Slack’s path forward unblocked while the community contribution made its way through review.
Operational Payoff
The switch surfaced immediate operational gains:
- Single pane of glass: HTTP/1.1, HTTP/2, and HTTP/3 metrics now live together in Grafana, simplifying correlation with other telemetry.
- Reliable alerts: The new probes support more dependable health and performance alerts on HTTP/3 endpoints.
- Easier debugging: One centralized data view means performance issues can be cross-checked against other metrics faster.
The contribution also benefits the wider Prometheus community — other organizations facing the same HTTP/3 adoption problems can use the QUIC support without building it themselves.
What’s Next
The work is far from finished. Two enhancements are on the roadmap:
- SNI routing tests: Validating that the Server Name Indication (SNI) extension is handled correctly by edge infrastructure, ensuring shared-IP gateways route traffic to the right backend and serve matching certificates.
- End-to-end path visualization: Mapping the network hop-by-hop from monitoring agent to endpoint, pinpointing exactly where latency spikes or packet loss occurs — beyond simple up/down checks.
The HTTP/3 configuration is available in the configuration documentation for community experimentation and use.
Lessons Learned
Monitor first, migrate second. Observability as a precursor to migration makes everything faster. Proving QUIC’s value to internal stakeholders before fully committing enables deeper investment in its long-term future.
Open source contributions pay dividends. When a protocol shift like QUIC exposes a gap in existing tooling, filling that gap publicly is a win for everyone. Community support creates long-term shared benefit.
Bet on your interns. Feliciano’s proactiveness and problem-solving pushed an observability gap to an open-sourced solution, bringing tangible black-box monitoring benefits to the team.



