Soil data without a road map
Most underground fiber buildouts follow paved roads, because that is where the necessary equipment, materials, and labor can be moved efficiently, and where technicians can return for maintenance over a network’s multi-decade lifespan. But in the Democratic Republic of the Congo (DRC), only about 3,000 km of paved roads exist across a country of 2.3 million km². Surveying potential fiber routes under those conditions required a different method for gathering the subsurface data that drives construction cost estimates. Meta worked with Sofrecom, Groupe CVA, and SOTEK Group on a combined approach using dynamic cone penetrometers (DCP) and gamma-ray spectrometers to accelerate route surveys and improve cost projection accuracy.
From medium-level to low-level route design
Fiber projects typically begin with identifying sites to connect. Teams use OpenStreetMap (OSM) data and network planning tools, in conjunction with telecom industry partners, to iterate on route options and select a medium-level design — that is, which road to follow. After refinement with project partners, the process moves to low-level design — which side of the road — informed by field surveys that collect data on construction obstacles.
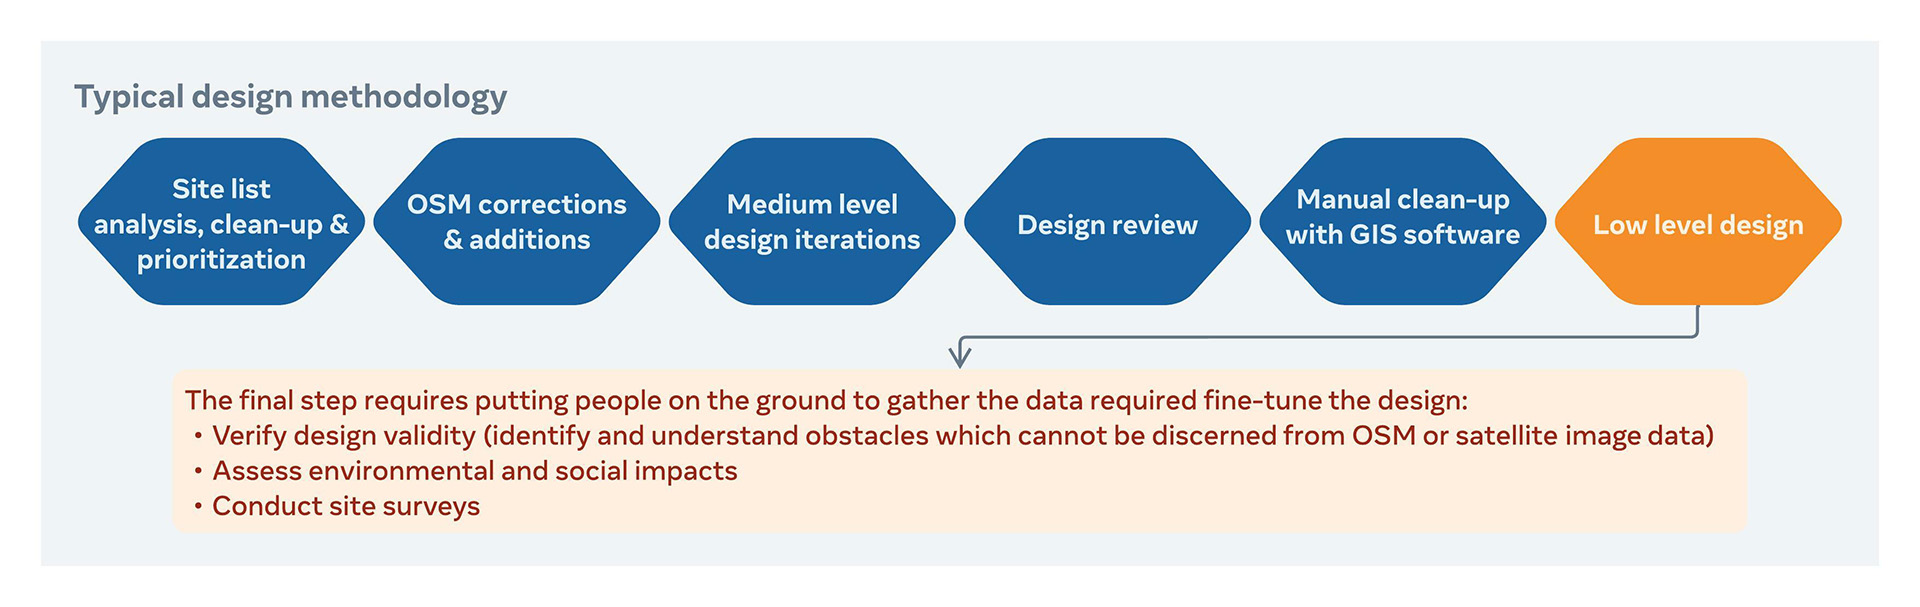
These surveys also determine the quantity of materials needed and the preferred construction methods, which feed into time and cost estimates. Those estimates are the key inputs for assessing a project’s financial viability.
Two ways to classify soil
For underground fiber, soil classification directly affects cost estimates in two ways: the volume of soil that must be trenched and the soil’s density, since harder ground requires more effort and drives up cost.
A dynamic cone penetrometer estimates soil density (in megapascals) by correlating the force needed to drive a steel rod into the ground with the depth achieved per strike. Repeat strikes down to a target depth, such as two meters, produce a soil density profile from surface to final depth. A DCP is inexpensive and easy to use, but it is slow, and its measurements are highly localized. Providing meaningful data requires dozens of tests per kilometer, which adds significant time and cost to a survey.
A gamma-ray spectrometer, a tool common in mining, operates on different principles. Trace amounts of radioactive elements exist in many minerals, and a spectrometer can detect and measure emissions from elements such as uranium, thorium, and potassium. Since those radiation levels depend on soil composition and particle size, the data can be analyzed to estimate soil density. Spectrometers are more expensive and complex than a DCP, but data collection is highly automated, and a person can be quickly trained to gather the data, with post-processing and analysis handled remotely by specialist geologists.
Spectrometers also detect soil heterogeneity — shifts in subsurface conditions. Similar emissions across an area indicate homogeneous soil, which matters because the spectrometer results must be calibrated against control data. In this project, the control data came from DCP measurements.
Field process
The solution proposed by Sofrecom and its partners Groupe CVA and SOTEK Group paired a DCP with a spectrometer mounted to a high-clearance 4×4 vehicle for a high-speed soil density classification process:
- A SOTEK team operating the spectrometer gathered gamma emissions, then transmitted the data to CVA in France for post-processing — where it was combined with geological data from other sources — and expert analysis.
- Preliminary results were returned to the field, along with specific locations where a second SOTEK team collected DCP measurements. That data was then handed back to CVA to finalize the soil density analysis.
This arrangement minimized the number of DCP tests required: a relatively small set of DCP results was used to calibrate a much larger volume of spectrometer data. In parallel, an application running on a mobile device with GPS captured traditional survey data points, including construction obstacles and environmentally or culturally sensitive areas. The combined output was a detailed geographical information system map that layered typical survey data over soil condition information, without extending the survey timeline.
A notable limitation: a spectrometer cannot capture data below paved surfaces, because asphalt and concrete contain some of the same radioactive elements found in soils, skewing any results. But with so few paved roads in DRC, the lack of pavement actually became an advantage rather than a constraint.
Improving project economics
Cost is frequently the barrier to connectivity, particularly in emerging markets where deployment costs rival those in developed markets while short-term returns are muted by low internet penetration and lower incomes. Reducing the unknowns in subsurface conditions with reliable ground truth data lowers project risk and helps more projects clear their initial business case hurdles.
Building on the approach
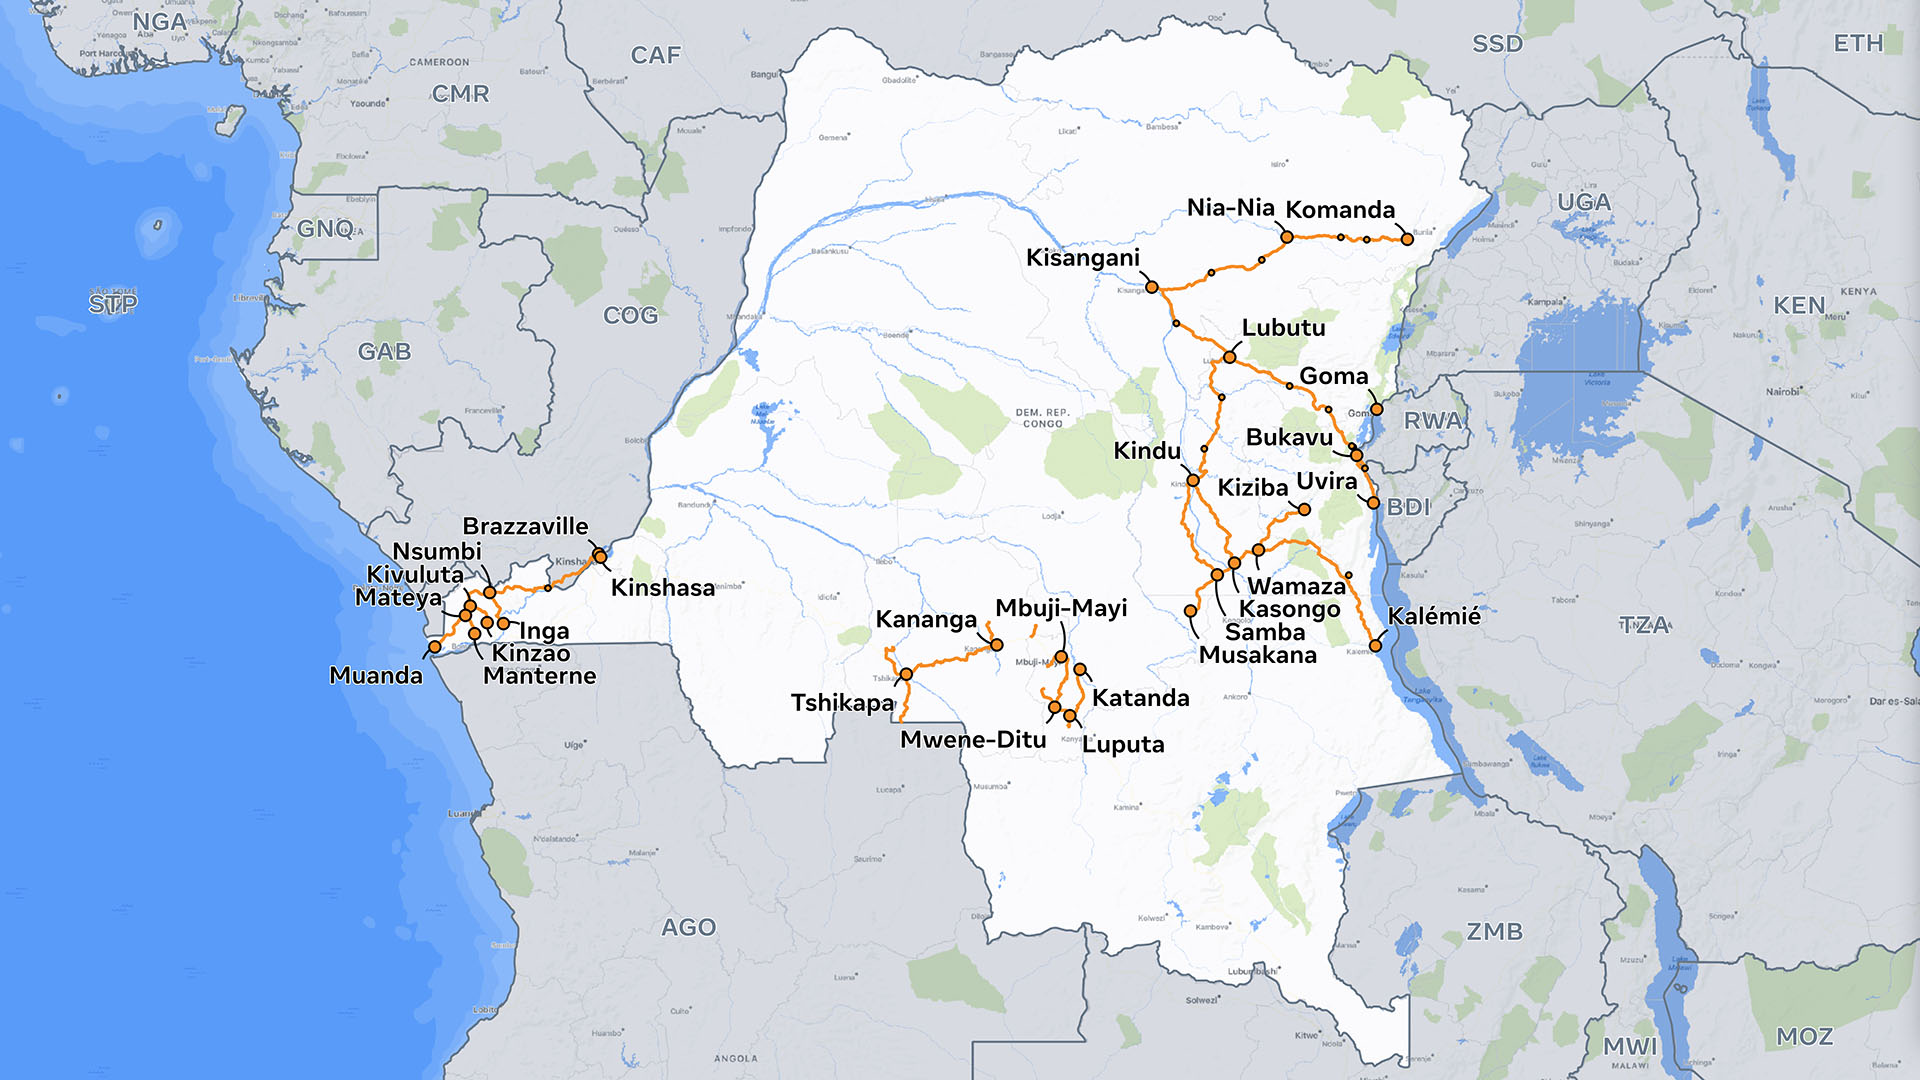
The technique has already been used to survey more than 5,000 km of potential fiber routes across DRC, and there is likely room to extend it. Hyperspectral imaging, ground penetrating radar, and advances in computer vision and machine learning can all be applied to survey data sets to further lower costs, increase process velocity, improve fidelity and accuracy, and enable in-country partners to take on more of this technical work locally.
These open, shared-infrastructure projects — including internet exchanges and carrier neutral colocation, alongside private- and public-sector investment in fiber and subsea cables — provide the capacity that entire market ecosystems can draw on. Efforts like this soil survey method are part of building the network foundation that shared networks depend on.



