
Debugging JavaScript and SEO Issues: A Toolchain Overview
JavaScript-powered sites can present unique challenges when it comes to indexing. Fortunately, Google provides a range of tools for diagnosing these issues. The right choice depends on whether you are checking a single page before launch or investigating broader site health after deployment.
Starting with Lighthouse for Page-Level Checks
For an initial assessment of a single page, Lighthouse is a practical starting point. Its built-in SEO audits can catch common mistakes like missing meta descriptions or invalid headings, and it provides a quick snapshot of a page's basic discoverability.

Keep in mind that Lighthouse runs in your browser, not from the perspective of a crawler. Browsers do not respect robots.txt directives when fetching subresources, whereas Googlebot does. As a result, a resource that Lighthouse can load might be blocked for Googlebot. Use Lighthouse to identify potential red flags, then confirm them using more specialized tools.
Verifying a URL with Google's Testing Tools
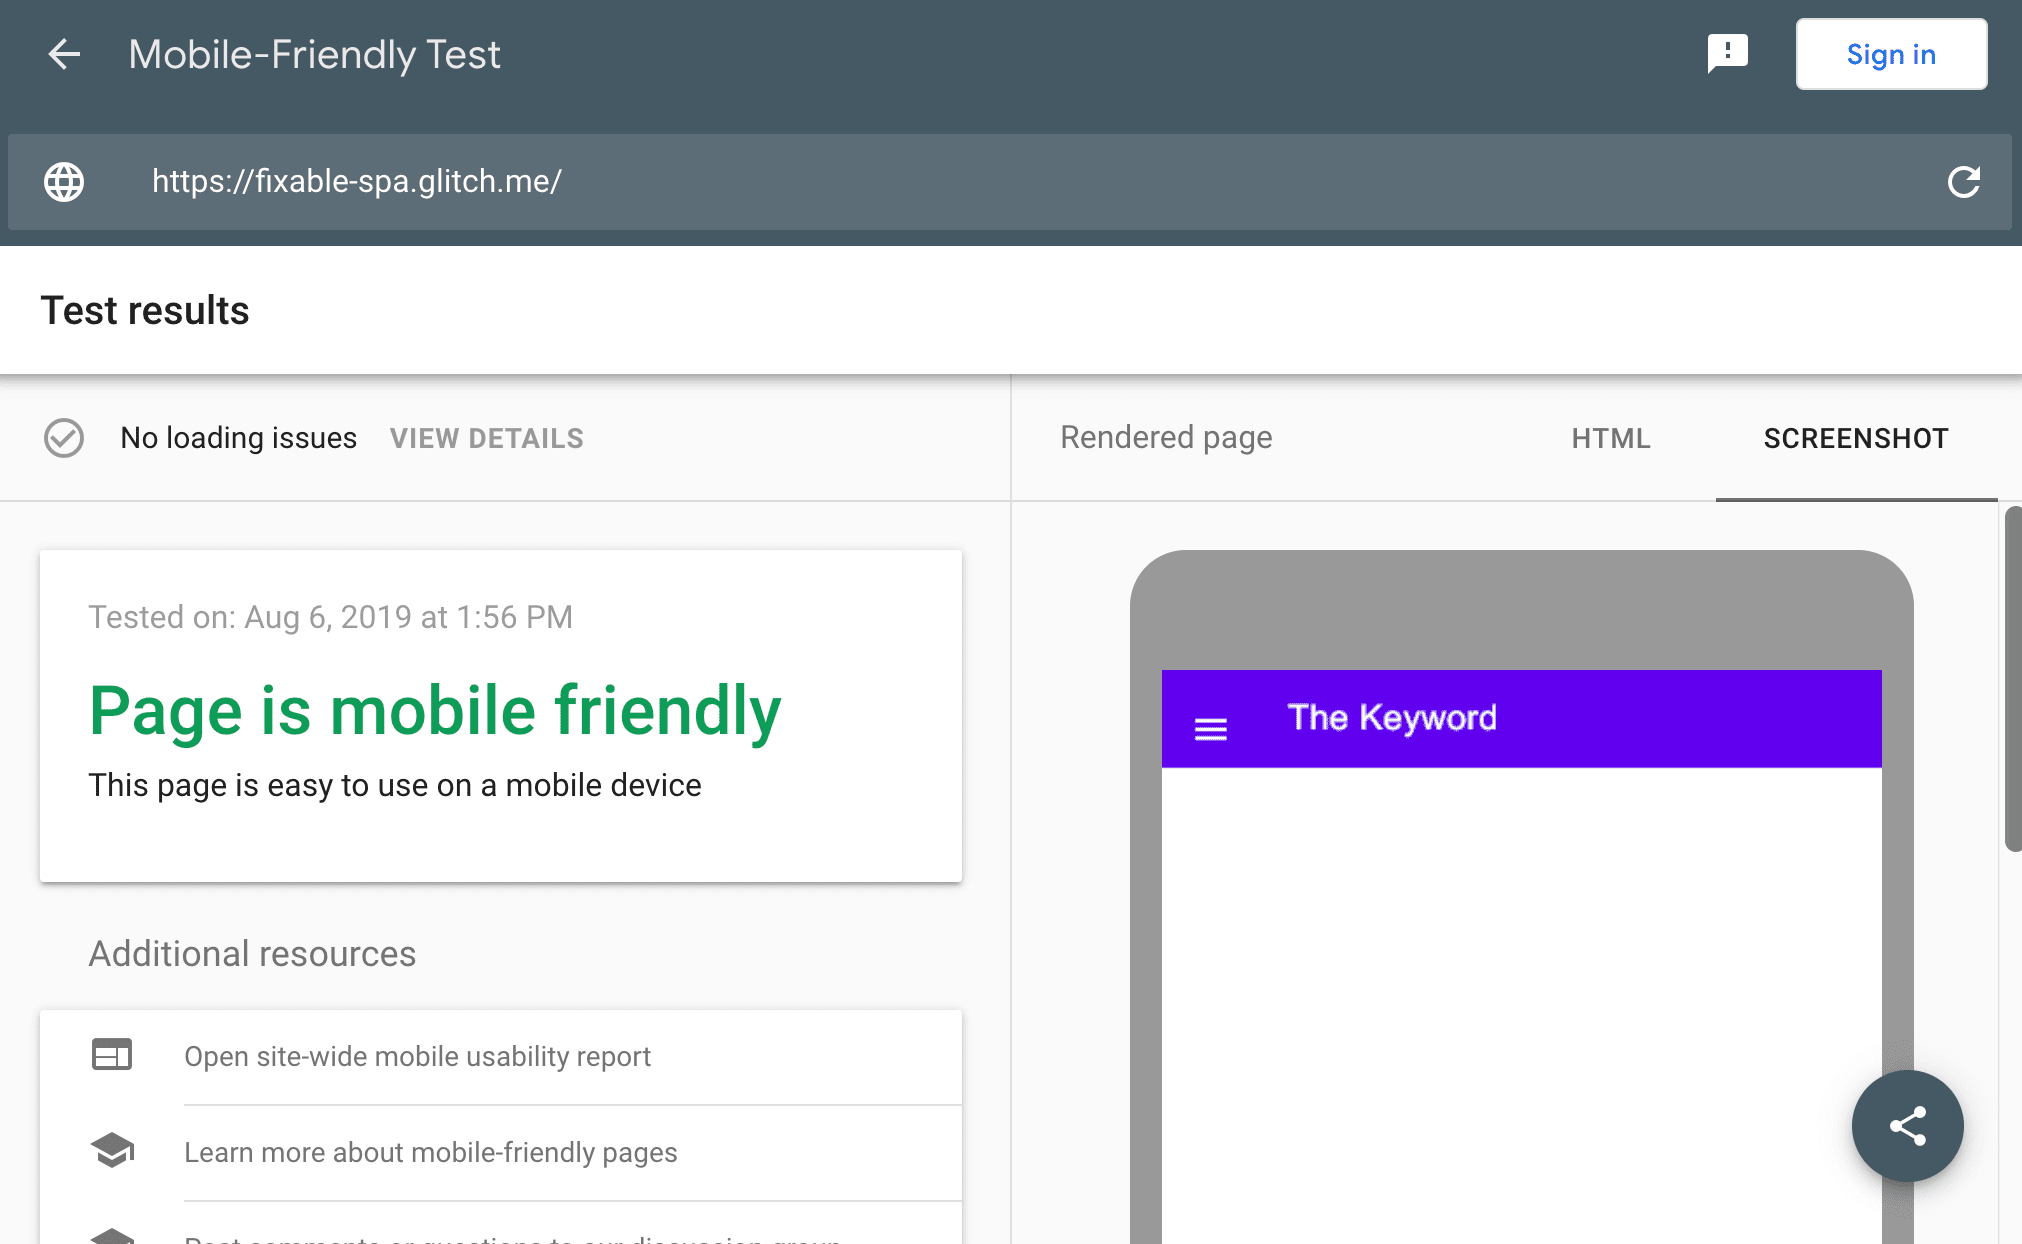
For a closer look at how Googlebot actually renders a page, Google's testing suite is more accurate. These tools are especially useful during development to verify a page before it goes live:
- The Mobile-Friendly Test confirms that the page meets Google's mobile usability standards for search ranking.
- The Rich Results Test validates structured data to see if the page is eligible for rich features.
- The AMP Test checks the validity of AMP HTML.
These tests can be run against temporary public URLs generated from your local development environment using tunneling utilities like local-tunnel or ngrok, which enables a fast iteration loop.
The output from these tools provides useful diagnostic details, including:
- The final rendered HTML as interpreted by Googlebot.
- A summary of loaded resources and explanations for any that failed.
- Console log messages, JavaScript errors, and their stack traces.
For quickly investigating a specific previously indexed page, the URL Inspection Tool in Google Search Console provides deeper insights.
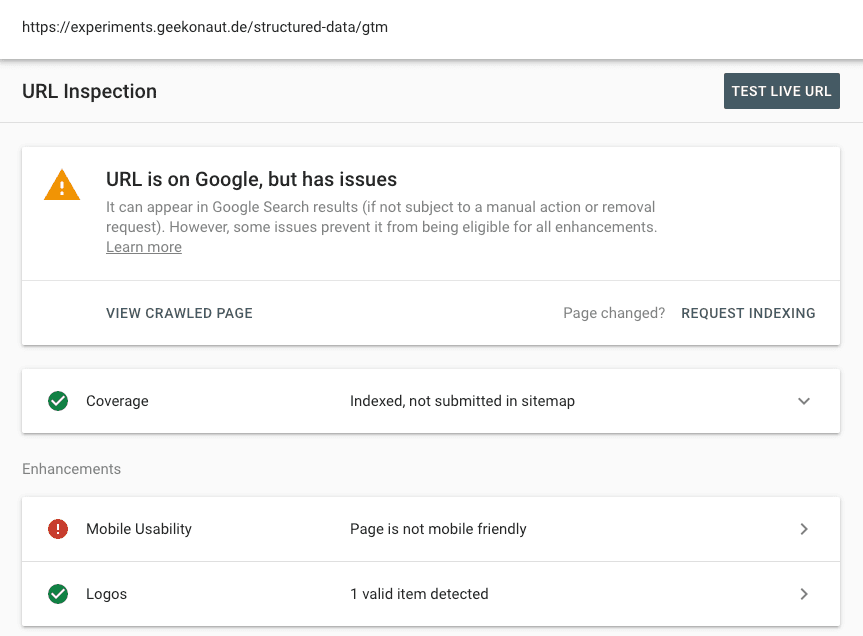
This tool offers information on whether a URL is in the index, what the rendered HTML looked like during the last crawl, and what a fresh crawl would render.
Monitoring Site Health in Search Console
Once your site is live and you need to monitor the whole domain rather than a single URL, Google Search Console becomes the primary resource.
Indexing Issues: The Coverage Report
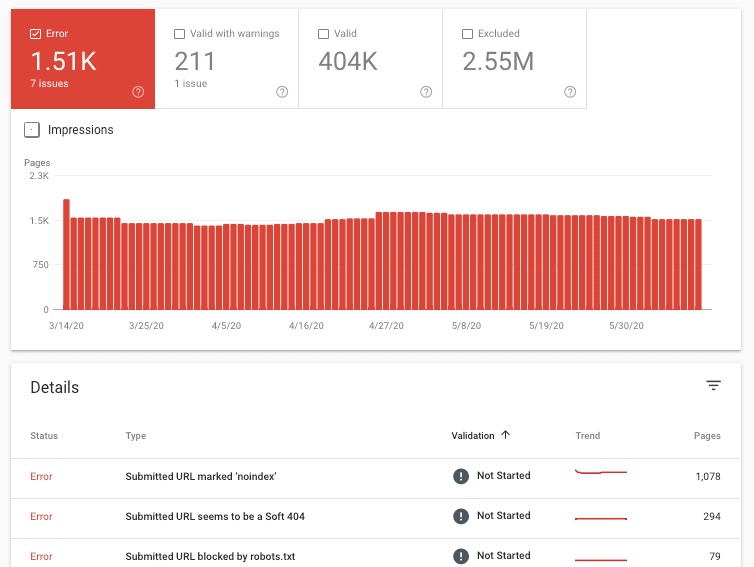
The Coverage report aggregates indexation status for every URL Googlebot has discovered. It categorizes pages as indexed or lists them with specific error reasons, such as "Submitted URL not selected as canonical" or "Crawled – currently not indexed." This helps you spot patterns that affected multiple pages during a recent deployment.
Performance Overview: The Core Web Vitals Report
Alongside crawler access, the Core Web Vitals report s valuable for front-end engineers. This report uses field data from Chrome users to provide an aggregate view of how pages perform regarding real-world speed and stability metrics.
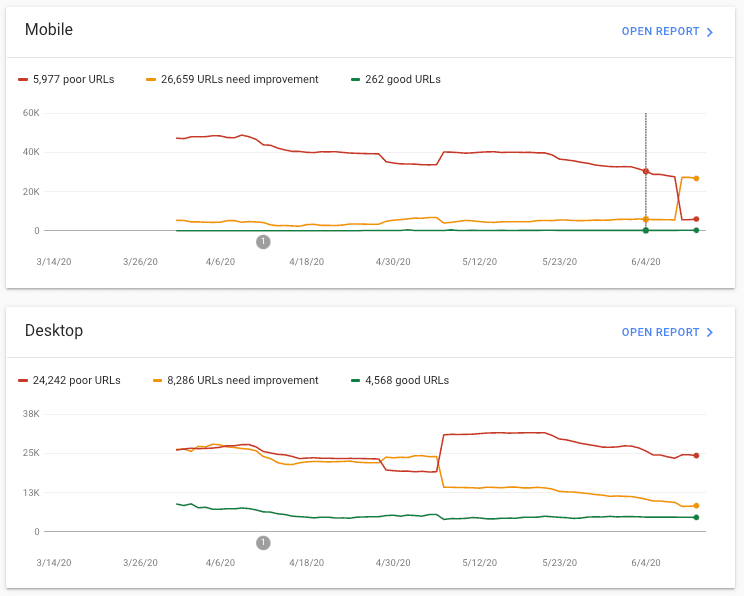
This tool helps you identify specific page groups that may be experiencing layout shifts or poor interactions, which could be related to AJAX updates or dynamic content rendering.
Selecting the Right Tool for the Job
No single tool covers every scenario. The practical approach is to combine them based on your current objective. Use Lighthouse as a quick pre-commit sanity check for your rendered DOM. The testing tools are best used in the build pipeline to validate final templates. The URL Inspection Tool is a robust diagnostic for troubleshooting suspected problems on previously indexed URLs. And finally, Search Console provides ongoing site-wide monitoring that can route you back to targeted debugging whenever new issues appear. Documentation on fixing common JavaScript problems is available in the Google Search developers guide.


